The Curtain Falls on the Script: Why I Believe It's Time to StopHello everyone, this is EC.
From late June through July, we experienced a full-fledged primary uptrend in crypto, driven by a weakening U.S. Dollar. From the script preview to the execution of the plan, every step has been clearly documented.
However, today, I want to share a different, more cautious perspective: I believe this script may be nearing its end.
I. Reviewing the Script and the "Bubble's" Manifestation
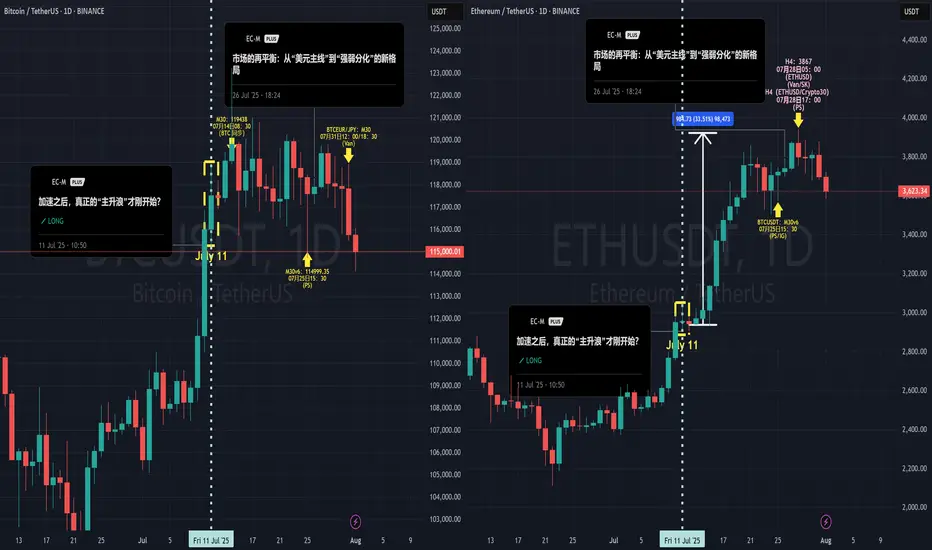
After our call on July 4th that the "main bull wave" was starting, the market perfectly delivered on our expectations. What was more interesting was the clear internal divergence we saw, which precisely confirms our thesis about the "bubble phase" from my June 20th article, "The Restlessness Before the Storm."
When the market's sentiment "balloon" is inflated to its limit, capital flows from the leader (BTC) to assets with higher elasticity (ETH).
The data shows that from July 11th until now, ETH took the baton and rallied approximately 35%, while BTC gained only around 6% in the same period. When BTC is already showing signs of fatigue while ETH is still in a solo rally, that in itself is a major signal that the bubble is nearing its end.
II. A Shift in the Winds: The Hand Inflating the Balloon is Loosening
I've chosen to end this script at this moment based on signal changes on two levels:
The "External Factor" Shift: The Potential Strengthening of the USD
As I pointed out in my July 28th analysis, "The Market's Rebalancing," the market has entered a phase of "strength-weakness divergence." This trend is now becoming more evident: the U.S. Dollar, cushioned by the extreme weakness of currencies like the Japanese Yen, has begun to show signs of a broad strengthening. Concurrently, U.S. and European stock markets are pulling back in sync, and global risk appetite is cooling.
The external environment that fueled the bubble (a weak USD) is beginning to falter.
The "Internal Factor" Signal: The Needle Point Inside the Balloon
The crypto market itself is also showing warning signs of resistance (see attached ETH daily chart). When the leading asset, ETH, begins to show signs of stagnation and distribution at its highs, it's like the balloon meeting the needle point. The exhaustion of internal momentum is a more direct warning than changes in the external environment.
III. Conclusion: Don't Be Greedy for the Last Dessert
When the core logic driving the rally (a weak USD) begins to waver, and the market simultaneously shows internal signs of exhaustion, my choice is to end this script and take profits off the table.
This doesn't mean I think crypto will crash immediately. But "no longer suitable to hold" implies that, in my view, the risk/reward ratio at the current level is no longer attractive. A grand feast is coming to an end, and being greedy for the last dessert is not a wise move. Shifting from "buying the dip" to "cautious observation" is the rational choice.
Thank you for your attention and for following along this past month.
#Crypto #BTC #ETH #TradingView #MarketAnalysis #RiskManagement
Community ideas
AMZN Earnings Flush — Gamma Flip to the Downside. 8/1AMZN Earnings Flush — Gamma Flip to the Downside, Eyes on $215 Support!
🔍 GEX & Options Flow Insight (1st Image Analysis)
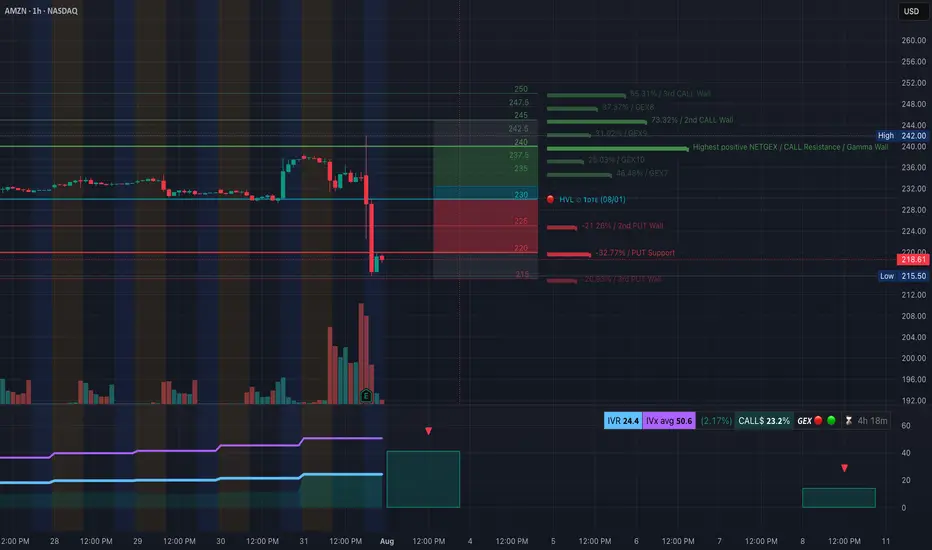
AMZN collapsed post-earnings, breaking through major gamma support levels and flipping into a negative gamma environment. Price is now pressing against a critical $215–218 demand zone, with GEX showing heavy put concentration.
* Call Walls & Resistance:
* 📍 $230.00–$234.00 → Former gamma pivot now acting as strong resistance
* 📍 $237.50 → Prior support zone; now a sell wall
* 📍 $244.00 → Highest Positive NET GEX / Gamma Wall (too far for immediate recovery unless momentum shifts)
* Put Walls & Support Zones:
* 🛡️ $222.18 → 2nd Put Wall resistance-turned-support
* 🚨 $218.00 → Current price — key defense line
* 📉 $215.50 → Hard put wall support — losing this could accelerate selloff toward $210
* Volatility Insight:
* IVR 24.4, IVx Avg 50.6 → Elevated IV post-earnings
* Call flow 23.2% → Bearish options flow bias
* GEX sentiment: 🔴🟡🔴 = Negative gamma = higher volatility risk to downside
✅ Option Trading Suggestion:
Bias: Bearish unless AMZN reclaims $224+
Strategy: Bear put spread
* Entry Idea: Buy 220P / Sell 215P for Aug 2 or Aug 9 expiry
* Invalidation: Strong daily close above $224
* Target: $215 → $210
Why this works: Negative gamma positioning means market makers hedge by selling into weakness, accelerating downside moves. The inability to reclaim $224 confirms the bearish structure.
🧠 Technical Analysis (1H Chart) (2nd Image Analysis)
Market Structure & SMC:
* 🟥 CHoCH confirmed after earnings drop
* ❌ Lost all recent BOS levels in one sharp flush
* Price trapped under former OB resistance at $224–230
Trendline Dynamics:
* Broke out of prior bullish channel to the downside
* New descending channel forming with lower highs
SMC Zones:
* 🟩 Demand Zone: $215.50–$218.00 → Immediate defense
* 🟥 Supply Zone (Purple Box): $224–$230 → Sell wall
🔄 Price Action & Key Levels
* Support:
* ✅ $218.00 → Current defense
* ✅ $215.50 → Last line of gamma support
* 🚨 Below $215.50 → Sell momentum can accelerate to $210
* Resistance:
* 🚩 $224.00 → First reclaim needed for relief rally
* 🚩 $230.00–$234.00 → Heavy resistance
🧭 Scalping / Intraday Trade Setup
🟥 Bearish Setup (Preferred):
* Entry: Failed reclaim of $224
* Target 1: $218.00
* Target 2: $215.50
* Stop: Above $224
🟩 Bullish Reversal Setup:
* Entry: Strong reclaim of $224 with volume
* Target 1: $230.00
* Target 2: $234.00
* Stop: Back under $222
🔁 Summary Thoughts
* AMZN flipped from bullish gamma to negative gamma — puts are now driving price action.
* As long as price stays under $224, rallies are sell opportunities.
* Losing $215.50 risks an accelerated drop to $210 or lower.
* Bears remain in control unless buyers step in aggressively at support.
🚨 Disclaimer:
This analysis is for educational purposes only and does not constitute financial advice. Always do your own research and manage your risk accordingly.
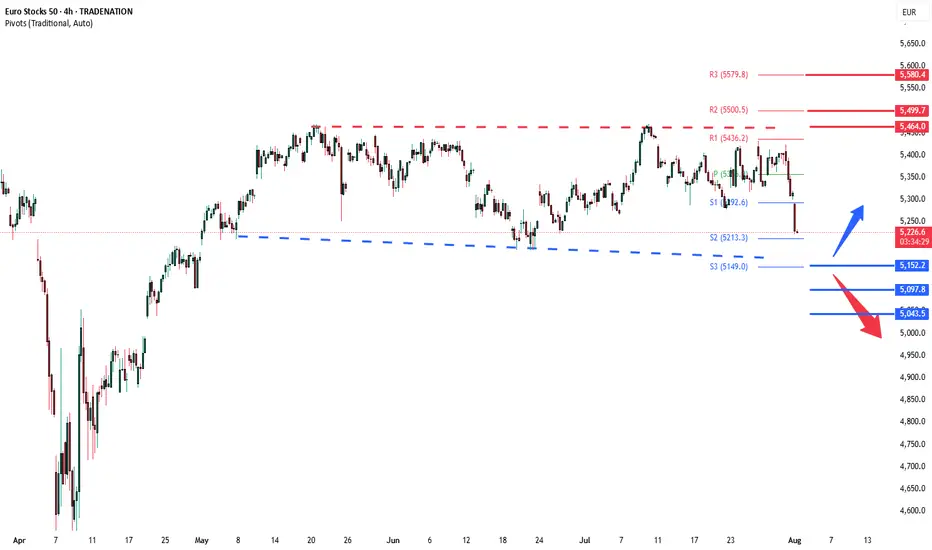
Stoxx sideways consolidation Key Support and Resistance Levels
Resistance Level 1: 5464
Resistance Level 2: 5500
Resistance Level 3: 5580
Support Level 1: 5152
Support Level 2: 5097
Support Level 3: 5044
This communication is for informational purposes only and should not be viewed as any form of recommendation as to a particular course of action or as investment advice. It is not intended as an offer or solicitation for the purchase or sale of any financial instrument or as an official confirmation of any transaction. Opinions, estimates and assumptions expressed herein are made as of the date of this communication and are subject to change without notice. This communication has been prepared based upon information, including market prices, data and other information, believed to be reliable; however, Trade Nation does not warrant its completeness or accuracy. All market prices and market data contained in or attached to this communication are indicative and subject to change without notice.
META’s Monster Gap — Gamma Ceiling. 8/1META’s Monster Gap — Gamma Ceiling at $785 or Room to Run Past $800?
🔍 GEX & Options Flow Insight (1st Image Analysis)
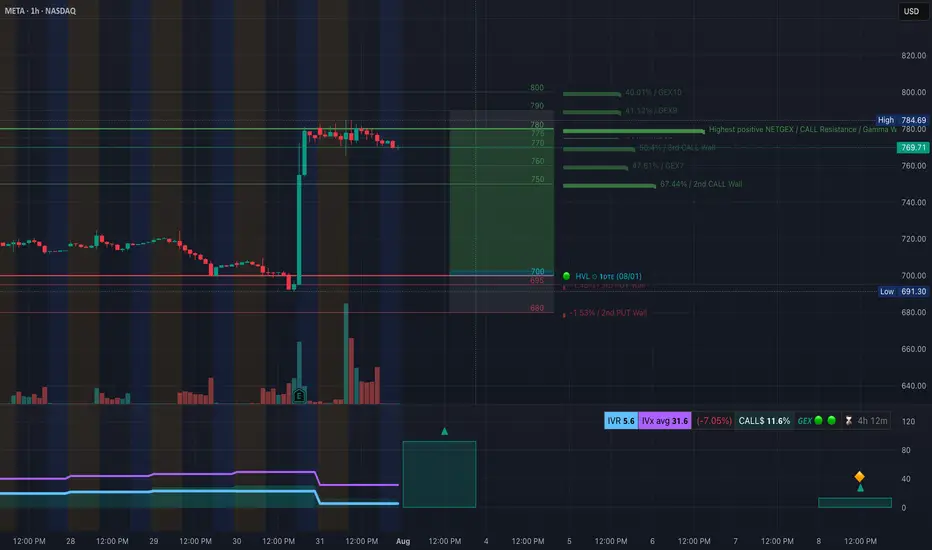
META ripped higher on earnings momentum, gapping from the $690s into the $770s, and is now stalling just under the Gamma Wall / Highest Positive NET GEX at $784.69. Options positioning shows bullish gamma support but overhead resistance could trigger a stall or pullback before another leg up.
* Call Walls & Resistance:
* 📍 $784.69 → Highest positive NET GEX / Gamma Wall
* 📍 $800.00 → GEX10 & GEX9 ceiling = ultimate squeeze target if momentum continues
* Put Support Zones:
* 🛡️ $750.00 → Key 2nd Call Wall zone now acting as gamma support
* 📉 $700.00 / $691.30 → HVL zone + hard put support
* 🚨 Breakdown below $691 opens the door to a deep retracement
* Volatility Insight:
* IVR 5.6, IVx Avg 31.6 → Low IV = cheaper premium for directional plays
* Call flow 11.6% = Not euphoric, but bullish sentiment
* GEX sentiment: 🟢🟢🟢 = Long gamma environment, supportive of dips
✅ Option Trading Suggestion:
Bias: Bullish but extended — watch for consolidation before breakout
Strategy: Debit call spread (protects from IV crush)
* Entry Idea: Buy 780C / Sell 800C for Aug 2 or Aug 9 expiry
* Invalidation: Breakdown under 750 with volume
* Target: 785 → 800 on continuation
Why this works: META is riding strong bullish gamma positioning. As long as it holds above $750, dealer hedging supports price. Break above $785 could trigger short gamma acceleration to $800. But extended after earnings, so controlled size is key.
🧠 Technical Analysis (1H Chart) (2nd Image Analysis)
Market Structure & SMC:
* ✅ BOS + CHoCH sequence with a massive impulsive move from liquidity grab under $700
* 📈 Price is currently in the supply zone (purple box $768–$784) from historical resistance alignment
* 📊 First consolidation post-gap — watching for either breakout or gap-fill attempts
Trendline Dynamics:
* Strong bullish breakout from long consolidation
* Price is riding the upper slope of a sharp post-gap channel
SMC Zones:
* 🟩 Demand / OB Zone: $750–$724 → Ideal dip buy zone if retested
* 🟥 Supply Zone (Purple Box): $768–$784 → Current battle zone
🔄 Price Action & Key Levels
* Support:
* ✅ $750 → Former resistance, now key support
* ✅ $724 → Fib retracement confluence
* 🚨 $700 / $691.30 → HVL & hard gamma put wall
* Resistance:
* 🚩 $784.69 → Gamma Wall + supply top
* 🧨 $800 → Ultimate squeeze ceiling
🧭 Scalping / Intraday Trade Setup
🟩 Bullish Setup:
* Entry: $770–$772 dip reclaim
* Target 1: $784.69
* Target 2: $800 extension
* Stop: Close under $750
🟥 Bearish Pullback Setup:
* Entry: Rejection at $784.69
* Target 1: $760
* Target 2: $750
* Stop: Breakout above $785
🔁 Summary Thoughts
* META just printed a post-earnings breakout that could keep running into $785–$800 if gamma fuel continues.
* First consolidation after the gap is critical — if bulls defend $750, breakout setups remain strong.
* Caution chasing highs; better reward/risk comes from pullback buys into $750–$760.
* Dealers are long gamma, which supports range-bound chop with bullish bias.
🚨 Disclaimer:
This analysis is for educational purposes only and does not constitute financial advice. Always do your own research and manage your risk accordingly.
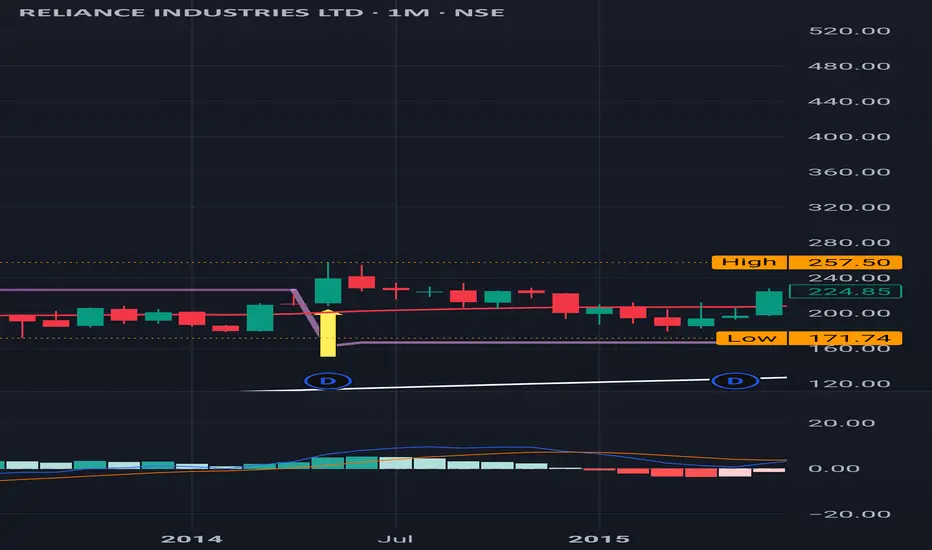
Reliance : A brilliant Journey from May 2014 from 200Reliance : A brilliant Journey from May 2014 from the price level of 200 to until now
It has never been a Sell on a monthly time frame since then.
Even during the Covid time in March 2020 it ditched a Sell signal on a Monthly Time Frame.
It started it's run at around the price level of mere 200 ish in May 2014 and never looked back. Splits / Bonuses/ Dividends / Jio stocks options are all extras apart from the price actions.
It seems this is why it's known as MOTABHAI
( Not a Buy / Sell Recommendation
Do your own due diligence ,Market is subject to risks, This is my own view and for learning only .)
XAU/USD 01 August 2025 Intraday AnalysisH4 Analysis:
-> Swing: Bullish.
-> Internal: Bullish.
You will note that price has targeted weak internal high on three separate occasions which has now formed a triple top, this is a bearish reversal pattern and proving this zone is a strong supply level. This is in-line with HTF bearish pullback phase.
Remainder of analysis and bias remains the same as analysis dated 23 April 2025.
Price has now printed a bearish CHoCH according to my analysis yesterday.
Price is now trading within an established internal range.
Intraday Expectation:
Price to trade down to either discount of internal 50% EQ, or H4 demand zone before targeting weak internal high priced at 3,500.200.
Note:
The Federal Reserve’s sustained dovish stance, coupled with ongoing geopolitical uncertainties, is likely to prolong heightened volatility in the gold market. Given this elevated risk environment, traders should exercise caution and recalibrate risk management strategies to navigate potential price fluctuations effectively.
Additionally, gold pricing remains sensitive to broader macroeconomic developments, including policy decisions under President Trump. Shifts in geopolitical strategy and economic directives could further amplify uncertainty, contributing to market repricing dynamics.
H4 Chart:
M15 Analysis:
-> Swing: Bullish.
-> Internal: Bullish.
H4 Timeframe - Price has failed to target weak internal high, therefore, it would not be unrealistic if price printed a bearish iBOS.
The remainder of my analysis shall remain the same as analysis dated 13 June 2025, apart from target price.
As per my analysis dated 22 May 2025 whereby I mentioned price can be seen to be reacting at discount of 50% EQ on H4 timeframe, therefore, it is a viable alternative that price could potentially print a bullish iBOS on M15 timeframe despite internal structure being bearish.
Price has printed a bullish iBOS followed by a bearish CHoCH, which indicates, but does not confirm, bearish pullback phase initiation. I will however continue to monitor, with respect to depth of pullback.
Intraday Expectation:
Price to continue bearish, react at either M15 supply zone, or discount of 50% internal EQ before targeting weak internal high priced at 3,451.375.
Note:
Gold remains highly volatile amid the Federal Reserve's continued dovish stance, persistent and escalating geopolitical uncertainties. Traders should implement robust risk management strategies and remain vigilant, as price swings may become more pronounced in this elevated volatility environment.
Additionally, President Trump’s recent tariff announcements are expected to further amplify market turbulence, potentially triggering sharp price fluctuations and whipsaws.
M15 Chart:

SPX500 - Bearish Crab Pattern- Price completed a perfect Crab Pattern, yet we all got to August 1st (second) liberation day
- If bad mood continues, we can expect a correction:
A. (positive) down to 6150-6000
B. (negative) down to 5800
Just my humble opinion

FED: An unlikely rate cut in September, unless…The United States Federal Reserve (FED) unveiled this week a new monetary policy decision, maintaining the status quo on interest rates—hence no change in the federal funds rate since December 2024. This did not prevent the S&P 500 from hitting new all-time highs, driven by GAFAM financial results and even the top ten companies by market capitalization, which now represent 40% of the S&P 500 composition. Jerome Powell’s FED has not indicated any timing for the resumption of rate cuts due to high uncertainty over the impact of tariffs on core PCE inflation (the FED’s preferred inflation measure).
1) The probability of a rate cut on Wednesday, September 17 has dropped below 50%
This week was extremely rich in fundamentals: Powell’s FED spoke, GAFAM released their earnings, PCE inflation was updated, trade agreements were signed, and the NFP report will be published this Friday.
After Powell’s FED reaffirmed there is no urgency to resume rate cuts, the implied probability of a rate cut on September 17 fell below 50%.
The consensus scenario—a September cut—is now questioned by new expectations from high finance and the 12 voting FOMC members.
2) Core PCE inflation, the FED’s favorite index, is no longer falling. The FED’s target is near but disinflation is paused just above it
Is Powell justified in maintaining the status quo? Yes, in absolute terms: disinflation has paused due to tariffs. The chart shows the core PCE inflation curve has flattened. The FED’s target is near, but a further decline would be needed to justify rate cuts. Only concern over labor market health could raise the probability above 50%.
3) Tariffs emerging from recent trade agreements with key U.S. partners are likely to keep PCE inflation above the FED’s target (temporarily)
As trade deals are finalized (China remains pending, deadline later in August), we can assess tariff impacts on core PCE. At this stage—with most deals involving tariffs of 15–20%—the impact on core PCE is estimated at 0.3%. This should keep PCE above the FED’s target early in the fall, but only temporarily, with no second inflation wave expected.
DISCLAIMER:
This content is intended for individuals who are familiar with financial markets and instruments and is for information purposes only. The presented idea (including market commentary, market data and observations) is not a work product of any research department of Swissquote or its affiliates. This material is intended to highlight market action and does not constitute investment, legal or tax advice. If you are a retail investor or lack experience in trading complex financial products, it is advisable to seek professional advice from licensed advisor before making any financial decisions.
This content is not intended to manipulate the market or encourage any specific financial behavior.
Swissquote makes no representation or warranty as to the quality, completeness, accuracy, comprehensiveness or non-infringement of such content. The views expressed are those of the consultant and are provided for educational purposes only. Any information provided relating to a product or market should not be construed as recommending an investment strategy or transaction. Past performance is not a guarantee of future results.
Swissquote and its employees and representatives shall in no event be held liable for any damages or losses arising directly or indirectly from decisions made on the basis of this content.
The use of any third-party brands or trademarks is for information only and does not imply endorsement by Swissquote, or that the trademark owner has authorised Swissquote to promote its products or services.
Swissquote is the marketing brand for the activities of Swissquote Bank Ltd (Switzerland) regulated by FINMA, Swissquote Capital Markets Limited regulated by CySEC (Cyprus), Swissquote Bank Europe SA (Luxembourg) regulated by the CSSF, Swissquote Ltd (UK) regulated by the FCA, Swissquote Financial Services (Malta) Ltd regulated by the Malta Financial Services Authority, Swissquote MEA Ltd. (UAE) regulated by the Dubai Financial Services Authority, Swissquote Pte Ltd (Singapore) regulated by the Monetary Authority of Singapore, Swissquote Asia Limited (Hong Kong) licensed by the Hong Kong Securities and Futures Commission (SFC) and Swissquote South Africa (Pty) Ltd supervised by the FSCA.
Products and services of Swissquote are only intended for those permitted to receive them under local law.
All investments carry a degree of risk. The risk of loss in trading or holding financial instruments can be substantial. The value of financial instruments, including but not limited to stocks, bonds, cryptocurrencies, and other assets, can fluctuate both upwards and downwards. There is a significant risk of financial loss when buying, selling, holding, staking, or investing in these instruments. SQBE makes no recommendations regarding any specific investment, transaction, or the use of any particular investment strategy.
CFDs are complex instruments and come with a high risk of losing money rapidly due to leverage. The vast majority of retail client accounts suffer capital losses when trading in CFDs. You should consider whether you understand how CFDs work and whether you can afford to take the high risk of losing your money.
Digital Assets are unregulated in most countries and consumer protection rules may not apply. As highly volatile speculative investments, Digital Assets are not suitable for investors without a high-risk tolerance. Make sure you understand each Digital Asset before you trade.
Cryptocurrencies are not considered legal tender in some jurisdictions and are subject to regulatory uncertainties.
The use of Internet-based systems can involve high risks, including, but not limited to, fraud, cyber-attacks, network and communication failures, as well as identity theft and phishing attacks related to crypto-assets.

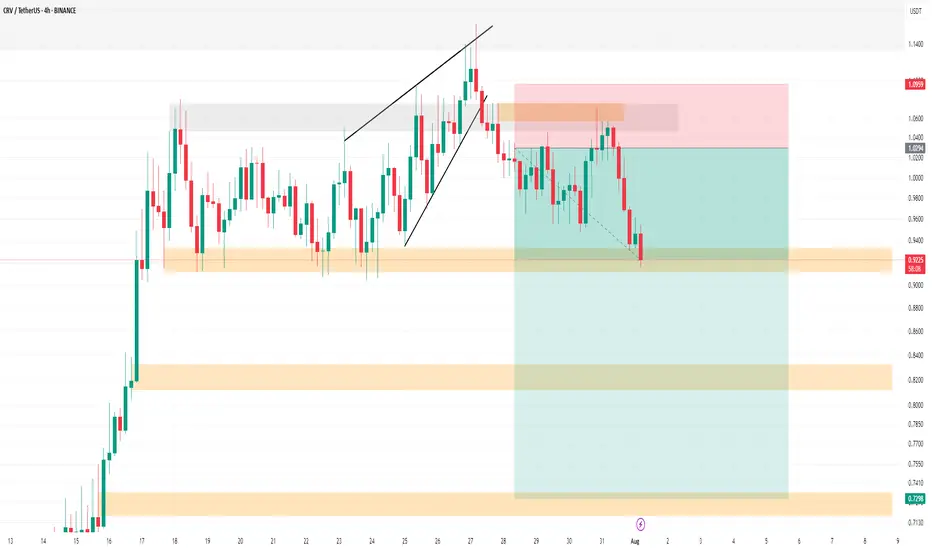
CRV SHORT Update Hello.
CRV Update
💁♂️ TP1 🔥
You can see this analysis in the analyses I posted before. It has now reached its first target. Please don't forget to like, share, and boost so that I can analyze it for you with more enthusiasm. Thank you. 💖😍
✅ TP1: 0.93$ Accessible (done)🔥
TP2: 0.82$ Possible
TP3: 0.73$ Possible
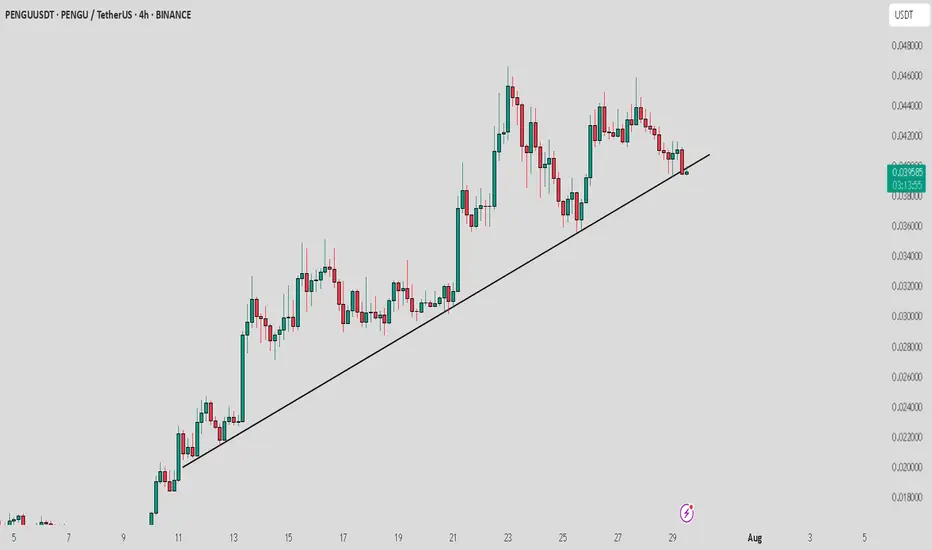
PENGU / USDT : Breaking down from Trendline supportPENGU/USDT is breaking down from the trend line support, but the retest is still in progress. Watch for rejection at key levels.
Pro Tip: Wait for confirmation of rejection before entering the trade and always apply proper risk management to safeguard your position.
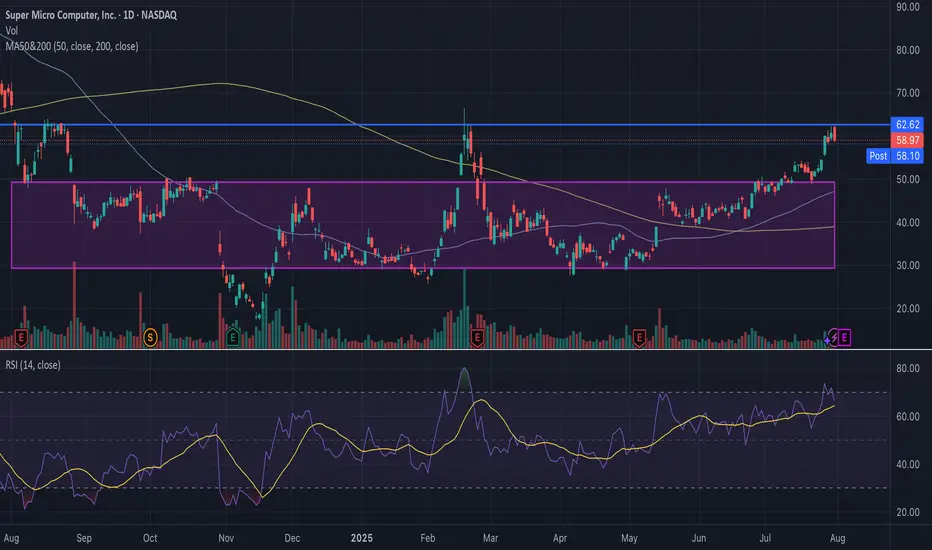
SMCI Short-Term Put PositionSMCI is currently struggling to break past a key historical trend line around $62–$63, a level that acted as resistance multiple times over the past year. The stock briefly broke above $60, but failed to hold the breakout, signaling potential exhaustion. Price is approaching overbought territory with RSI nearing 70. This move is also extended from both the 50-day (blue) and 200-day (yellow) moving averages. Additionally, volume was not exceedingly high during the breakout. I have strong conviction that it will drop to ~50. SMCI spent nearly 9 months trading between ~$33 and ~$50, as shown in the purple consolidation box. If this breakout fails, $50 becomes a natural target, as its the resistance line in the consolidation box where SMCI has been trading at for 9 months. A close below $58 (today’s low) would confirm rejection and likely accelerate selling. A put position could be highly profitable.
GBPJPY pullback for another bullish moveDaily candle closed with strong bullish.
A healthy pullback observed during Asian session.
I'm waiting at marking area for buy entry.
Calculate your own risk & reward.
Good Luck

Lingrid | TONUSDT Potential Long From the KEY ZoneThe price perfectly fulfilled my last idea . OKX:TONUSDT is pulling back from a fake breakout above 3.590 but holding within the boundaries of an upward channel. The price is approaching strong confluence support near 3.250, where both the trendline and horizontal zone align. A rebound from this level could launch a new bullish leg toward the resistance zone. Buyers will look for confirmation at the bounce area to aim for 3.590 and beyond.
📌 Key Levels
Buy zone: 3.250 – 3.300
Sell trigger: Break below 3.250
Target: 3.590 – 3.700
Buy trigger: Bullish engulfing or breakout from local consolidation near 3.300
💡 Risks
Loss of support at 3.250 trendline
Bearish pressure from broader market sentiment
Another fakeout or choppy move around 3.300–3.400 zone
If this idea resonates with you or you have your own opinion, traders, hit the comments. I’m excited to read your thoughts!

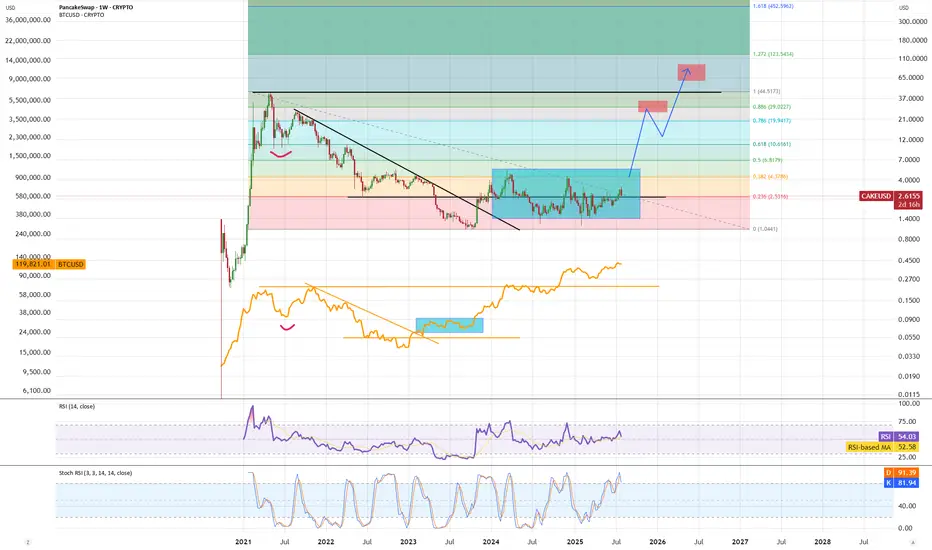
CAKE - positive signs for move upCAKE is still in accumulation range. When looking at pattern we see similarities with BTC where CAKE has completed 1st impulse from the bottom and as long as we stay above fibb 0.236 S range we are ready for next impulse moving price higher, going for test of fibb 0.886 range where a bit of consolidation and then wick to new ATH to complete bigger impulse up.
BITCOIN SENDS CLEAR BULLISH SIGNALS|LONG
BITCOIN SIGNAL
Trade Direction: long
Entry Level: 114,912.19
Target Level: 117,003.95
Stop Loss: 113,517.68
RISK PROFILE
Risk level: medium
Suggested risk: 1%
Timeframe: 2h
Disclosure: I am part of Trade Nation's Influencer program and receive a monthly fee for using their TradingView charts in my analysis.
✅LIKE AND COMMENT MY IDEAS✅

S&P500 for the rest of 2026I am not a professional and this is based on nothing more than blind speculation and feelings.
Probably wrong

AMZN - LONG Swing Entry PlanNASDAQ:AMZN - LONG Swing Entry Plan
Entry Zone 1: $220.00 – $217.00
→ Open initial position targeting +8% from entry level.
Entry Zone 2: $212.00 – $209.00
→ If price dips further, average down with a second equal-sized entry.
→ New target becomes +8% from the average of Entry 1 and Entry 2.
Edit Zone : $192.00 – $190.00
→ If reached, enter with double the initial size to lower the overall cost basis.
→ Profit target remains +8% from the new average across all three entries.
Risk Management:
Stop Loss:
Risk is capped at 12% below the average entry price (calculated across all executed positions including the Edit Zone).
Position Sizing Approach:
Entry 1: 1x
Entry 2: 1x
Edit Zone: 2x
→ Total exposure: 4x
→ Weighted average determines final TP and SL calculations.
______________________________________
Legal Disclaimer
The information provided in this content is intended for educational and informational purposes only and does not constitute financial, investment, or legal advice or recommendations of any kind. The provider of this content assumes no legal or financial responsibility for any investment decisions made based on this information. Users are strongly advised to conduct their own due diligence and consult with licensed financial advisors before making any financial or investment decisions.
Sharia Compliance Disclaimer: The provider makes no guarantees that the stocks or financial instruments mentioned herein comply with Islamic (Sharia) principles. It is the user’s responsibility to verify Sharia compliance, and consultation with a qualified Sharia advisor is strongly recommended before making any investment decisions

#DOGE Update #3 – July 29, 2025#DOGE Update #3 – July 29, 2025
I’m still holding my Doge position and haven’t been stopped out. I plan to lower my average cost by adding to the position at potential reversal zones. This is how I intend to proceed. My entry level is currently $0.2583, and my target is $0.2986, which means I’m aiming for roughly a 15% profit.
At the moment, the price has pulled back about 11% from that level. There’s nothing to worry about—it’s perfectly normal. Doge is continuing its movement by taking support from the bottom of an upward trend. I’m still in the position and planning to exit with profit without setting a stop.

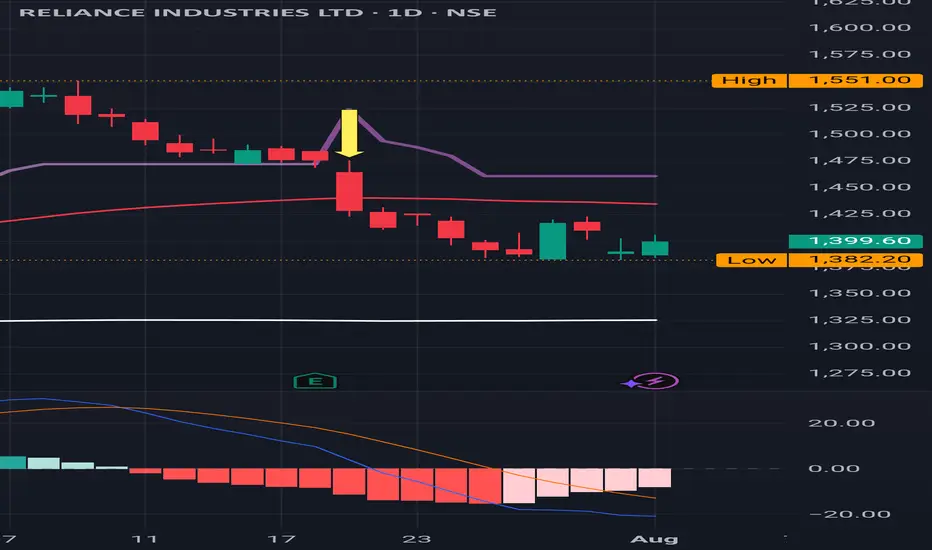
REL : Sitting at an important support level of 1400 ish.
REL : Sitting at an important support level of 1400 ish.
( Not a Buy / Sell Recommendation
Do your own due diligence ,Market is subject to risks, This is my own view and for learning only .)
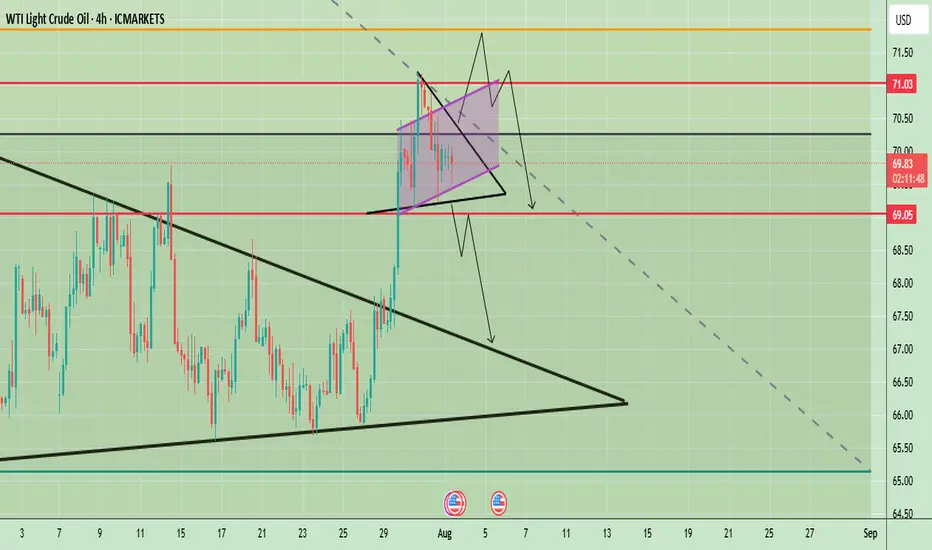
WTI Crude Oil Technical Outlook – Key Breakout or BreakdownWTI Crude Oil 4-hour chart suggests a potential inflection point after a strong bullish breakout from a larger symmetrical triangle pattern in late July. The price surged past key resistance levels and is now consolidating in a smaller symmetrical triangle formation just below the psychological $70 mark. This indicates a phase of indecision following a strong move, with market participants awaiting further confirmation.
Price is currently hovering around $69.82, with key levels marked at $71.03 (resistance) and $69.05 (support). The short-term price action within the tight triangle could determine the next move, with both bullish continuation and bearish reversal scenarios on the table.
Prices remain supported by supply concerns after Trump threatened to impose 100% secondary tariffs on buyers of Russian crude and warned China, a major oil consumer of severe penalties if it continues its purchases of Russian oil.
🔍 Potential Scenarios
- Bullish Breakout Scenario
If price breaks out of the smaller symmetrical triangle to the upside and clears the $70 resistance level with strong momentum, it may quickly test the $71.03 zone. A clean break above $71.03 would confirm the continuation of the previous uptrend, potentially opening room toward $72.50 and beyond in the medium term. The pattern would resemble a bullish pennant — a continuation pattern following the late July rally.
-Bearish Rejection and Breakdown
Conversely, a failure to sustain above $70 followed by a break below the lower boundary of the smaller triangle could lead to a sharper decline. The first critical level to watch would be $69.05; a break below this would likely invalidate the bullish setup and initiate a retest of the previously broken upper trendline of the larger triangle near $67.50. A further breakdown could lead price towards the larger support zone around $65–$66.
📈 Trend Outlook
- Short-Term: Neutral to Bullish — Consolidation in a smaller symmetrical triangle suggests a pause before continuation. However, the structure is still technically bullish unless $69.05 is broken.
- Medium-Term: Bullish Bias — The breakout from the large symmetrical triangle in late July indicates a shift in market sentiment, favoring higher prices unless the price fails to hold above $67.50.
- Long-Term: Cautiously Bullish — As long as WTI holds above the $65–$66 structural support area, the longer-term outlook remains constructive.
Note
Please risk management in trading is a Key so use your money accordingly. If you like the idea then please like and boost. Thank you and Good Luck!
BTCUSD long my predict up to 128100
long possible entry 115150
take profit 128100
stop loss 113000
swing long

USOIL WTIWest Texas Intermediate (WTI) oil is a major benchmark for crude oil pricing, known for its high quality—being both light and sweet due to its low sulfur content and low density. WTI is sourced primarily from inland Texas and is the underlying commodity for oil futures traded on the New York Mercantile Exchange (NYMEX). The main physical delivery point is Cushing, Oklahoma, a critical U.S. oil storage and trading hub.
Current Price (as of August 1, 2025)
WTI crude oil is trading around $69.15–$69.36 per barrel.
Recently, WTI prices have seen volatility due to global economic factors, including U.S. tariffs, OPEC+ production, and shifts in oil demand. Despite a small decline on the day, oil prices have posted their strongest weekly performance since June, rising over 6% for the week.
Market and Outlook
Recent price movement reflects concerns about global trade tensions, new tariffs, and their impact on economic growth and energy demand. At the same time, supply risks remain due to geopolitical factors such as potential sanctions on Russian oil and U.S.-China trade developments.
Analyst forecasts for the remainder of 2025 suggest continued volatility, with WTI potentially ranging between $56 and $73 per barrel, influenced by demand, OPEC+ decisions, and geopolitical events.
Quick Facts Table
Feature Detail
Type Light, sweet crude
Benchmark NYMEX (U.S.), major global reference
Main Delivery Point Cushing, Oklahoma
Latest Price (Aug 1, 2025) $69.15–$69.36 per barrel
Typical Drivers U.S. tariffs, OPEC+ decisions, trade policy, supply risks, global demand
WTI oil plays a central role in global energy markets, serving as a benchmark for North American and international oil pricing. Its price reflects both supply fundamentals and broader macroeconomic and geopolitical developments.
#OIL #WTI
