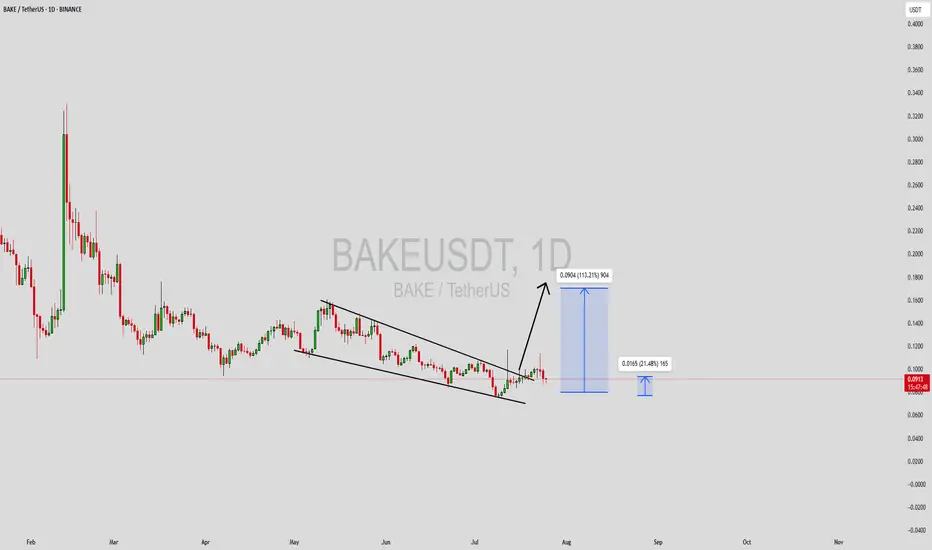
BAKEUSDT Forming Falling WedgeBAKEUSDT is presenting an interesting breakout scenario after forming a clean falling wedge pattern on the daily chart. Falling wedges are typically bullish reversal patterns, especially when confirmed by a breakout with volume. In this case, the wedge appears to be breaking to the upside, supported by a noticeable uptick in buying volume. Technical projections are pointing toward a potential price increase of 90% to 100%+, making this setup a valuable opportunity for swing traders and momentum investors.
BAKE (BakeryToken) remains an integral part of the DeFi and NFT landscape, particularly within the Binance Smart Chain ecosystem. Its utility, paired with renewed market attention and increased community engagement, could act as a fundamental driver behind this projected upward move. With the crypto market gradually rotating back into altcoins, BAKE could benefit from speculative capital flowing into undervalued DeFi assets.
Traders should keep a close watch on key resistance breakouts and continuation volume patterns. A confirmed daily candle close above the wedge resistance would further validate the bullish breakout thesis. Additionally, historical price action shows that BAKE has the potential to move sharply once momentum kicks in, offering a favorable risk-to-reward setup.
Overall, the technicals align well with rising investor sentiment. If the broader crypto environment stays supportive, BAKEUSDT could see a strong recovery rally in the short to mid term.
✅ Show your support by hitting the like button and
✅ Leaving a comment below! (What is You opinion about this Coin)
Your feedback and engagement keep me inspired to share more insightful market analysis with you!
Community ideas
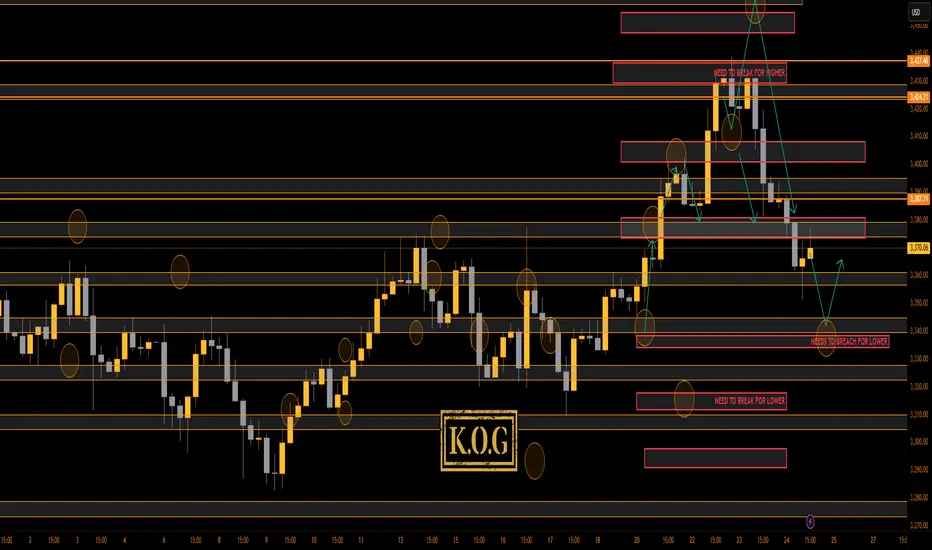
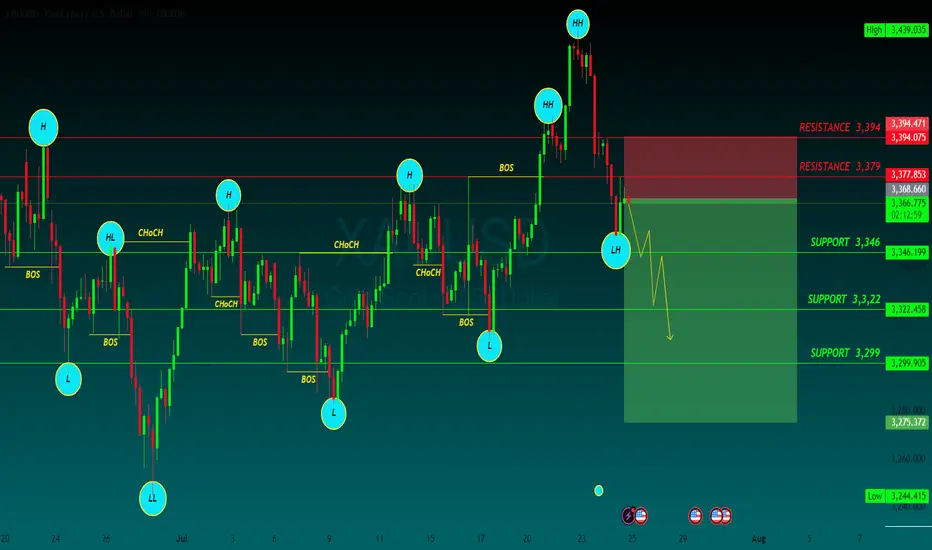
THE KOG REPORT - UpdateEnd of day update from us here at KOG:
Not bad play at all with the red boxes working well, KOG's bias of the day and the red box targets working well and of course the indicators and our trusted algo Excalibur guiding the way completing the move that we wanted downside. We then got a fantastic long from the bias level and red box activation up into where we are now.
So, what now?
We have resistance and a red box above which is broken suggesting we may see some more movement downside in the coming sessions. This would also align with the hunt and undercut low that can take place at this key level. We're a bit too low to short, so we'll either look for the break above 3375 to go higher, or, we'll wait lower for a potential long trade from the red box region.
Immediate support here is 3360-5 and resistance 3375.
Price: 3364
KOG’s Bias of the day:
Bullish above 3350 with targets above 3358✅, 3365✅ and above that 3379✅
Bearish on break of 3350 with target below 3337 and below that 3330
RED BOXES:
Break above 3365 for 3372✅, 3375✅, 3388 and 3406 in extension of the move
Break below 3350 for 3335, 3330, 3326 and 3307 in extension of the move
As always, trade safe.
KOG

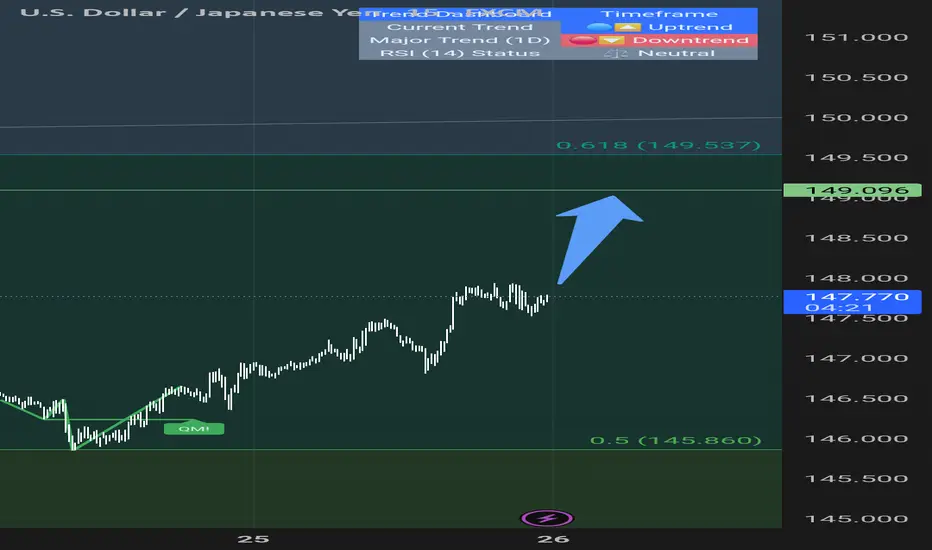
USDJPY Under Pressure! SELL!
My dear subscribers,
My technical analysis for USDJPY is below:
The price is coiling around a solid key level - 147.83
Bias - Bearish
Technical Indicators: Pivot Points High anticipates a potential price reversal.
Super trend shows a clear sell, giving a perfect indicators' convergence.
Goal - 147.34
My Stop Loss - 148.12
About Used Indicators:
By the very nature of the supertrend indicator, it offers firm support and resistance levels for traders to enter and exit trades. Additionally, it also provides signals for setting stop losses
Disclosure: I am part of Trade Nation's Influencer program and receive a monthly fee for using their TradingView charts in my analysis.
———————————
WISH YOU ALL LUCK

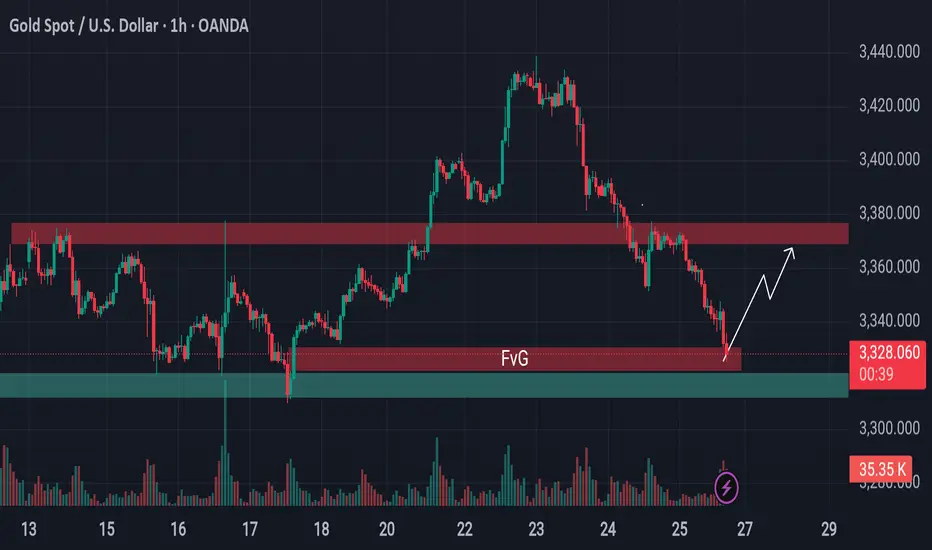
From Breakdown to Breakout? Gold Eyes Support Based Reversal!Gold is approaching a critical support area.
Previously, the price was holding above a key support level, but that zone has now been breached and is likely to act as resistance going forward. However, just beneath the current price, there's a well-established support level still intact—reinforced further by the presence of a bullish Fair Value Gap (FVG).
This setup hints at a possible reversal or a short-term surge from this zone. If market conditions align, gold may stage a pump from here. Keep this level on your radar—it could turn into a decisive point for price direction.
🛡 Always conduct your own analysis before taking any trades. DYOR.
XAUUSD clean to dropXAUSD CLEAN TO DROP for the next 3 weeks
I will bee waiting for this set up and now all that we need is patience

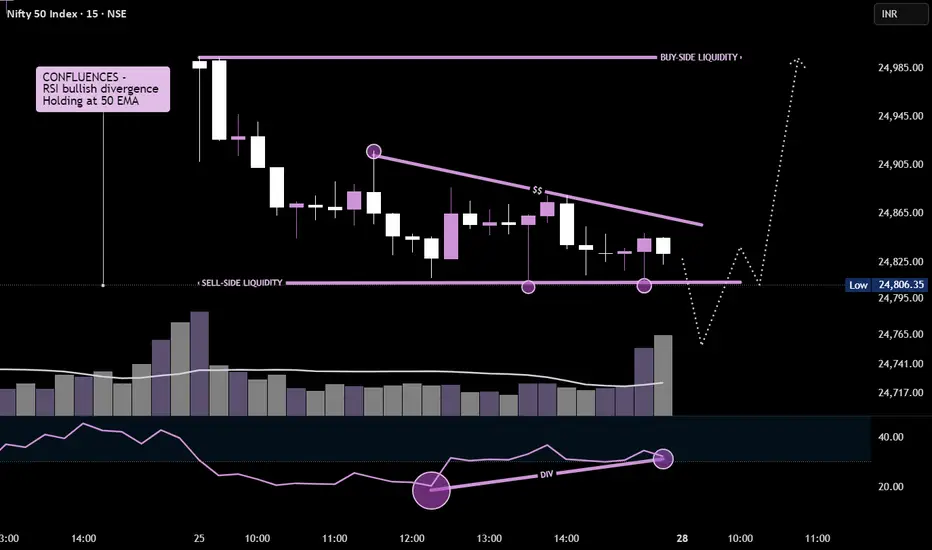
NIFTY50 - 15MIN Potential reversal brewingPrice is forming a falling wedge pattern with clear bullish RSI divergence, signaling potential reversal.
XAUUSDLongterm gold os going to 5K
Midterm 3,500
Shorterm, we going to the bottom of the consolidation.

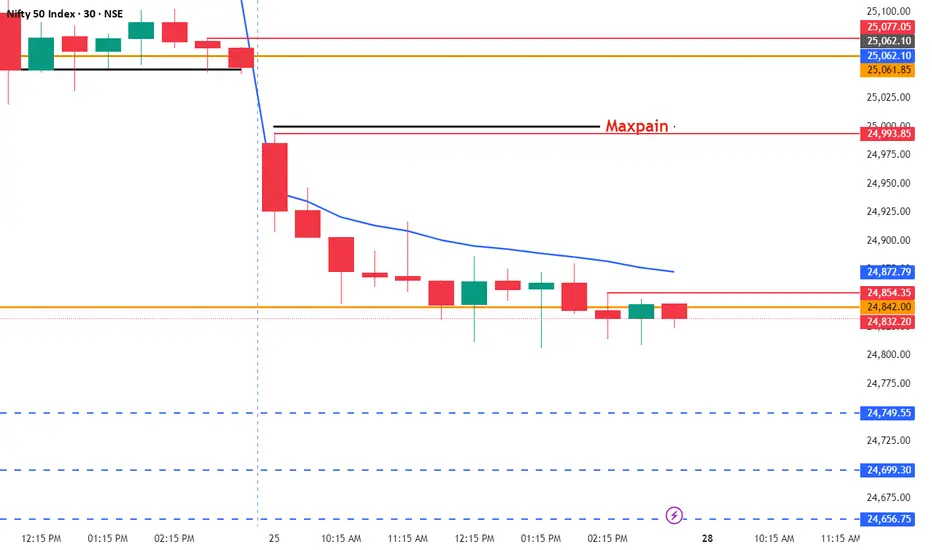
Monday Gap down ProbabilityAs market sentiments are negative where smallcap and midcap tumbles possible gap down after weekend , positive bias after breaking 25062 level till then market showing bearish movement
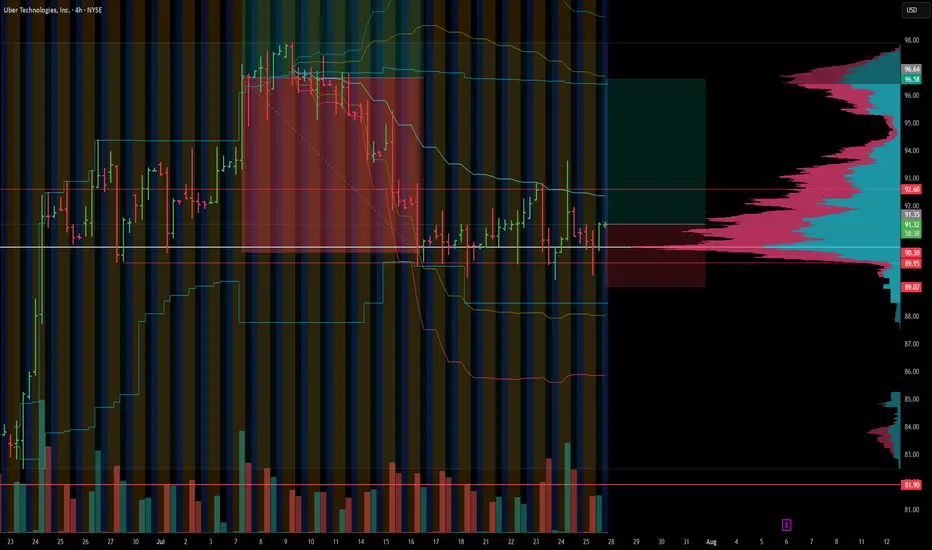
Repeating UBER longUBER has found the support at 91 level and will likely retest initial supply area.
GOLD SELLGold price bears retain control amid fading safe-haven demand, rebounding USD
US President Donald Trump announced late Tuesday that his administration had reached a trade deal with Japan. Furthermore, reports that the US and the European Union are heading towards a 15% trade deal boost investors' confidence and weigh on the safe-haven Gold price for the second straight day on Thursday.
The markets do not expect an interest rate cut from the US Federal Reserve in July despite Trump's continuous push for lower borrowing costs. In fact, Trump has been attacking Fed Chair Jerome Powell personally over his stance on holding rates and repeatedly calling for the central bank chief's resignation.
Moreover, Fed Governor Chris Waller and Trump appointee Vice Chair for Supervision Michelle Bowman have advocated a rate reduction as soon as the next policy meeting on July 30. This keeps the US Dollar depressed near a two-and-a-half-week low and could offer some support to the non-yielding yellow metal.
Traders now look forward to the release of flash PMIs, which would provide a fresh insight into the global economic health and influence the safe-haven commodity. Apart from this, the crucial European Central Bank policy decision might infuse some volatility in the markets and drive the XAU/USD pair.
Meanwhile, the US economic docket features Weekly Initial Jobless Claims and New Home Sales data, which, in turn, would drive the USD and contribute to producing short-term trading opportunities around the commodity. Nevertheless, the fundamental backdrop warrants caution for aggressive traders.
SUPPORT 3,346
SUPPORT 3,322
SUPPORT 3,399
RESISTANCE 3,394
RESISTANCE 3,379
Trendline BreakThe price has broken a bullish trendline followed by a pullback and now the price looks to go short
WE ONLY TRADE PULLBACKS

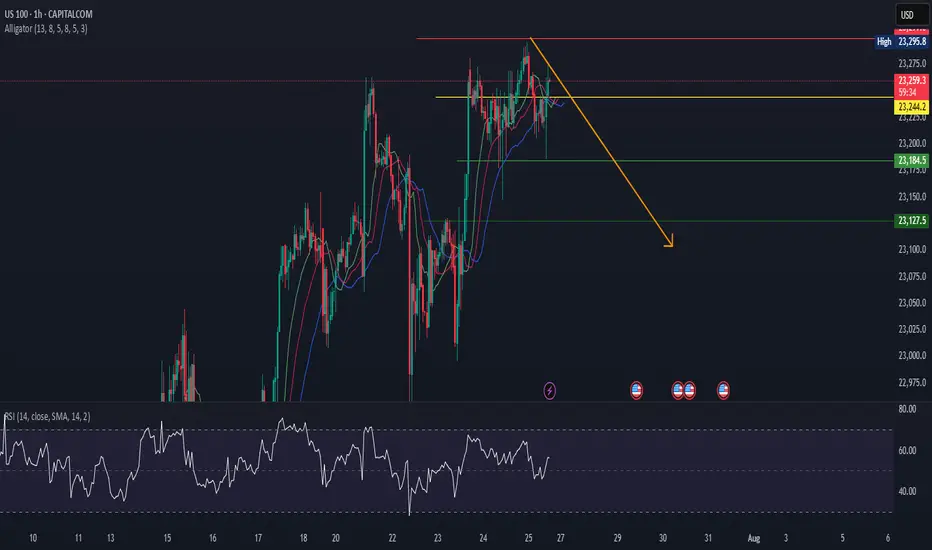
US100Us100 is in reversal MOde.
Big bearish divergence also shown in RSI.
Alligator alos indicates trend will go down from here.
we sell at CMP>
SPX chit chat... we're still up for nowAfter that crazy April 2025 crash, it feels like we should not be this high so fast... that's how I felt before too. But the rising channel is holding up right now. We are approaching the top. In previous times, the market grinded even higher (COVID pandemic was the last example).
Today we squeezed out new ATHs. The month ends next week and a new one begins. Less fear; more charts for the rest of the year.
See you in August!

S&P 500 Index Wave Analysis – 25 July 2025
- S&P 500 Index broke key resistance level 6300.00
- Likely to rise to resistance level 6500.00
S&P 500 Index recently broke the key resistance level 6300.00 (which stopped the previous waves 5 and (B), as can be seen below).
The breakout of the resistance level 6300.00 continues the active intermediate impulse wave (5) from the middle of this month.
Given the strong daily uptrend, S&P 500 Index can be expected to rise to the next resistance level 6500.00 (coinciding with the daily up channel from May).

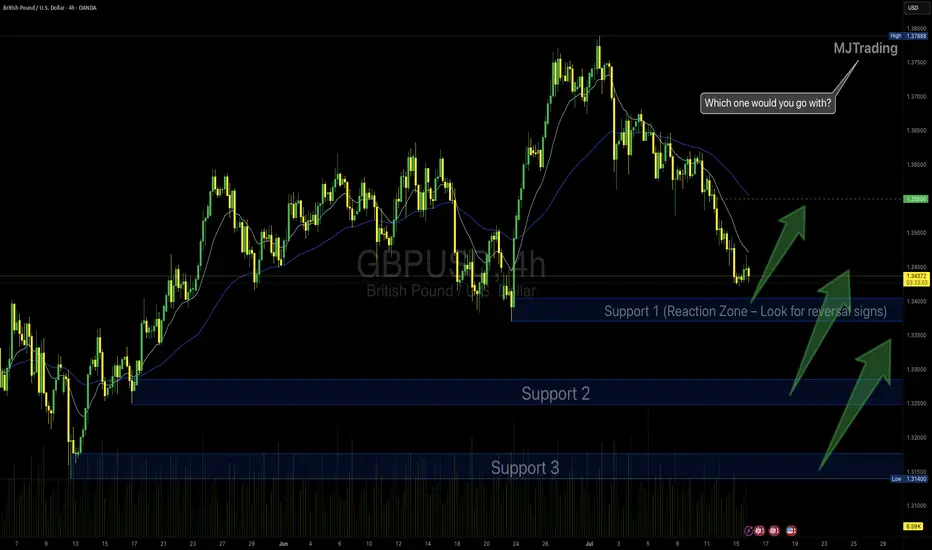
GBPUSD Idea – Demand Zones & Potential Reversal Play🧠 MJTrading:
After a steady downtrend, GBPUSD is now approaching a strong 4H demand zone (Support 1), where we previously saw explosive bullish reactions.
Price is also extended from both EMAs, showing potential for a technical pullback or full reversal.
💡Scenarios to consider:
🔹 If Support 1 holds → we may see a bounce toward 1.3500+
🔹 If broken → Support 2 & 3 offer deeper liquidity and high-probability demand zones
👀 Watch for:
Bullish reversal candles (engulfing / hammer)
Bullish divergence on lower timeframes
Volume spikes on reaction
⚠️ Invalidation:
If Support 3 breaks with strong momentum, we might enter a bearish continuation phase.
#GBPUSD #Forex #ChartDesigner #SmartMoney #PriceAction #MJTrading #ForexSetup #TrendReversal #SupportZones
ANET new positionStarted a feeler position in ANET today with 110 shares. Sold a low delta covered call and added a CSP on the monthly a bit lower. I believe this will be the range of interest here. I wanted to slowly diversify a bit away from small caps as I have made a lot on the risk account the last two years. Arista is heavily positioned to benefit from energy, cloud, and Ai expansion and it has some of the best growth financials I have ever seen.
My plan:
Repeat covered calls at a lower delta to capture share appreciation.
Buy 100 more shares if it gets closer to 100 and continue to sell CSP

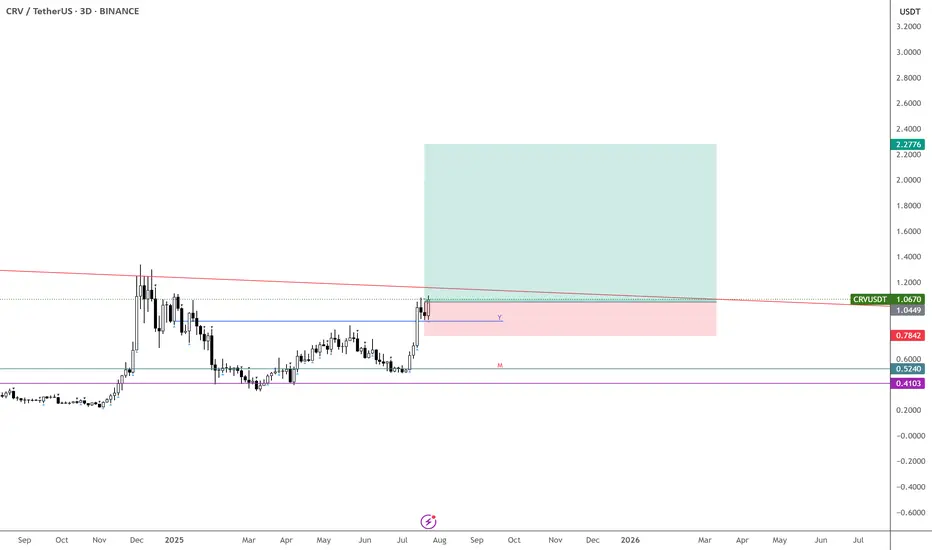
CVR – Ready to Run, Monthly Confirmation In
Tons of strength showing on $CVRUSDT—expecting continuation from here and even more once the trendline breaks.
The monthly candle is confirming the move, pointing to a potential 6-month uptrend. Looks like this one is finally ready for the run we’ve been waiting for.
Buying here and stacking more around 90c if given the chance.
First target: above $2.
BINANCE:ENAUSDT may have gotten away—but this one won’t.
EURUSDPossible sell opportunity. Waiting for price to make a retest + bearish confirmation on the smaller time frame before we go short.
@musehanezwothe

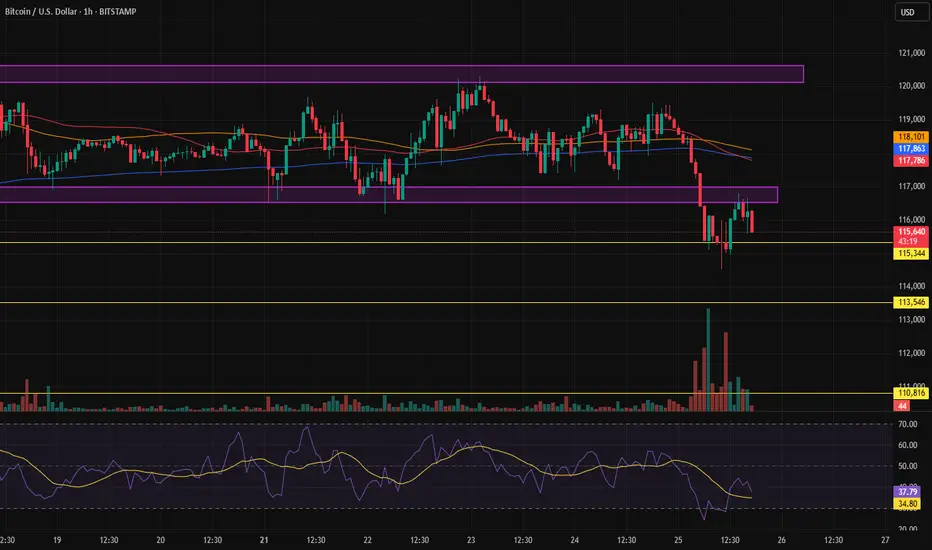
The sell trigger for Bitcoin is being activated.After breaking out of the channel and pulling back to the lower boundary (previous support) of the channel, we expect the price to decline.
Cardano (ADA) Just Flipped Bullish — Next Stop: $0.9373?ADAUSDT is currently displaying a strong bullish structure on the 4-hour chart, bouncing from a critical support zone near $0.7774–$0.7315. After a healthy retracement, the pair appears to be regaining momentum, forming a potential higher low, which aligns with the continuation of the broader uptrend that started earlier this month.
Recent price action confirms that buyers are stepping in at key zones previously marked by blue “B” labels, and sell-side pressure seems to be weakening after the last swing top around $0.9373. The support zones, marked with dotted green lines, have held well, and the current structure suggests a rebound toward the previous high.
The most recent small leg up shows the formation of a bullish engulfing setup near $0.78, which could serve as a launch point toward the higher resistance. The candlesticks are also showing longer lower wicks — a sign that buyers are defending lower levels aggressively. With price currently floating near $0.81, there’s a good upside window available.
Here’s the trading setup based on the chart:
• Entry: Around $0.8106 (current price zone)
• Take Profit (TP): $0.9373 (previous swing high — +18.23%)
• Stop Loss (SL): $0.7315 (invalidates higher low structure — -7.73%)
• Risk-Reward Ratio: 2.36R (favorable for swing positioning)
If ADA can reclaim the $0.85 zone with strong candle closures, it would signal bullish continuation. Momentum indicators like RSI or MACD (not shown) would likely confirm the shift, especially if divergence was forming on recent dips.
Until ADA breaks below $0.7315, the bullish bias remains intact. The formation of higher lows and increasing buying interest at dynamic supports adds weight to the long setup. Price reclaiming the $0.85 zone may trigger a fast rally to $0.93, and possibly beyond if market-wide sentiment remains risk-on.

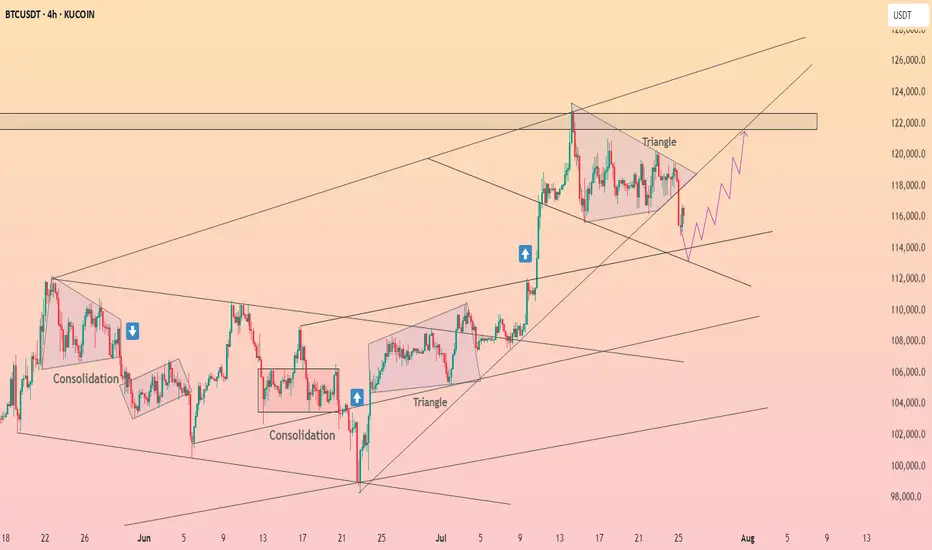
Bitcoin is correcting ┆ HolderStatBINANCE:BTCUSDT compresses inside a triangle between $132K and $137K. Breakout above $137K could initiate a run toward $143K. Breakdown exposes $132K. Watch for decisive move.