Unprecedented VOL suppression will lead to VIX October explosionAccording to my discussions with ChatGPT and analyzing various metrics we are currently in one of the longest periods, if not *the longest* period, of Vol suppression in the entire history of volatility.
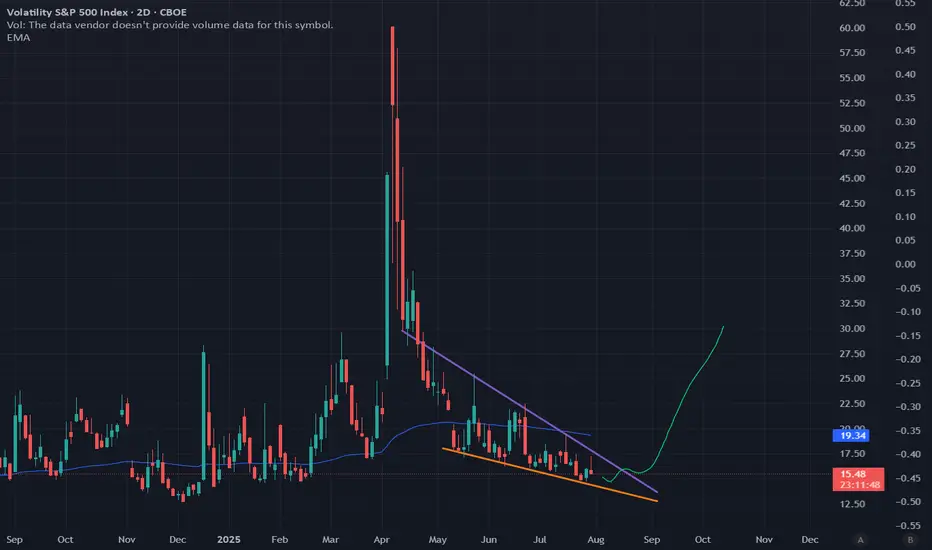
Zooming out and looking at the current chart pattern VIX is very clearly in a falling wedge, which means its falling days are numbered.
Once you see a daily close breach of the upper boundary of the upper wedge channel, I would consider buying some VIX 30 calls for Oct 22 expiration.
Once VIX pierces 25, take profit and close the option.
Good luck and happy trading!
Community ideas

MSFT Earnings Play (2025-07-31) — STRONG BULLISH SETUP
**🚨 MSFT Earnings Play (2025-07-31) — STRONG BULLISH SETUP 🚨**
**Microsoft \ NASDAQ:MSFT Pre-Earnings Trade Idea — 545C (Aug 1)**
---
### 🧠 **Earnings Thesis (🔥 80% Conviction)**
MSFT is set to report **BMO July 31**, and all signs point *bullish*:
📈 **Revenue Growth**: +13.3% YoY, driven by **AI + Cloud** momentum
💰 **Margins**: Profit 35.8%, Op 45.7%, Gross 69.1% — textbook pricing power
📊 **Guidance**: 100% beat history, avg. +5.8% surprise
📌 **Analyst Consensus**: 💪 Strong Buy | Target: \$549.90
📊 **Sector Tailwinds**: Tech favored in current macro with Fed on hold
➡️ **Score: 9/10 Fundamentals | Bullish Momentum Across the Board**
---
### 🔍 **Options Flow & Technicals**
🔥 **Implied Move**: \~6.3% by Aug 1
📉 **IV Rank**: 0.75 (Room to expand post-earnings)
💸 **Call Flow**: Strong OI in 540–550 zone, gamma buildup may fuel squeeze
📊 **RSI**: 70.14 → Bullish, close to overbought
📈 **Support**: \$505 | **Resistance**: \$518.29
➡️ **Score: 8/10 Options | 8/10 Technicals**
---
### 🧨 Trade Setup: 545 CALL (Aug 1 Exp)
🎯 **Entry Price**: \$0.90
📅 **Expiry**: 2025-08-01
📈 **Profit Target**: \$1.80 (⚡️+100%)
🛑 **Stop Loss**: \$0.45
📐 **Size**: 2 contracts (2% portfolio risk)
💡 **Timing**: Enter **EOD July 30 (Pre-earnings)**
⚠️ **IV Crush Alert** → Exit within 2 hours *post-earnings*
---
### ✅ RISK PLAN
* Position: Max 2–3% of portfolio
* IV crush & gap protection: Tight stop and quick post-earnings exit
* Exit Plan: \$1.80 or Stop \$0.45, OR close manually after earnings move
---
📊 **Trade JSON Snapshot**
```json
{
"ticker": "MSFT",
"direction": "CALL",
"strike": 545,
"entry": 0.90,
"target": 1.80,
"stop": 0.45,
"expiry": "2025-08-01",
"entry_time": "EOD Jul 30",
"earnings_date": "2025-07-31 BMO",
"confidence": "80%",
"expected_move": "6.3%",
"iv_rank": "0.75"
}
```
---
🧠 **Summary**
MSFT is poised for a **clean earnings beat** with bullish fundamentals, strong options flow, and upside momentum. This is a **high-conviction, short-dated trade** with defined risk.
🎯 **Watchlist it. Size smart. Exit fast.**

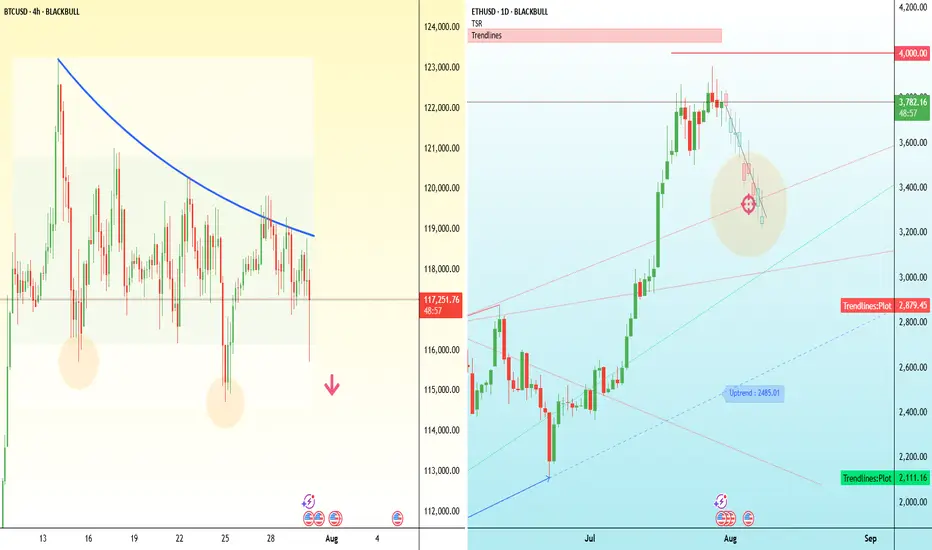
Major test for crypto bulls - BTC and ETH Bitcoin has dipped below $118,000, putting pressure on the bullish structure that’s held for the past two weeks.
The attempted breakout above $121,000 has failed, and price is now breaking down through the middle of the consolidation range, threatening short-term higher lows. On the 4H chart, this move resembles a failed breakout with a potential double-top near $121,000.
If Bitcoin can’t reclaim $116,000 quickly, the next downside levels to watch are $114,000 and $110,000.
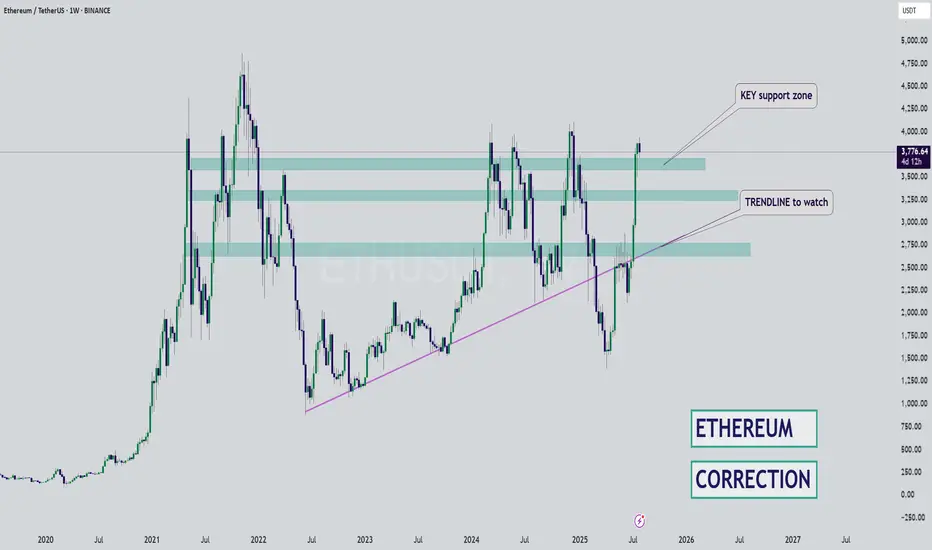
Ethereum, meanwhile, has stalled just below $3,800 after a strong rally this month. Price action has flattened out over the past few days, with several failed attempts to push through that level. The key upside trigger remains $4,000.
But if $3,700 gives way, ETH may slide back to the $3,450–$3,300 region, where previous resistance and the rising trendline converge.
ETHUSD: Bearish Divergence + Double TopHi everyone!
Ethereum – Double Top with Bearish Divergence
On the 4H chart, ETH is forming a clear double top while MACD prints a strong bearish divergence, signaling momentum loss.
📉 Neckline: $3,500 – this level acts as the key trigger.
🔻 Target: $3,000 – aligns with the 0.618 Fibonacci retracement and previous demand zone.
A confirmed break below $3,500 would validate the pattern and open the way to a deeper correction into the $3,000 area. As long as price stays under the second top, the bearish setup remains active.

XAUUSD – Bearish Outlook Ahead of FOMCGold is currently under bearish pressure as markets await the highly anticipated FOMC meeting, scheduled to begin in less than an hour. Investors are closely watching the Fed's interest rate decision and the release of the meeting minutes, which could trigger sharp volatility across the forex and commodities markets.
Technical Outlook:
From a technical perspective, the price action suggests a potential continuation of the bearish trend. If the FOMC event leads to a stronger U.S. dollar or a hawkish tone from the Fed, gold prices may decline further.
Resistance Zone; 3315 / 3330
Support Levels: 3282 / 3260
You May find more details in the Chart.
Trade wisely Best Of Luck Buddies.
Ps: Support with like and comments for better insights Thanks for understand.

EURGBPMajor Break of Structure (BoS) confirmed on the daily, with a clear rejection from recent highs. Price has aggressively sold off and is now preparing for a retracement into a key supply zone.
🔸 Plan:
Waiting for a pullback toward the 0.8715–0.8740 supply zone (area of interest) to look for signs of bearish continuation.
🔸 BoS confirms shift in trend structure
🔸 STOP: Above the previous high ~0.8825
🔸 Target: Lower lows toward ~0.8500 short term — possible extension toward 0.84xx zone
🧠 RSI shows strong bearish divergence and confirms trend shift.
📌 Setup in progress — will monitor lower timeframes (1H/4H) for entry trigger within zone.

AMD Short AMD has the potential to fall from the $200 level within the Fair Value Gap (FVG) zone, and based on the Cypher pattern, it is aiming to reach a lower FVG zone as the next target.

29-07-2025This chart contains my analysis and key observations for today's trading session. All drawings and indicators reflect my current view of the market as of today. The purpose of this publication is to keep a record of my analysis and review it later for learning and improvement. No investment advice is provided.

EUR/USD SHORT — FRACTAL RENKO TRAP REVERSAL
🔻 EUR/USD SHORT — FRACTAL RENKO TRAP REVERSAL
Codex Execution | Tier 2 Rejection | Macro Gravity | TP1–TP10 Ladder Active
⸻
📍 TRADE SNAPSHOT
• Entry: 1.1665
• Stop Loss (SL): 1.1800 ✅ (Tier 2 pivot)
• Macro Direction (T1): 📉 Down
• Tier 2 Structure: 🔻 Bearish Flip Confirmed
• Execution Tier: Tier 2 rejection → continuation active
• Risk Size: ✅ Full position (SL = 135 pips)
• Trade State: ⚔️ Armed
• Trail SL: Activated post-TP1 → using Tier 3 pivots
⸻
🎯 TP LADDER MAP (Fixed Tier 2 Grid)
Level Price Status
🥇 TP1 1.1600 ✅ Hit
🥈 TP2 1.1500 ✅ Hit
🥉 TP3 1.1400 ⏳ Pending
🎯 TP4 1.1300 ⏳ Pending
🧨 TP5 1.1200 ⏳ Pending
💎 TP6 1.1100 ⏳ Pending
🔓 TP7 1.1000 ⏳ Pending
🔻 TP8 1.0900 ⏳ Pending
🔻 TP9 1.0800 ⏳ Pending
💀 TP10 1.0700 ⏳ Pending
🧠 TP ladder is mapped to Tier 2 (100 pip) round-number bricks — not floating from entry — per Codex IV structure logic.
⸻
🧠 STRUCTURAL RATIONALE
• Tier 2 Fib trap rejection confirmed @ 1.1665 (within 127.2–161.8% extension)
• Downtrend continuation brick confirmed below trap zone
• Tier 1 macro trend = bearish
• TP1 + TP2 already hit
• Trade now approaching TP3 zone (1.1400)
⸻
⚔️ TRADE MANAGEMENT PLAN
• ✅ SL trailed to breakeven after TP1
• ✅ Partial scale-out at TP1 / TP2
• 🔁 Add-on only allowed if:
• Retest rejection near 1.1500–1.1540
• OR clean body close below 1.1440
• ❌ No re-entry inside 1.1440–1.1500 dead zone
⸻
✅ EXECUTION FILTER STATUS
Condition Status
T1–T2 Alignment ✅
Trap Rejection Confirmed ✅
SL outside structure ✅
TP1–TP2 Reached ✅
Entry Trigger: Brick Close ✅
Macro Compression ❌
Time Cutoff (Pre-3PM EST) ⚠️ Confirmed OK
⸻
#EURUSD #FractalRenko #Tier2Trap #TP1toTP10 #CodexExecution #RenkoTrading #ShortSetup #InstitutionalFilter #TradingViewIdea #TrailLogic #RewardLadder
⸻

BONK | Waiting for DemandNo position yet—alerts are set for the FVG and HTF demand zone below. DOGE/BONK still showing relative strength, so patience here is warranted.
Plan:
Wait for price to tag HTF area of interest (FVG/demand).
Look for LTF trigger for a long entry.
Prefer clean sweep/reclaim for confirmation.
Reasoning:
BONK has strong momentum, but entry here is late after an extended run.
Letting the setup come to me reduces risk of getting caught in a local top.
DOGE/BONK relative strength signals not to rush.

WTI watch $70.34-70.43: Resistance zone that may STOP the surgeUSOIL spiked on Trump/Russia/Iran tariff threats.
Just hit a significant resistance at $70.34-70.43
Look for a Dip-to-Fib or Break-n-Retest for longs.

BTC/USDT Analysis — Hidden Buyer
Hello everyone! This is the daily analysis from the CryptoRobotics trading analyst.
Yesterday, Bitcoin continued its move toward the local low and formed a false breakout.
Throughout the decline, we observed a positive delta, which may indicate gradual accumulation of long positions. At the same time, the descending trendline has not yet been broken, and there was strong absorption of market buys around ~$118,400 and ~$118,800 — which makes entering long positions very risky at the moment.
Our main expectations are based on further rotation within the range marked in yesterday’s analysis. In the short term, we are watching for a test of two local zones to assess the reaction from sellers. If the reaction is weak, a test of the upper boundary of the new sideways range is quite possible.
Buy zones:
$116,200–$115,000 (volume anomalies)
$110,000–$107,000 (accumulated volume)
Sell zones:
~$118,400 and ~$118,800 (local resistances)
This publication is not financial advice.

Bitcoin Retests Broken Trendline Minor Resistance in Focus!Bitcoin has recently taken support from the lower levels and moved upward, successfully breaking above a key trendline resistance. Currently, the market appears to be forming another minor trendline resistance on the short-term chart. Interestingly, the previous trendline that was broken is now acting as a support zone, indicating a potential shift in market structure.
If the price manages to break this newly developing minor trendline resistance, we may expect a possible retest of that level. Should the retest hold, it could provide a strong bullish signal, allowing Bitcoin to continue its upward movement toward higher liquidity zones or resistance levels.

TRANSRAILL : Swing Trading (1-3 Months)#TRANSRAILL #patterntrading #cupandhandlepattern #breakoutstock #chartpatterntrading #IPOstock
TRANSRAILL : Swing Trading
>> Cup & Handle pattern
>> Breakout + Retest done
>> Trending stock Setup
>> Good Strength & Volumes picking up
Swing Traders can lock profit at 10% and keep trailing
Pls Boost, comment & Follow for more Analysis
Disc : Charts Shared are for Learning Purpose & not a Trade recommendation. Pls consult a SEBI Registered Advisor before taking position in it

GBPUSD - 30/7/25 - PIvot to bullishYesterday price touched a HTF demand zone that i marked out and on the 1 hour formed a break of structure. This is as per my plan a pivot ore reversal sign.
Now trying to find an entry its trickier. Initially i wanted to enter higher up at the green imbalance that is there, but i noticed equal low liquidity marked as $$$ which i will assume will be taken out. I placed a buy-limit here with a tighter SL than i normally go for, but the TP is the next high.
Today is a high impact news day with the Fed releasing news later today -hence i will not take as many trades.

Gold VS US 10- year yield Gold pared most of its gains on a strong US dollar. It hits an intraday low of $3307 and is currently trading around $3311.
Any breach below $3305 (365- 4H EMA) confirms trend weakness and a dip to $3245/$3200 is possible. The strong US dollar and surge in US 10-year yield after strong US jobless claims and GDP data.
It is good ot sell below $3305 with an SL around $3330 for a TP of $3245/$3200.

BTC: Calm before the storm on market, or where we go?Sometimes the market is straightforward: there’s momentum, a trend, a clear direction. But other times—like now—there’s complete uncertainty. Over the past few days, Bitcoin has been trading in a tight range, lacking any pronounced momentum. The price moves back and forth, bouncing off local levels but not breaking out in any meaningful way.
📉 This is especially clear on the 4-hour chart: neither bulls nor bears can take control. Every move upward is quickly met with selling pressure, and attempts to drop are countered by buying. It’s like a “ping-pong” match in a sideways market.
📊 Indicators show low volatility and declining volumes, confirming that market participants are simply waiting. Likely, they’re anticipating an external trigger: news, macroeconomic events, interest rate decisions, ETF developments, or something else.
What could this mean?
Such conditions often precede a strong move. The question is—where to? Honestly, there’s no clear signal yet. Personally, I try not to rush in moments like these: if the market isn’t giving a clear direction, it’s better to take a pause.
That’s the essence of a professional approach: don’t trade just for the sake of trading, but wait until the market speaks more confidently.
What can you do now?
– Watch the range boundaries and wait for a breakout or trade bounces.
– Avoid entering positions based on emotions—pullbacks can be sharp and unexpected.
– Reduce trade sizes if you do enter, and set tight stops.
– Keep an eye on the news—sometimes even neutral news can spark a move.
Sometimes the best decision is to do nothing. This might be one of those times. In a sideways market, you’re more likely to lose than gain. But clarity almost always follows a consolidation.

EURUSD Sell SetupHello traders!
Price has strong bearish momentum and is expected to move lower.
We're selling here with the target around the higher timeframe demand zone.
Manage your risk and trade safe!

$NSE:ETERNAL To SkyRocket in the Coming Days !NSE:ETERNAL
Very Good Price Action is Already Formed.
Its the Time to make Accumulations of Stock near the Current price.
Its The Company, Which Goin to Cater Services the Future.
Its Now or Never !
Boost the idea ! Pal

XAUUSD ideaWe are waiting for our asset to reach our action zone, and based on the reaction, we’ll decide on our next moves.ALWAYS WAIT FOR A CONFIRMATION TO SEE IF THE PRICE VALIDATES THE ZONE.and you what is your vision of the EURUSD its interests me! i wait you in the commentary

GBPUSD will resume downtrendA healthy pullback observed during Asian & Europe session.
I'm expecting a down move during US session.
Bearish engulf candle already forming. Waiting price to break nearest support @1.33617 for bearish confirmation.
my intraday target will be round number 1.33000.
please calculate your own risk & reward.
Good Luck

ETH - Bounce Zones - Nears the End for BULLSHello Fello's ☕
I'm watching Ethereum today and I believe it may be very close to the end of it's bullish cycle.
I think what could become likely is an extended altseason, where Bitcoin trades around the same price for some time, and Ethereum increases slightly. Afterwhich smaller altcoins (by marketcap) make random rallies before the beginning of a bearish cycle (which is due, see my previous BTC update).
There's an interesting channel here that previously determined bounce zones... I don't believe the channel itself will hold as much value going down, but this zone may be a likely bounce zone - around $3k.
Key bounce zones to watch include:
I'm not saying it will be this straightforward, but this image demonstrates the power of bounce zones for swing trades:
Next update will be when we've lost the first support zone.
Until then!