GBPJPY Will Fall!
HI,Traders !
#GBPJPY has retested a
Horizontal resistance level
Of 198.903 so we are
Locally bearish biased
And from the resistance we
We will be expecting a
Local bearish correction !
Comment and subscribe to help us grow !
Community ideas

7/31/25 - $weav - Just watching tn7/31/25 :: VROCKSTAR :: NYSE:WEAV
Just watching tn
- this tape has enough issues where $10 or $15 or $25 bn companies can't catch a needed bid for fcf yields and growth far in excess of what fiat IOU's yield
- so i already have my "favorite" $500 mm c'mon let'sgoco called NASDAQ:GAMB and liquidity and size seem to matter right now
- which (see private notes on chart) is why i am not going to complicate my life w/ this one tonight. but probably a dip buy esp if there's some sort of growth hiccup and i'd have time to investigate
- all in, this seems like a cool niche software co that hasn't really turned the corner on opex inflection to get toward DD ebitda mgns, but where if there remains progress as we've seen over the last year, it will be a matter of time
- tough to value this in a typical context
- so i'd say so far i like rev growth and sales flex on opex line, "therefore" R&D seems to be producing
- you all know rule of thumb, but in this tape let's put a heftier discount rate on 40 mm annualized budget of 20% (a defensibly conservative bar) and that's 40/.2 = 200 mm.. stock at 500 mm cap and you know i like to 2x that r&D budget, which says anything below 20% is a pretty easy dip buy for me (ex structural issues which i'd need to investigate). anything 15%... let's see. shallow 10%.. pass and look later. and if it's up... it just remains on the eternal watchlist.
be well
V

ETH will hit a new ATH in 16 days.ETH to reach new ATH in 16 days based on trend momentum and historical breakout patterns. Watching key resistance levels closely. High volume and bullish sentiment support the move.

EURUSD: Move Down Expected! Short!
My dear friends,
Today we will analyse EURUSD together☺️
The price is near a wide key level
and the pair is approaching a significant decision level of 1.15337 Therefore, a strong bullish reaction here could determine the next move up.We will watch for a confirmation candle, and then target the next key level of 1.15208.Recommend Stop-loss is beyond the current level.
❤️Sending you lots of Love and Hugs❤️

Gold Price Outlook: Bearish Trend DevelopingGold has broken below key top resistance, indicating potential for continued downside movement.
The US Dollar's recent rise has slowed amid renewed concerns about the US-China trade truce and profit-taking ahead of this week’s key employment data, following already strong GDP and ADP reports. While the dollar remains supported overall, uncertainty is capping its momentum, indirectly adding short-term volatility to gold.
The price action suggests a bearish breakout from key resistance zones. Momentum is building toward the downside, indicating the market could continue lower unless strong support levels hold. A potential bearish flag or breakdown structure is forming, and if confirmed, we may see a decline toward next support zones.
📍 Key Levels to Watch:
Resistance: 3310 / 3320
Support: 3269 / 3240
If gold remains below the broken resistance and fails to reclaim 3320, the bearish pressure is likely to continue. Watch upcoming employment data as it could add volatility and confirm the direction.
You may find more details in the chart.
Ps: Support with like and comments for better analysis Thanks.

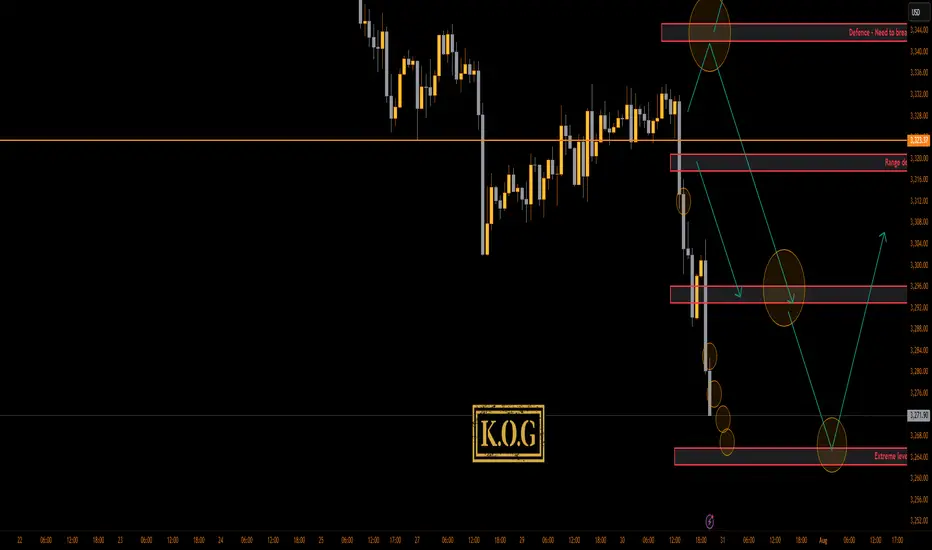
THE KOG REPORT - UpdateEnd of FOMC Update:
Thank you.
RED BOX TARGETS:
Break above 3335 for 3338, 3340, 3345, 3347 and 3357 in extension of the move
Break below 3320 for 3310✅, 3306✅, 3302✅, 3297✅ and 3393✅ in extension of the move
Please do support us by hitting the like button, leaving a comment, and giving us a follow. We’ve been doing this for a long time now providing traders with in-depth free analysis on Gold, so your likes and comments are very much appreciated.
As always, trade safe.
KOG
BULLISH BTC - Potential Inverted head and shoulders forming Potential breakout to $119 to $124,000 - Look for volume and support at $116 to $117,000. Breakout above $118,500 will confirm formation.

BTC CAN HIT 125K AFTER SHORT CORRECTIONHello friends, Bitcoin has made an incredible climb, carefully looking at the chart and also based on Elliott wave theory, it is clear that Bitcoin is completing submicro wave 4 of micro wave 5, wave 4 is usually an extended wave that covers a large time period with up and down fluctuations, I think the end of submicro wave 4 will be in the 110k-112k range in the four-hour timeframe. I think Bitcoin will break the 25k range in the coming days.

DJ30/US30 LONG Reason for trade:
1. Expanding flat in play
2. Equal highs (LIQUIDITY)
3. Currently at the order block area (Ready)
Entry: 43647
Stop Loss: 43386
Take Profit: 45246
Strategy: Wait for a 30 minute engulfing candle closure.
Once in profit of 1:1 R, place the trade at BE
Blessings, in CHRIST.

Sui - My T2 target just hit As anticipated, target 2 (T2) was hit right on time (as indicated by red arrow set a few days ago)
Sui dumped after taking the liquidity above the high and I
assumed it would swipe the lows as well...before any chance
of a meaningful move towards the upside.
I hope, Sui doesn't hit my bearish T3
The angle I chose for my arrow, is an average angle of attack.
I love it when a plan comes together.
May the trends be with you!

GBPUSD LongGBP/USD prices could potentially increase from the 1.3146 level within the Fair Value Gap (FVG) zone, with the next likely target being an upper FVG zone as a potential objective.

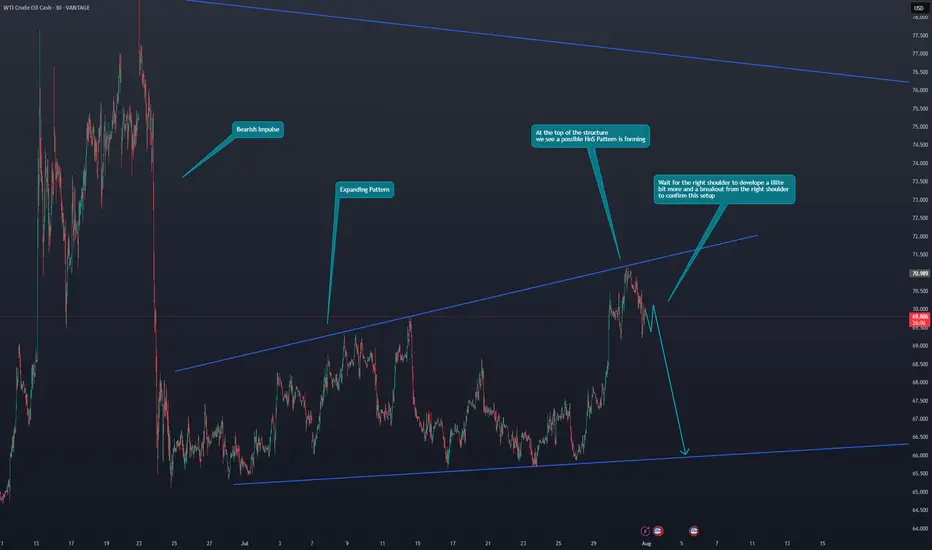
US OIL Potential ShortHi Traders.
Wait for the right shoulder to develope a lillte
bit more and a breakout from the right shoulder
to confirm this setup
POSSIBLE BEARISH CONTINUATION ON GOLDBased on price action, Gold presents a very bearish sentiment from the daily point of view.
The indicated supply region may be the area of interest for the build up of the sells if indeed Gold is bound for the monthly lows.
Confirmation is needed for an entry.

Lingrid | USDJPY Possible Strong Bullish RallyThe price perfectly fulfilled my previous idea . FX:USDJPY is trading within an upward channel after forming a higher low near the 147.50 zone, bouncing from the support trendline. Price action suggests a bullish structure continuation toward the 150.95 resistance, especially if the recent consolidation breaks higher. The overall formation aligns with a healthy correction phase before a potential push into the resistance area. Confirmation above 148.60 would likely accelerate the bullish move.
📌 Key Levels Buy zone: 147.50–147.25
Sell trigger: Below 147.00
Target: 150.95
Buy trigger: Break above 148.80
⚠️ Risks
Break below 147.50 may shift sentiment bearish
Strong resistance awaits near 150.00
Broader market volatility could invalidate pattern
If this idea resonates with you or you have your own opinion, traders, hit the comments. I’m excited to read your thoughts!


EUR/AUD BEARS ARE GAINING STRENGTH|SHORT
EUR/AUD SIGNAL
Trade Direction: short
Entry Level: 1.777
Target Level: 1.768
Stop Loss: 1.782
RISK PROFILE
Risk level: medium
Suggested risk: 1%
Timeframe: 2h
Disclosure: I am part of Trade Nation's Influencer program and receive a monthly fee for using their TradingView charts in my analysis.
✅LIKE AND COMMENT MY IDEAS✅

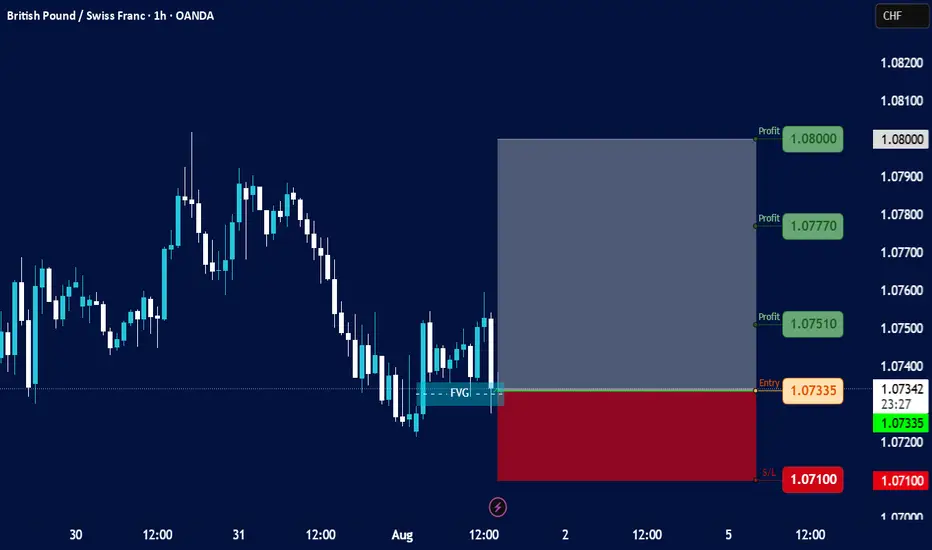
Technical Analysis: GBP/CHF (British Pound / Swiss Franc)Timeframe: Hourly (H1) – *Data as of Aug 01, 2025, 14:33 UTC+4*
Source: OANDA via TradingView
1. Key Price Levels
Current Price (C): 1.07357 (+0.09% from previous close).
High/Low (H/L): 1.07386 / 1.07308 (narrow range, indicating consolidation).
Resistance Levels:
R1: 1.07514 (near-term resistance).
R2: 1.08208 (stronger resistance).
Pivot Point (P): 1.07723 (intraday benchmark).
2. Price Action & Trends
Short-Term Trend: Slightly bullish (+0.09% gain), but trading near the day’s low (1.07308).
Volatility: Low (tight range between 1.07308–1.07386).
Support Zone: 1.07200–1.07335 (critical for bearish reversals).
3. Technical Indicators (Implied)
Pivot Points (PVC): Price is below the pivot (1.07723), suggesting bearish pressure unless it breaks above.
Resistance/Support:
Bulls need to push above R1 (1.07514) to target R2 (1.08208).
Bears aim for S1 (1.07335) or lower (1.07200).
4. Trading Signals
Bullish Scenario: Break above 1.07514 (R1) could signal upward momentum toward 1.07723 (Pivot).
Bearish Scenario: Drop below 1.07308 (today’s low) may extend losses to 1.07200.
Neutral Zone: Price oscillating between 1.07308–1.07386 suggests indecision.
5. Risk Management
Stop-Loss (S/L): Below 1.07200 for longs; above 1.07514 for shorts.
Take-Profit (T/P):
Longs: 1.07723 (Pivot) or 1.08000 (psychological level).
Shorts: 1.07200 or 1.07000.
6. Conclusion
Current Bias: Neutral-to-slightly bullish, but lacks strong momentum.
Watch For: Breakout from the 1.07308–1.07514 range for directional clarity.
Caution: Low volatility may lead to false breakouts; confirm with volume/RSI if available.
Recommendation: Wait for a confirmed breakout with volume before entering trades.
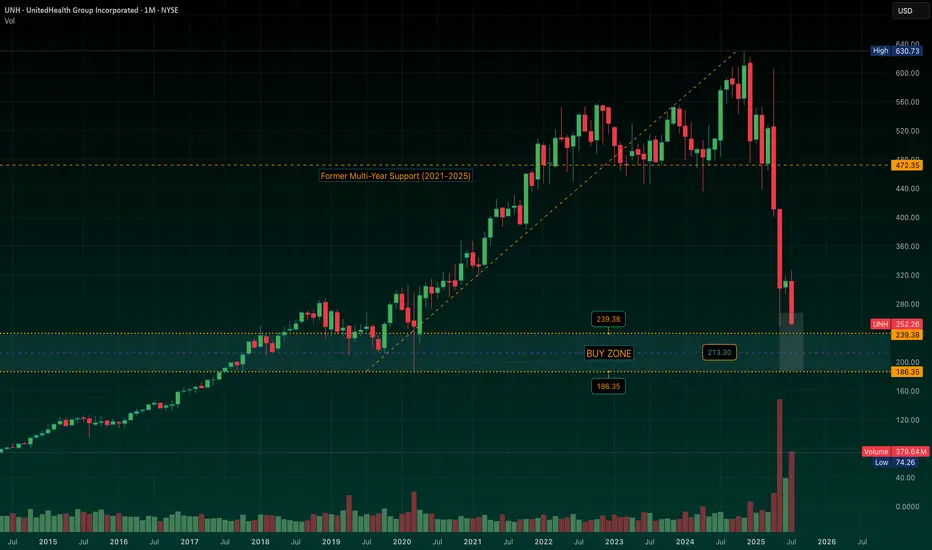
UNH: Mapping Out a Defined-Risk LEAPS Strategy in the "Buy Zone"UNH is approaching a broad structural support region I’ve been tracking -- a wide zone from $239 down to $186, where (for me) the stock begins to offer compelling risk/reward and long-term value. Momentum, IMO, is still decisively lower, but we’re nearing levels where I start preparing.
The midpoint of the “Buy Zone” near $213 reflects a potential average cost area I’d be very comfortable building from, depending on how price behaves as it enters the zone.
I’ll look to initiate exposure through long-dated call options (LEAPS) -- as I’ve started doing in NYSE:CNC -- once the setup begins to stabilize. From there, I’ll begin layering in short puts at ownership levels that align with the broader structure. If assigned, I’ll own where I intended. If not, I’m collecting premium to help finance the LEAPS.
I’m not in the business of calling exact bottoms… this is about building a position that respects time, structure, and flexibility -- anticipating a slow grind higher over the next 12–18 months. Stay tuned.
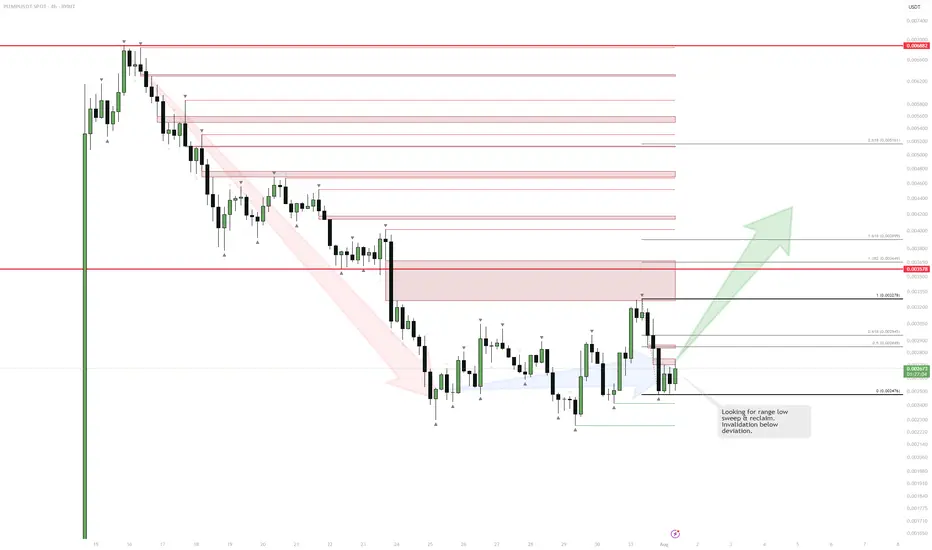
PUMP | Watching for Base ConfirmationThe sharp downtrend is showing signs of exhaustion as price starts to consolidate and build a potential range.
If we see a sweep and reclaim of the range low, that would confirm the start of a new accumulation phase and signal a potential reversal.
The invalidation for any long attempt is a confirmed breakdown below the deviation or the origin of the reclaim.
Plan:
Wait for a clean sweep and reclaim of the range low to trigger a long entry.
Target resistance levels above, with stops set below the reclaim origin.

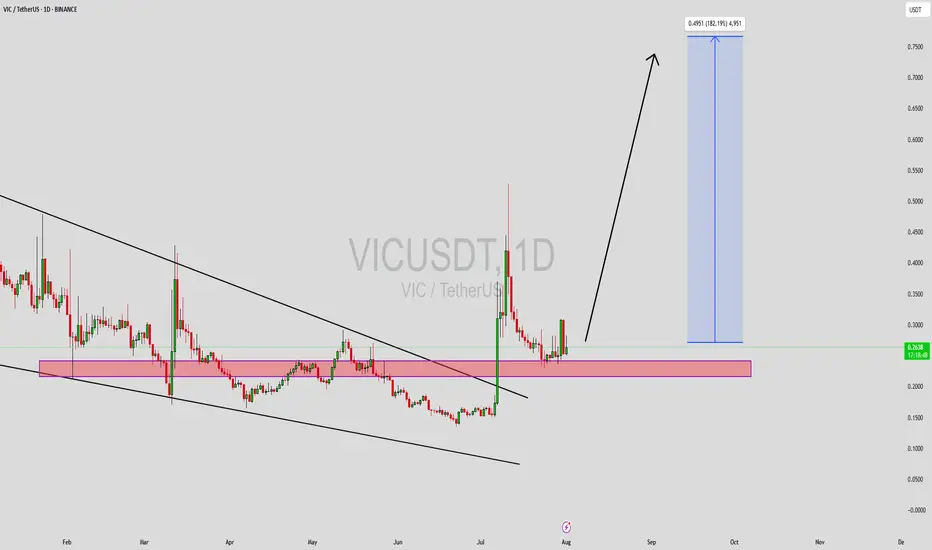
VICUSDT Forming Descending WedgeVICUSDT is currently displaying a classic descending wedge pattern, which is often recognized as a bullish reversal signal in technical analysis. This pattern typically emerges after a prolonged downtrend, and when paired with good volume — as we’re now seeing — it suggests that selling pressure is weakening and a breakout to the upside could be imminent. VIC has respected its wedge boundaries well, and now it's approaching the breakout zone, making this an ideal time for technical traders to watch closely.
Volume has been steadily increasing, which supports the idea of accumulation at the current levels. This convergence of price and volume dynamics signals that smart money may be positioning itself ahead of a potential rally. Based on the measured move from this wedge pattern, a 140% to 150% gain could be on the horizon once confirmation of breakout is secured. The price is also hovering near historical support, which adds another layer of confluence to the bullish outlook.
With investor interest rising and sentiment shifting, VICUSDT has the potential to outperform in the coming sessions. Altcoins that consolidate in well-defined reversal patterns and attract volume are often primed for explosive moves. Traders looking for setups with strong technical structure, breakout confirmation, and momentum alignment may find VICUSDT to be one of the top candidates for mid-term gains.
This is a high-reward opportunity for patient and disciplined traders. Keep an eye on resistance breakout levels and volume surges, as they may trigger the start of a powerful trend reversal.
✅ Show your support by hitting the like button and
✅ Leaving a comment below! (What is You opinion about this Coin)
Your feedback and engagement keep me inspired to share more insightful market analysis with you!
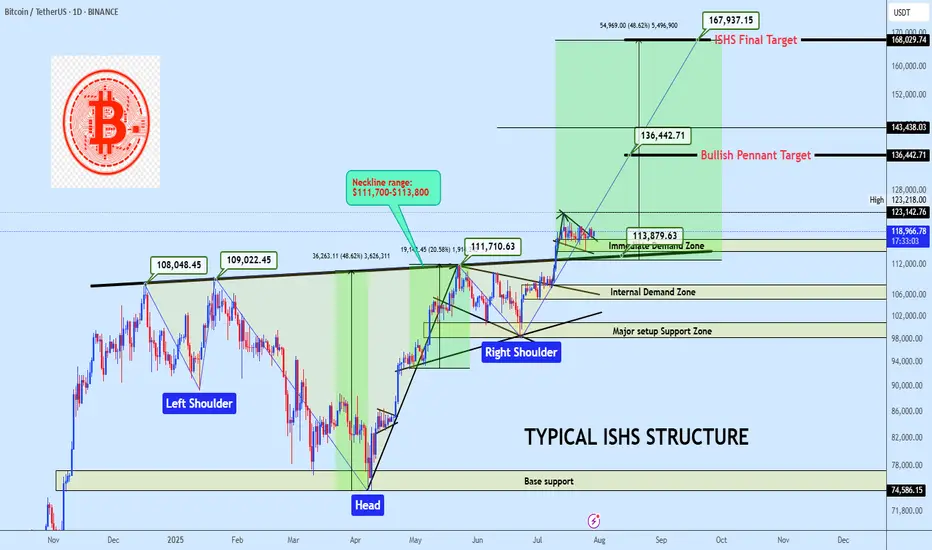
BTCUSDT ISHS Breakout with Bullish Pennant ContinuationBTC is holding above a clean neckline breakout from a inverse head and shoulders formation, currently consolidating inside a bullish pennant. A breakout from this range offers continuation potential to $136K and possibly to $168K. Bias remains bullish while price holds above the $114K region.
Market Structure
• Trend: Bullish continuation
• Pattern: Inverse Head & Shoulders + Bullish Pennant
• Price Action: Clean breakout and retest of neckline support, followed by tightening consolidation
Key Zones
• Immediate Demand Zone: $114,000 – $117,000
• Internal Demand Zone: $105,000 – $108,000
• Major Setup Support Zone: $98,000 – $101,000
• Base Support (ISHS Origin): $74,500 – $77,000
• Neckline: $111,700-$113,800 (Confirmed pivot level)
Technical Confluence
• Volume: Strong candle breakout through neckline, followed by low-volume bullish flag
• Price Geometry: ISHS measured move aligns with the final target at $168K
• Momentum: Bullish structure maintained with higher lows and reactive demand
Entry Plan
• Zone: $117,500 – $119,000
• Method: Limit buy on demand retest or breakout retest of $123K
• Execution: Swing entry with invalidation below demand base
Targets
• 🎯 TP1: $136,442 — Pennant measured move
• 🎯 TP2: $168,029 — Final ISHS target
Invalidation
• ❌ SL: Below $110,000
• Reason: Break below ISHS Neckline invalidates bullish thesis in the short term
• RRR: Estimated 1:4 depending on execution
If this structure aligns with your outlook, feel free to share your thoughts in the comments.
You’re also welcome to drop your preferred altcoins for a quick technical review.
#MAGIC/USDT Falling Wedge + Fib Confluence #MAGIC
The price is moving within a descending channel on the 1-hour frame, adhering well to it, and is on its way to breaking strongly upwards and retesting it.
We have support from the lower boundary of the descending channel at 0.1620.
We have a downtrend on the RSI indicator that is about to be broken and retested, supporting the upside.
There is a major support area in green at 0.1662, which represents a strong basis for the upside.
Don't forget a simple thing: ease and capital.
When you reach the first target, save some money and then change your stop-loss order to an entry order.
For inquiries, please leave a comment.
We have a trend to hold above the 100 Moving Average.
Entry price: 0.1780.
First target: 0.1827.
Second target: 0.1905.
Third target: 0.1962.
Don't forget a simple thing: ease and capital.
When you reach your first target, save some money and then change your stop-loss order to an entry order.
For inquiries, please leave a comment.
Thank you.
