BTC Moon Phase, Dominance % and BBWP resolutionBTC, D. Moon Phase. I see bearish scenario for the next days, until 4-5th of August. After reviewing Moon Phase chart for last year+, I see same scenario is happening most of the times. During the First Quarter ( Aug. 1) of the phase, price is dropping and start to recover about 4-5 days prior Full Moon. This is exactly when energy of the Full Moon starting to amplify. Current BBWP is contracted for 8 days, making the next move very rapid, I would not set any long/short trades, untill the volume start to expand. Its the mid summer - always slow and August is the month it start to accelerate towards the Fall, with all financial/political tricks happening in September and later in Q4. We already had one bear trap fakeout, but price didnt anticipate to go higher and got rejected by falling wedge upper like ( or bull flag, in this case).I would expect that high volume green candle will be either fully recovered to $110-111K , or 75% recovery, where the CME gap is $113500 - 1-2% lower, making it $113,000. The cascade liquidation will happen very fast, I expect the whole move down and up will take around 24 hours, with the bottom time 5-15 minutes. Need to be ready, that all alts will crash as well, Im expecting BTC %dominance to bounce here , after 8.4% drop to weekly 50EMA. I would like to see BTC, D% at 70% by Christmas and new ATH, what ever it is 160K or 200K what ever it is, for bitcoin to make ATH, it must grab dominance.
Community ideas

SHOP has one more seller to BuyHello I am the Cafe Trader.
Today we are going to be looking at Shopify, Thanks to a request from a follower.
Couple things to note here. This is a Massive range for a decent stock.
With a bottom of 23.61, and a high of 176.34 some may wonder if we might see some more downside before testing the highs (rightfully so).
Today we are going to look at some long term prices I think are suitable for your personal risk tolerance. as well as two possible short term scenarios and how you can navigate them.
Enough talking let's get into the charts.
Long Term
These prices are chosen from current market participants. I've measured them in order of your own conviction.
Aggressive = 122 (Top of Demand)
Fair Price = 99-102 (Concentrated demand)
Steal = 70-81 (Top of Strong Buyers)
Short Term
I'm going to be honest here, I don't particularly like the positioning of the range to go long here. That Strong Supply area is still very active, and we may have to hit that concentrated demand before having enough strength to get through that supply.
As this stands though, Bulls are in control. We have that trend break with real buyers, this is looking to hit top of supply in it's current context.
If at all we close above that strong supply (especially on friday) This is a great case to have a continuation.
If we cannot get above this strong supply after a test or two more, this is going to put pressure on the buyers.
Green Scenario
Entry 122
Stop 111.50
1st TP 141
Final TP 145.50
Red Scenario
If bulls make a big push and fail back below the strong supply, Bulls will be trapped, and This will put alot of pressure on the "Top of Demand".
Entry = close of the candle that is the false breakout.
Stop = Depends on how big the wick was on the false breakout. I'll assume about 131.50. but if its a huge wick, it will need to be higher. I'll update this depending.
1st TP = 106
Final = 102.5
That's all for SHOP Stay tuned for updates and more charts!
Happy Trading!
@thecafetrader
@livelclark

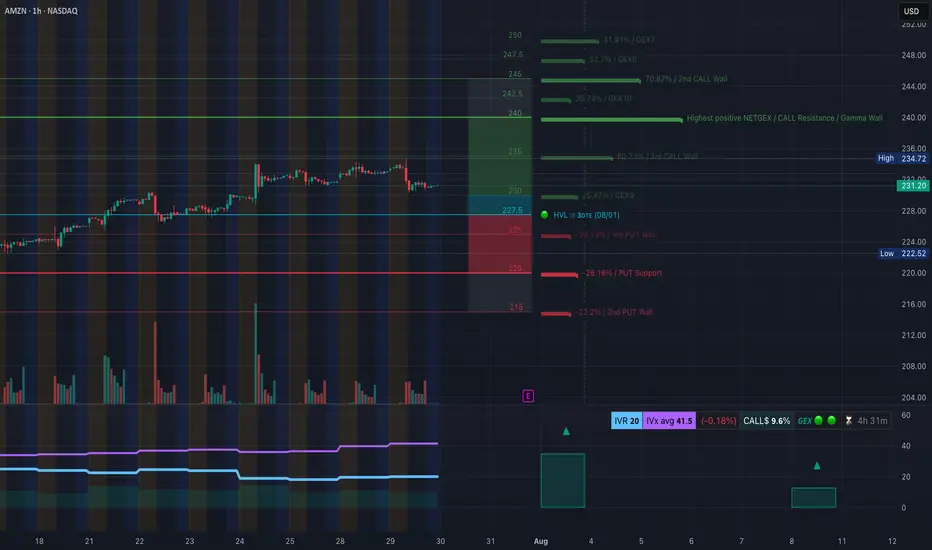
Will $222 Hold or Are We Heading for $215 Flush? July 30AMZN Breakdown in Progress!
🔍 GEX Insights & Options Trading Thoughts (1H Perspective)
Amazon (AMZN) is transitioning from a distribution phase into a potential gamma-driven selloff, and the current GEX setup confirms that bias. The GEX walls are sharply stacked on the downside, while call walls remain heavy above current price—creating strong overhead pressure.
🔸 Gamma Exposure Breakdown:
* Highest Positive GEX (Call Resistance):
* $236 → this is where market makers lean short, and we see strong rejection wicks from this zone.
* 3rd Call Wall: $236
* 2nd Call Wall: $242.5
* GEX Flip Zone / Transition Area: $231–227.5
* Below this = gamma turns negative, increasing downside velocity
* PUT Walls:
* $225 = 3rd PUT Wall (-20.13%)
* $220 = Major PUT Support (-26.16%)
* $215 = 2nd PUT Wall (-22.2%)
The positioning suggests a gamma gravity pull toward $225 → $222, with high risk of flush to $215 if $222 breaks.
🔸 Options Setup Suggestions:
* Bias: Bearish
* Ideal Option Play:
* Aug 2 / Aug 9 $225P or $220P
* Enter on failed retest of $231
* Exit partial at $225, full at $222 or $215
* Avoid chasing puts too late—look for retest rejection near $231–232
If you're conservative, watch for a break and close below $227.5 to confirm further drop before entering.
🧠 1H Intraday Technical Analysis (TA)
Market Structure:
* AMZN broke below the ascending trendline, showing a clean CHoCH (Change of Character) after price rejected $236 twice—clear sign of distribution.
* BOS → CHoCH sequence confirmed, showing the shift from bullish to bearish order flow.
* Price is now trapped below the former support zone ($231.5), which has turned into supply.
Supply & Demand Zones:
* Supply Zone (Resistance): $234.5–236
* Micro Supply (Retest Area): $231.5–232.5
* Demand Zone (Support): $223–222
* Next Key Demand: $215
* If $222 fails, there’s minimal liquidity support until $215
Volume & Confirmation:
* Volume profile shows declining participation on upside pushes, followed by heavy sell volume candles post-CHoCH.
* This supports the idea of institutional distribution above $234.
🧭 Trading Outlook
🔻 Bearish Intraday Play (Favored):
* Entry 1: Retest rejection at $231.5–232
* Entry 2: Breakdown below $227.5
* Target 1: $225
* Target 2: $222.5
* Target 3: $215 (if panic flush triggers)
* Stop Loss: Above $234
🔼 Bullish Reclaim (Less Likely):
* Needs to reclaim $234.5 with strength
* Would target $236, $240
* Not supported by GEX or volume—low probability
🧠 Final Take:
AMZN is now trapped beneath heavy call walls and has shifted structure with a confirmed CHoCH. GEX shows negative gamma territory below $227.5, creating a slippery slope toward $222. The option market is positioning for further downside while intraday structure aligns for a potential flush into lower demand zones. Unless bulls reclaim $234+ with volume, this setup remains bearish biased with favor to PUT side trading.
🛑 This breakdown is for educational purposes only and does not constitute financial advice. Trade at your own risk and always manage your positions carefully.
GBPUSD backtesting CompletedFrom the chart, we can see this currency pair had completed the backtesting, today will have to enter to the market
From the trend line, it shows that remain into the upward position.

US30 - BUYStrong selling pressure today as price has grabbed a ton of buy side liquidity. As we approach FOMC news tomorrow, I am expecting buyers to take back control and price reach Sundays opening price.
PUMP | #4h #long — Watching for Breakout Confirmation Early signals for a reversal, but not rushing in.
Some clear bullish divergence on the 4h RSI — first positive sign after an extended downtrend. Price can pop from here, but my plan is to wait for a break and hold above the 4h Order Block + MSS zone (red box) before taking any long entry.
Confirmation is key — I only want to get involved if we reclaim this area with momentum.
Scenario:
If we get a strong breakout and close above the red OB + MSS zone, that’s the first entry trigger for a potential trend reversal.
Until then — standing aside, letting the setup prove itself.
Reasoning:
Bullish RSI divergence often marks the beginning of a reversal, but without a structural breakout, the move can easily fail.
Patience pays off in these high-risk, low-liquidity coins.

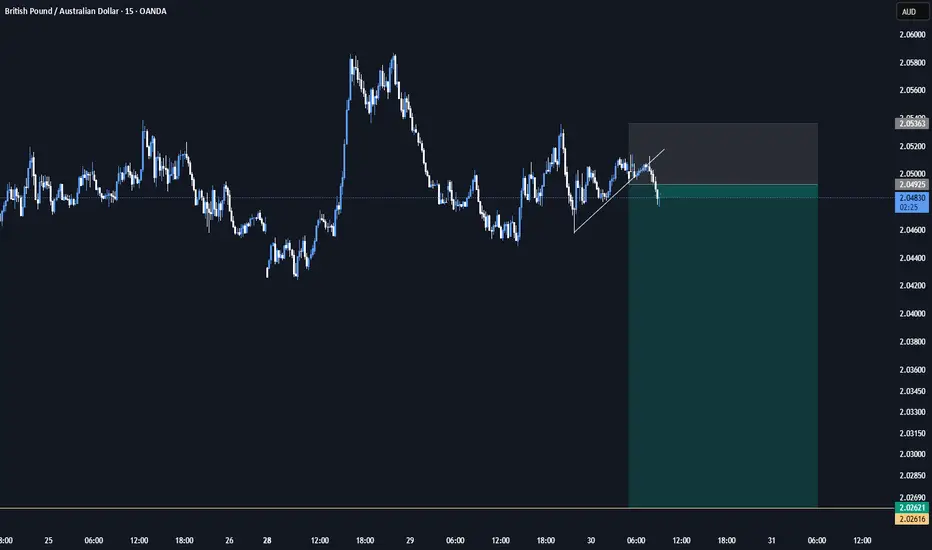
GBPAUD SHORT IDEAIm looking for short on GBPAUD based on current trend and price action and RSI not reach yet the overbought level on daily. And CPI AUD news will come in few minutes . All the best traders
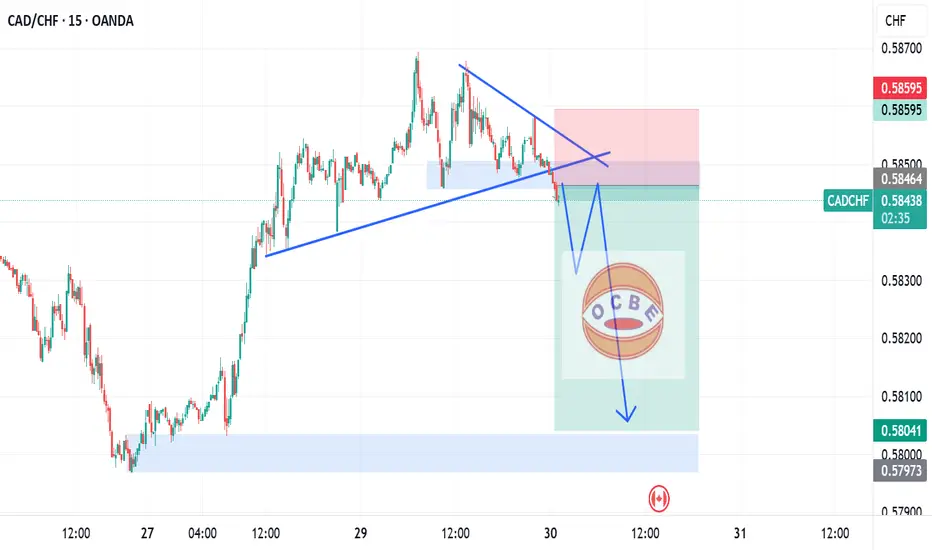
CADCHF short move
Price had broken the support level and hence am expecting more downward movement in price.
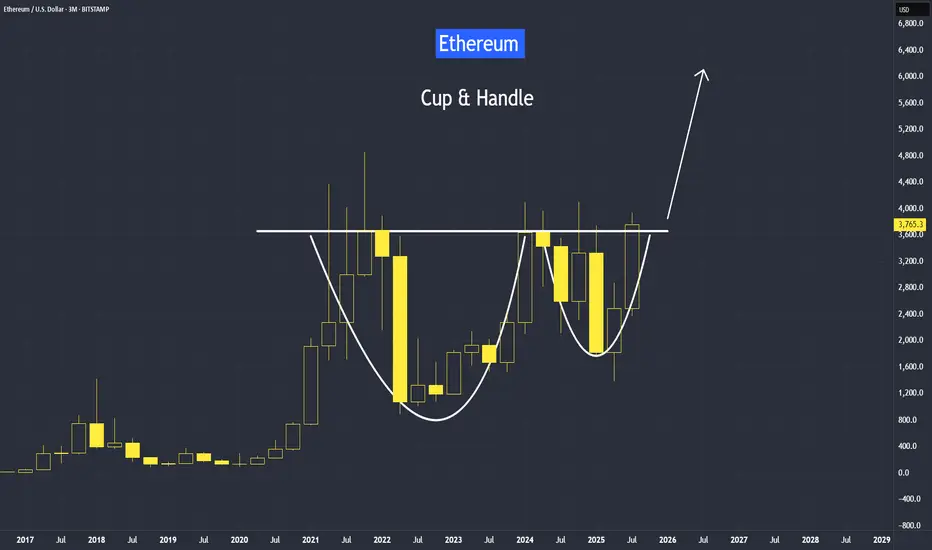
Cup and Handle Setup in Ethereum Since April trough, Ethereum has risen by 179%, delivering a higher rate of return than Bitcoin at 66%.
But most of our attention is on Bitcoin, breaking above the 120,000 level.
Why is Ethereum quietly gaining ground —and what does the future hold for Ethereum?
It's video version on its trading strategies:
Mirco Bitcoin Futures and Options
Ticker: MET
Minimum fluctuation:
$0.50 per ether = $0.05 per contract
Disclaimer:
• What presented here is not a recommendation, please consult your licensed broker.
• Our mission is to create lateral thinking skills for every investor and trader, knowing when to take a calculated risk with market uncertainty and a bolder risk when opportunity arises.
CME Real-time Market Data help identify trading set-ups in real-time and express my market views. If you have futures in your trading portfolio, you can check out on CME Group data plans available that suit your trading needs www.tradingview.com
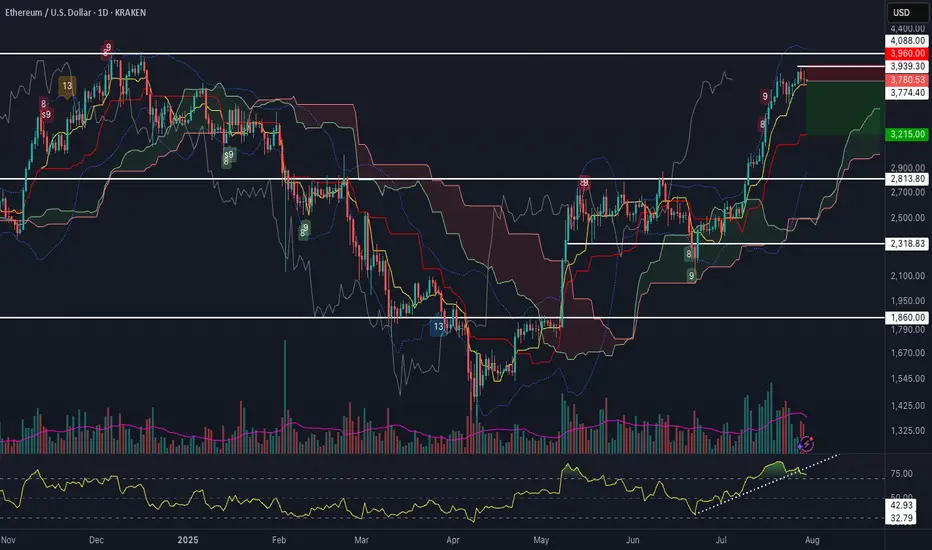
ETH Potential Swing ReversalAfter a strong leg higher, Ethereum is flashing a confluence of short-term reversal signals:
1. RSI trendline break on the daily, with bearish divergence building
2. %B Bollinger Band divergence, following three consecutive upper band taps during this move
3. Demark 9
4. Formation of a Doji candle at resistance, showing indecision near a key level
A clean break here opens room towards Ichimoku cloud support at $3,215.
🧠 Thoughts welcome!
GOLD prep work to ATH retap has started. seed at 3270!First thing first.
Diagram above is in reverse metrics (USDXAU)
--------
GOLD, has been met with some well deserved respite on price growth after a series of parabolic highs this past few weeks. And this healthy trims are warranted in the grand scheme of things -- to sustain its upward trajectory. A price rest is definitely welcomed.
Now based on our latest daily metrics, gold is showing some low key hints of shift -- it may not be visible to 99% of traders -- but it is there now to magnify.
Diagram above is in reverse metrics (USDXAU). It is currently showing some pressure expansion for bears and hinting of prep work to reverse.
This is a precursor of a massive structure change-- for that elusive upside continuation.
On the daily metrics, we got some hop signals here as well from -- first one in a while. Price baselines detaching itself from the descending trend line. There maybe something here now. A good zone to seed on the most discounted bargain levels -- with safety.
Spotted at 3260.
Interim mid target: ATH at 3500
Long term. 4k++
Trade safely.
TAYOR.

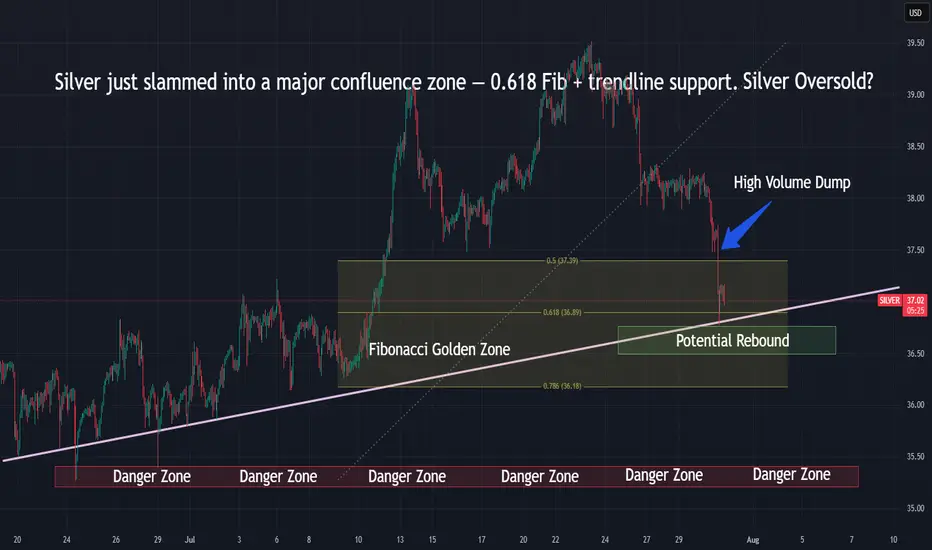
Silver Hits Fibonacci Support — Rebound or Dump?Silver just slammed into the 0.618 Fib — a key reversal zone.
📌 Eyes on bounce or breakdown toward the danger zone below $36
⏱️ Timeframe: 1H
#silver #xagusd #fibonacci #commodities #tradingstrategy #tradingview #quanttradingpro
$ETH to $6.45k USD - 2024's Crescendo CRYPTOCAP:ETH is showing strong signs of an impending breakout to the $6.4k–$8k range, backed by two key technical indicators:
Cup & Handle Formation: ETH has recently broken out of a textbook cup and handle pattern, confirming the breakout with a solid retest over this past week of VOL. This is a classic bullish signal pointing to higher targets.
Bull Pennant: Since the 2021 rally, ETH has been consolidating within a massive bull pennant. This long-term structure suggests Ethereum is coiled and ready for a significant move upward.
1.618 Fib: Also layering in a Fibonacci retrace, if ETH is indeed heading for ATHs and price discovery, the 1.618 FIB is a common level that traders are very familiar with. It just so happens to be right in the middle of our target box at ~$7k!
Momentum is building— we will need to keep an eye on volume and follow-through for confirmation.
To boot, bearish sentiment for ETH is near all time highs. I think it might be time for a most-hated rally. I have a short term allocation in AMEX:ETHT to ride this momentum, NFA DYOR

AUDCAD Resistance Ahead!
HI,Traders !
#AUDCAD is trading in an
Uptrend but the pair is locally
Overbought so after the pair
Hits the horizontal resistance
Level of 0.90210 we will be
Expecting a local bearish
Move down !
Comment and subscribe to help us grow !

LINK 4H – Bounce from the 0.5 Fib, Eyes on $21Chainlink just posted a clean reaction off the 0.5 Fibonacci retracement (16.76), reclaiming trend structure after a sharp pullback.
The last time LINK bounced from this zone, it ripped straight through resistance. Now we’ve got:
Strong support reaction off the 0.5 Fib
Higher low forming inside structure
Stoch RSI resetting from oversold
Clear measured move potential toward $21.00
This setup gives a defined invalidation zone just below 16.50, with upside targeting the previous high and beyond.
🔍 Key Levels:
Support zone: 16.76–15.93
Target 1: 19.50
Target 2: 21.08
Invalid if we lose 15.80 with momentum breakdown

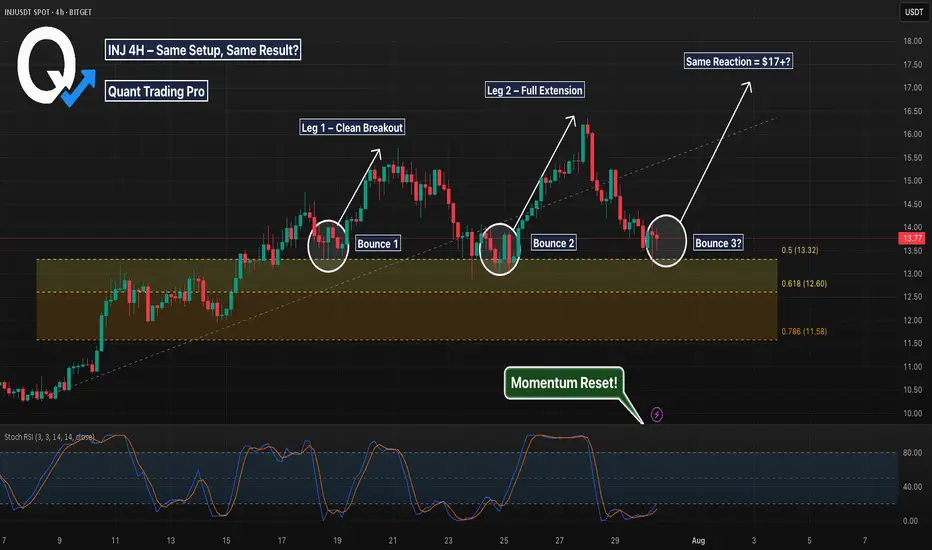
INJ 4H – Bounce Structure Repeating for a 3rd Time?INJ is showing one of the cleanest bounce structures we’ve seen all week.
Twice now, price has pulled back into this Fib zone (between the 0.5 and 0.618) and reversed cleanly — forming back-to-back legs up. Now we’re right back in that same golden pocket, with Stoch RSI fully reset and price showing signs of stabilizing.
🔍 What This Chart Shows:
Bounce 1: Clean reversal off the golden pocket → new local high
Bounce 2: Identical pullback → full extension into $16+
Current setup: Testing the same zone again (0.5 = 13.32, 0.618 = 12.60)
Momentum: Stoch RSI reset + structure still intact
Measured move projection: $17.50+ if we see a similar reaction
🧠 Why It Matters:
This is where high-RR trades are born — when you can define your invalidation below the Fib zone and let structure do the heavy lifting. It’s not about predicting—it’s about positioning.
One setup. One zone. Three chances to catch the move.
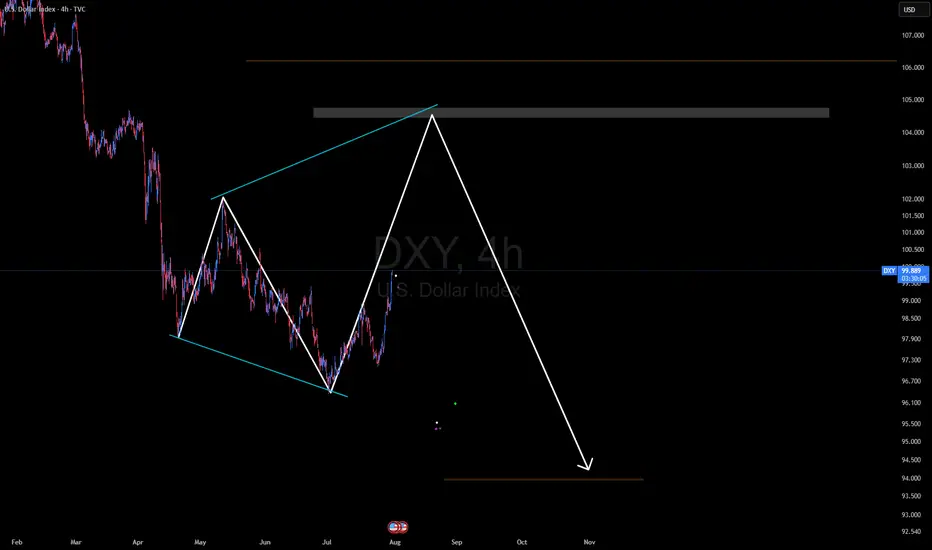
USD Dollar Index (DXY): Pushing Higher As Forecast!Welcome back to the Weekly Forex Forecast for the week of July 30 - Aug1
In this video, we will analyze the following FX market:
USD Index
In my last USD video, the forecast was for higher prices. Check the related links below to see that video forecast. It played out exactly as analyzed. The +FVG was used to push for higher prices. The FOMC decision to keep the rate unchanged only pushed it further along.
Enjoy!
May profits be upon you.
Leave any questions or comments in the comment section.
I appreciate any feedback from my viewers!
Like and/or subscribe if you want more accurate analysis.
Thank you so much!
Disclaimer:
I do not provide personal investment advice and I am not a qualified licensed investment advisor.
All information found here, including any ideas, opinions, views, predictions, forecasts, commentaries, suggestions, expressed or implied herein, are for informational, entertainment or educational purposes only and should not be construed as personal investment advice. While the information provided is believed to be accurate, it may include errors or inaccuracies.
I will not and cannot be held liable for any actions you take as a result of anything you read here.
Conduct your own due diligence, or consult a licensed financial advisor or broker before making any and all investment decisions. Any investments, trades, speculations, or decisions made on the basis of any information found on this channel, expressed or implied herein, are committed at your own risk, financial or otherwise.

New Setup : $MUThe hourly chart sees a bullish crossover, bullish ATR Break, and Bullish Price Action already out.
Ready To catch it

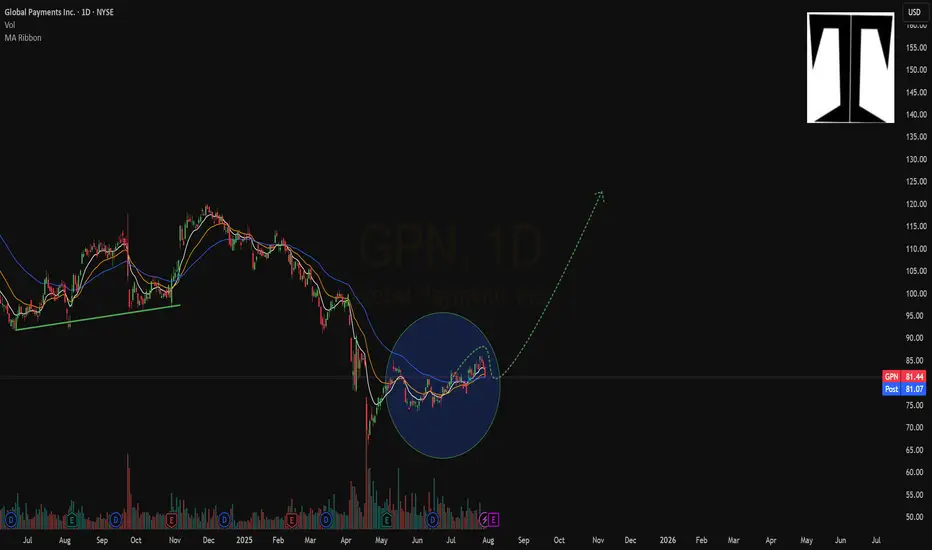
New Setup : $GPNThe daily chart sees a bullish crossover with a small pullback on the ema 50d.
New Bullish ATR Alert popped out as well
Ready To Catch it !!
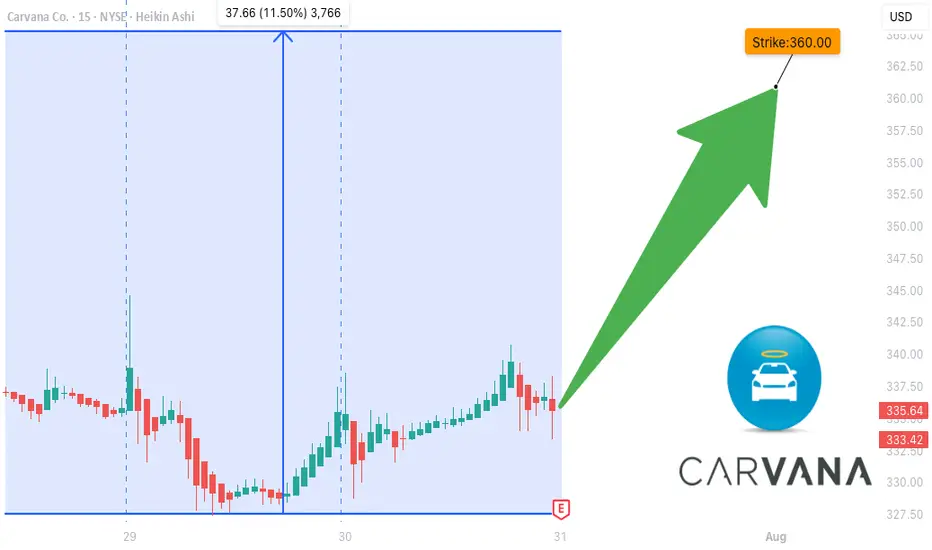
CVNA EARNINGS TRADE IDEA — July 30 (AMC)
## 🚗 CVNA EARNINGS TRADE IDEA — July 30 (AMC)
**Carvana (CVNA)**
📊 **Bullish Confidence**: 85%
📈 **Earnings Play Setup**
💣 Big Volatility + Strong History = Explosive Potential
---
### ⚙️ FUNDAMENTALS SNAPSHOT
✅ **Revenue Growth**: +38.3% YoY
🔁 **8/8 EPS Beats** (114.5% avg surprise)
🟡 **Profit Margin**: 2.7% (Thin but improving)
⚠️ **Debt-to-Equity**: 344.78 (High leverage risk)
💬 **Sector Rotation**: Growth favors high-beta names
💡 **Beta**: 3.60 → Big post-earnings swings likely
---
### 📊 OPTIONS FLOW HEATMAP
🔥 Heavy Call Volume @ \$360–\$370
🟢 Bullish OI Stack
📉 Put/Call Skew: CALL DOMINANT
💥 IV Elevated = Lotto ticket pricing
---
### 📈 TECHNICALS
💵 Price: \$336.50
🧱 Resistance: \$343.68
📉 RSI: 44.5 (Neutral – Room to Run)
📊 200D MA: \$252.21 → Long-term bullish positioning
---
### 🔥 TRADE IDEA:
**CVNA 08/01 \$360 CALL**
🎯 **Entry**: \$11.25
🚀 **Target**: \$33.75 (200% ROI)
🛑 **Stop**: \$5.60
📊 **Size**: 1 contract
⏰ **Entry Timing**: Pre-Earnings Close (AMC play)
---
### 📉 RISK / REWARD
* 🟥 Max Loss: \$11.25
* 🟩 Profit Target: \$33.75
* ⚖️ RR Ratio: 1:3
* 💼 Portfolio Risk: 2–3%
---
### 🧠 STRATEGY INSIGHTS
✅ Historical beat rate = STRONG
✅ Bullish options skew = CONFIRMED
⚠️ High debt = risk, but momentum > fear
📌 Tip: If IV crushes post-earnings, exit fast. This is a *structured speculative play* — not a hold-and-hope.
---
📢 "Speculation is fine. Structure it."
💬 Tag a trader who *YOLOs with stop losses* 👇
\#CVNA #EarningsPlay #OptionsTrading #TradingView #HighBeta #LottoPlay #RiskManaged #CallOptions #BullishSetup #IVCrushProof #EcommerceStocks #EarningsSeason
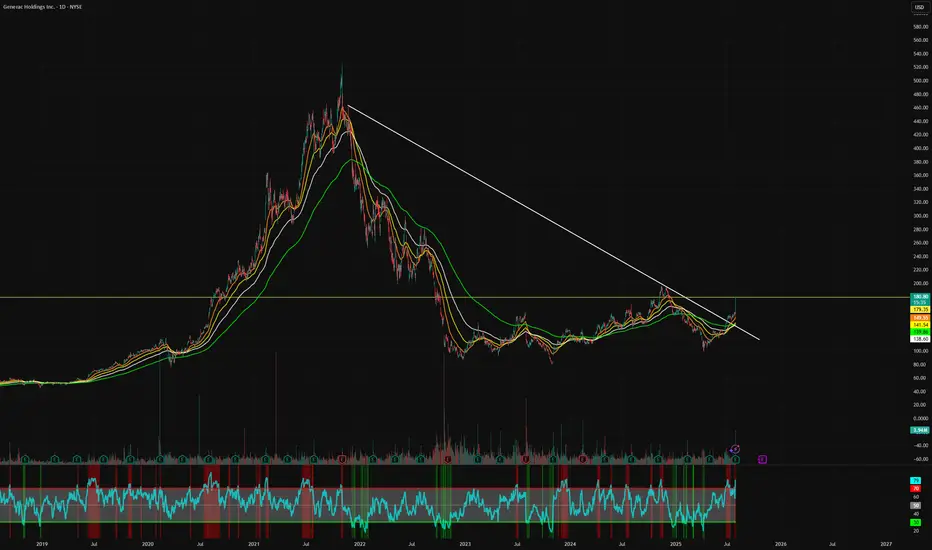
Generac Breaking OutSolid earnings and copper prices are tanking, the bullish golden cross has occurred and this stock is off to the races. This has the potential to start a new bull run. Keep an eye on it, if it breaks the weekly this could get interest. Not financial advice...
Btcusd techinical analysis.Btcusd techinical analysis next move posibale at h1 time frame not finchinal advice.

DXY bullish trend The market reaction indicates that the economy remains very strong, and there is no immediate need for the Fed or any central bank action. Powell emphasized that any potential rate cuts will depend on the upcoming data, especially the August reports. As a result, the DXY is expected to remain strong and could rise towards the 104.00–106.00 levels. A potential bearish reversal in the DXY would only be likely if there is significant economic deterioration or a clear shift in Fed policy expectations.