Gold Analysis and Trading Strategy | August 1✅ Fundamental Analysis
🔹 Trump Signs New Tariff Executive Order
On July 31, President Trump signed an executive order imposing a new round of tariffs on countries including Canada and India, while Mexico was granted a 90-day grace period. This move has once again heightened global trade uncertainty, fueling risk-off sentiment and providing support to gold.
🔹 Dollar Strength Limits Gold's Upside
Despite the increase in risk aversion, the U.S. Dollar Index has risen sharply, exerting downside pressure on gold. As a result, the price of gold remains capped, with a tug-of-war between bulls and bears dominating market dynamics.
🔹 Key U.S. Economic Data in Focus
The U.S. Non-Farm Payrolls (NFP) report is the major event on the calendar today. It is expected to be a decisive driver for short-term gold direction:
If the data is bullish for gold (e.g., weak job growth or slower wage increases), gold may retest the 3340 level.
If the data is bearish for gold (e.g., strong job gains or higher wages), gold may break below 3260, continuing its downward trend.
Ahead of the data release, gold is likely to remain in a consolidation range, with market participants generally adopting a cautious stance.
✅ Technical Analysis
🔸 Daily Chart Structure:
Gold printed a gravestone doji yesterday, characterized by a long upper shadow, indicating strong selling pressure at higher levels. The overall trend remains weak. After four consecutive daily declines followed by a minor rebound, another strong bearish candle has emerged, signaling a continuation of the downtrend.
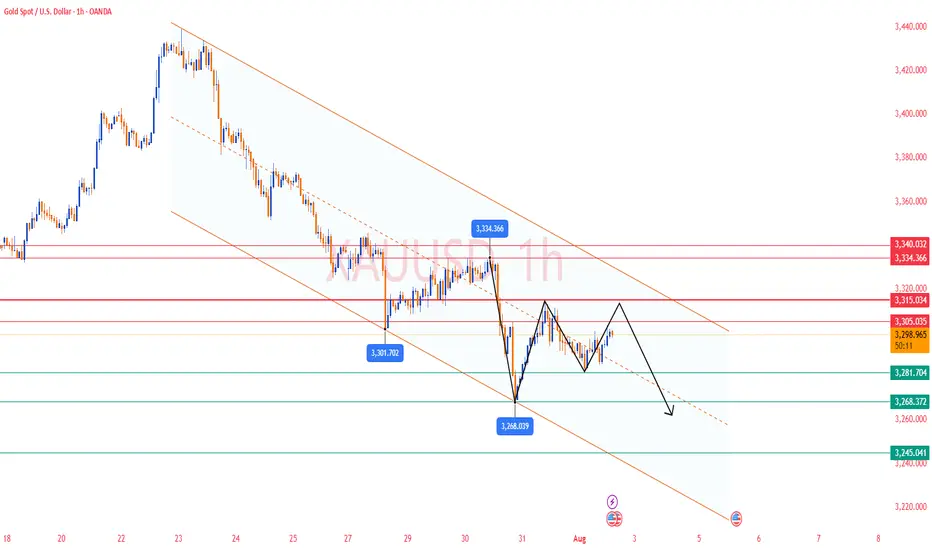
🔸 Hourly Chart Structure:
On the 1-hour timeframe, gold remains below all major moving averages, which are aligned in a bearish formation. Despite multiple rebound attempts, each high has been lower than the last, reflecting diminishing bullish strength. The second U.S. session high was capped around 3310. If today's rebound fails to break above that level, the bearish trend remains dominant.
🔴 Resistance Levels: 3305 / 3315 / 3340
🟢 Support Levels: 3275 / 3260 / 3245
✅ Trading Strategy Reference:
🔻 Short Position Strategy:
🔰Consider entering short positions in batches if gold rebounds to the 3305-3310 area. Target: 3285-3270;If support breaks, the move may extend to 3250.
🔺 Long Position Strategy:
🔰Consider entering long positions in batches if gold pulls back to the 3245-3250 area. Target: 3265-3275;If resistance breaks, the move may extend to 3285.
🔥Trading Reminder: Trading strategies are time-sensitive, and market conditions can change rapidly. Please adjust your trading plan based on real-time market conditions. If you have any questions or need one-on-one guidance, feel free to contact me🤝
Community ideas
XAUUSD Possibility of a small correction towards 3330, re-entering the bearish phase and moving towards the specified targets

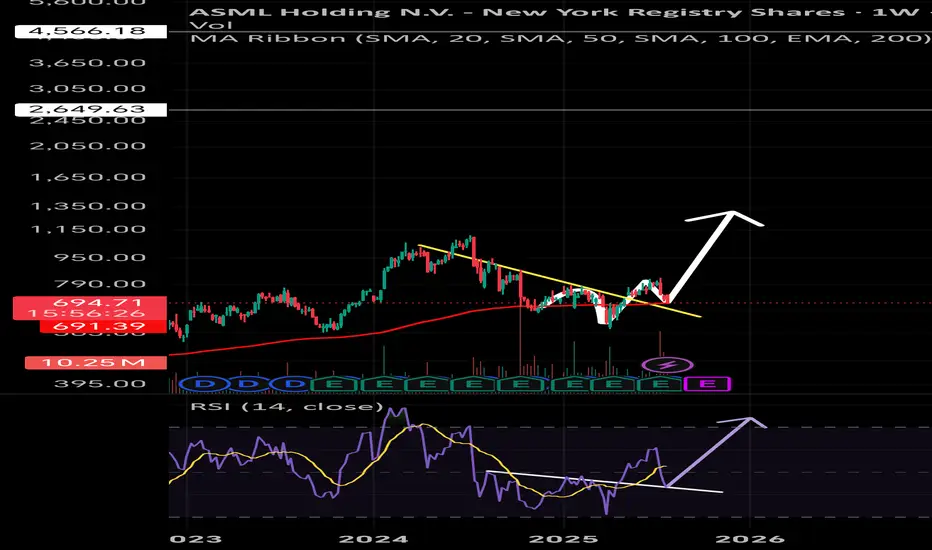
ASML : All inASML currently retesting the 200 weekly EMA support trendline.
Expecting ,Bullish trend reversal structure,
Ladt night already positioned heavily in this stock,
Pray this will play out as planned
😬🙏🙏😬

GBPJPY: Pullback From Resistance 🇬🇧🇯🇵
I think that GBPJPY will pull back from a wide
intraday supply area.
As a confirmation, I see a bearish imbalance candle that
is formed after its test.
Goal - 198.51
❤️Please, support my work with like, thank you!❤️
I am part of Trade Nation's Influencer program and receive a monthly fee for using their TradingView charts in my analysis.

Market Stuck in Limbo? XAGUSD Update & Likely Range AheadLet’s talk silver.
The market's clearly undecided — no real momentum, just hesitation.
We’re approaching overextended RSI levels, so don’t expect fireworks just yet.
Im Skeptic from Skeptic Lab and In this quick update, I’ll show you what I’m watching for both long and short triggers …
and why a range might dominate the next few days.
👉 Watch till the end to avoid getting trapped by fake breakouts.

ETHUSDT - FUTURES SIGNAL FUTURES SIGNAL
Coin: ETH
Direction: LONG
🟢Input range: market/3578
✔️ТР: 3726/3902
❌SL: 3501
We work from the order block zone, in which I expect a price reversal.

BTC Dominance and Altcoins SituationBitcoin dominance has reached a key support on the daily time frame. The NEW RSI indicator still sees the market as bearish but is pulling back. We will probably not see the growth of major altcoins like Ethereum for a few days. This analysis is not a financial recommendation in any way.

GOLD: Short Trading Opportunity
GOLD
- Classic bearish formation
- Our team expects fall
SUGGESTED TRADE:
Swing Trade
Sell GOLD
Entry Level - 3299.9
Sl - 3304.2
Tp - 3291.3
Our Risk - 1%
Start protection of your profits from lower levels
Disclosure: I am part of Trade Nation's Influencer program and receive a monthly fee for using their TradingView charts in my analysis.
❤️ Please, support our work with like & comment! ❤️

Gold Technical Outlook
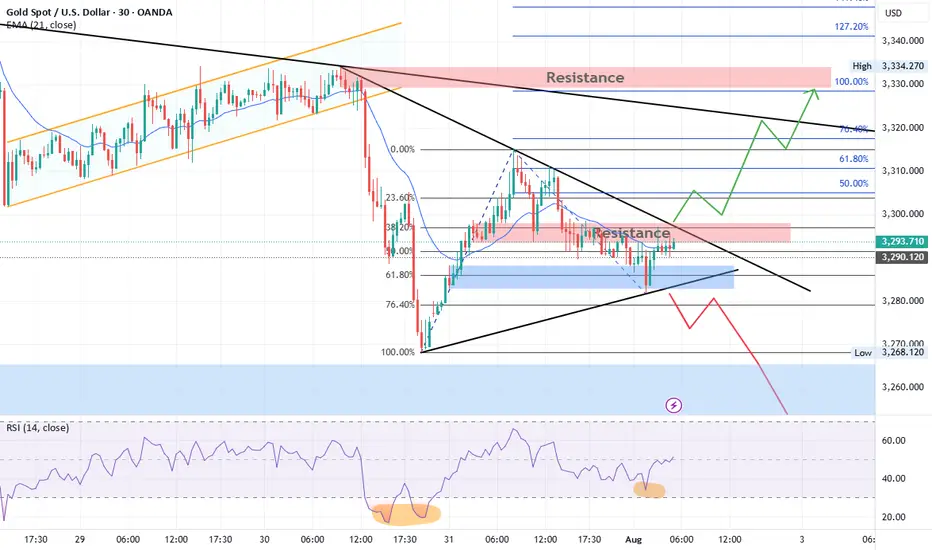
Gold is currently consolidating inside a triangle pattern. After a recent bullish rally, price retraced between the 61.8% – 76.4% Fibonacci levels, finding support and bouncing upward. At present, gold is facing resistance at both the falling trendline and the 3298–3300 zone.
Bullish Scenario:
A breakout above the resistance trendline and the 3298–3300 zone could trigger a strong bullish move toward 3311, 3322, and 3333. A sustained break above 3333 would confirm a short-term bullish trend, opening the way for higher targets at 3360 and 3400.
Bearish Scenario:
If price faces rejection from the 3300 resistance and the falling trendline, gold is expected to move lower, retesting 3270. A decisive break below 3270 may extend the decline toward 3250. If 3250 is broken, gold could enter strong bearish momentum, potentially shifting the long-term trend to the downside with targets at 3000 and 2850.
OANDA:XAUUSD Gold Technical Outlook
Gold (XAU/USD) Analysis:Gold remains in a downward trend and is currently moving sideways in a consolidation phase in the short term. The bearish outlook still dominates, with a potential move toward levels like $3,245.
1️⃣ A break and close below $3,276 may trigger a drop toward the strong support zone at $3,245.
2️⃣ However, if bullish momentum pushes the price above $3,310, this opens the path toward $3,330, a key level where a bearish rejection might occur.
📈 If the price holds above $3,330, a continuation toward $3,350 becomes likely.
⚠️ Disclaimer:
This analysis is not financial advice. It is recommended to monitor the markets and carefully analyze the data before making any investment decisions.

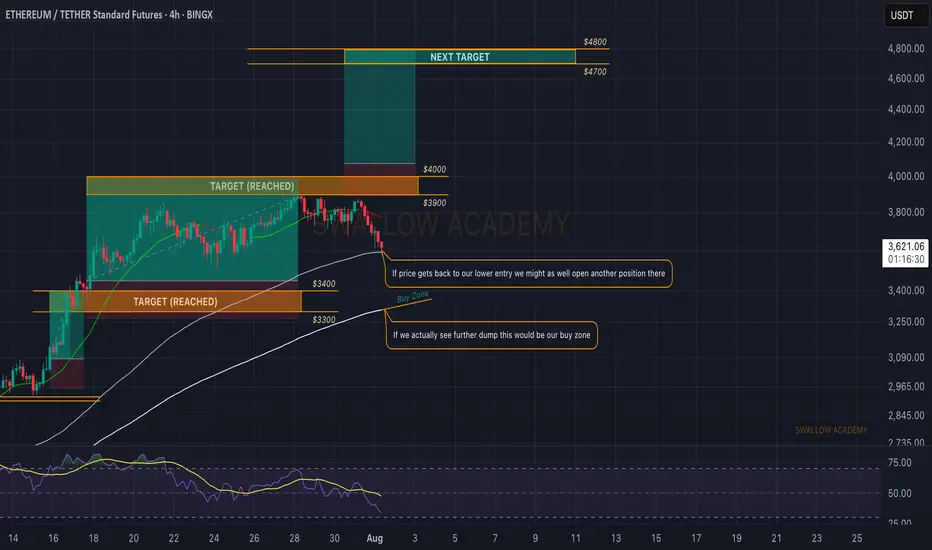
Ethereum (ETH): Bloody End of Week & Start of Month | We Wait!Well, we were close to breaking out of the $4000 area and now we are back on the lower side of the area, where sellers are showing strong pressure to coin.
As we approached the 100 EMA, we waited. Waiting is the worst part of trading, but that's what we do here. The 200 EMA is one key zone for us for another buying opportunity so if we keep on falling, that's the zone we are aiming for.
The second point of interest is the current 100 EMA, where if we see MSB to form, there might be a smaller scalp opportunity.
And last but not least, the zone above $4000.
Swallow Academy
Silver coiling price action support at 3600The Silver remains in a bullish trend, with recent price action showing signs of a continuation breakout within the broader uptrend.
Support Zone: 3600 – a key level from the previous consolidation. Price is currently testing or approaching this level.
A bullish rebound from 3600 would confirm ongoing upside momentum, with potential targets at:
3756 – initial resistance
3855 – psychological and structural level
3915 – extended resistance on the longer-term chart
Bearish Scenario:
A confirmed break and daily close below 3600 would weaken the bullish outlook and suggest deeper downside risk toward:
3544 – minor support
3480 – stronger support and potential demand zone
Outlook:
Bullish bias remains intact while the Silver holds above 3600. A sustained break below this level could shift momentum to the downside in the short term.
This communication is for informational purposes only and should not be viewed as any form of recommendation as to a particular course of action or as investment advice. It is not intended as an offer or solicitation for the purchase or sale of any financial instrument or as an official confirmation of any transaction. Opinions, estimates and assumptions expressed herein are made as of the date of this communication and are subject to change without notice. This communication has been prepared based upon information, including market prices, data and other information, believed to be reliable; however, Trade Nation does not warrant its completeness or accuracy. All market prices and market data contained in or attached to this communication are indicative and subject to change without notice.

gold 4ooo projectionHello, me thinks gold is ready for a midterm correction, which in turn can propel it to 4ooo. This is just an idea, not financial advice. Cheers

RUNE at the Brink: Rebound Opportunity or Breakdown Incoming?🧩 Overview:
RUNE/USDT is currently hovering at a critical support zone — a historical demand area that has triggered strong bullish rallies in the past. Positioned between $1.00–$1.30, this level has been a battle ground between buyers and sellers. The big question now: Will RUNE bounce for a bullish reversal or break down into deeper lows?
---
🔍 Key Levels Identified:
Major Support Zone (Demand Area): $1.00 – $1.30 (yellow box)
Immediate Resistance: $1.95 → $3.11 → $4.92
Extended Bullish Targets: $6.87 → $9.09 → $11.48 → $15.02
Deeper Bearish Targets (if support fails): $0.80 → $0.55 → $0.32
---
🟢 Bullish Scenario (Recovery Rally):
📌 Key Signal: Strong hold and price reaction above the $1.00–$1.30 zone.
1. Reversal Patterns: Look for double bottom, bullish engulfing, or strong weekly pin bars to signal a potential reversal.
2. Momentum Confirmation: A breakout above $1.95 with high volume could trigger a strong continuation to $3.11 and $4.92.
3. Macro Tailwinds: A broader recovery in Bitcoin and the crypto market could enhance bullish pressure on altcoins like RUNE.
🎯 Mid to Long-Term Bullish Targets:
$3.11 → $4.92 → $6.87+
Potential upside of 200–400%+ from current levels if bullish structure confirms.
---
🔴 Bearish Scenario (Breakdown):
📌 Critical Risk: Weekly candle close below $1.00 with volume confirmation.
1. Support Breakdown: If $1.00 fails, price may revisit previous lows around $0.80 or even test historical demand levels at $0.32.
2. Bearish Continuation Pattern: Sustained lower highs and lower lows suggest downtrend continuation unless invalidated.
3. Volume Pressure: Heavy sell volume on breakdowns reinforces bearish bias.
⚠️ Bearish Targets: $0.80 → $0.55 → $0.322 (historical low)
---
🔄 Pattern & Structure:
Historical Accumulation Zone: The yellow box has been a long-term accumulation area since 2021.
Repeat Behavior: Previous touches to this zone sparked multi-week rallies.
Potential Wyckoff Accumulation: If price forms a sideways range with rising lows, this may be the early stage of a markup phase.
---
🧠 Strategic Outlook for Traders:
✅ Bullish Strategy:
Conservative entry: Wait for breakout + retest of $1.95
Aggressive entry: Accumulate within $1.00–$1.30 zone with tight stop below $0.98
❌ Bearish Strategy:
Short setup on confirmed breakdown below $0.98
Avoid trading without confirmation of direction (no FOMO)
---
🚀 Conclusion:
RUNE is standing at a make-or-break level — a tipping point between a bullish breakout or further bearish pressure. Smart traders don't just predict direction; they prepare for both outcomes. This is not just a technical zone — it's the market’s decision point.
#RUNE #RUNEUSDT #CryptoAnalysis #AltcoinWatch #BreakoutSetup #DemandZone #TechnicalAnalysis #CryptoOutlook #BullishScenario #BearishScenario #Wyckoff

Lingrid | USDCHF Potential Bullish Move Following Level BreakoutFX:USDCHF surged from a higher low and is now retesting the broken structure near 0.802, maintaining its position within the broader upward channel. A clean bounce from this zone would confirm the bullish structure, targeting the upper channel resistance near 0.815. Pullback and higher low structure support continued upside movement with short-term consolidation possible. A breakout from the consolidation box could accelerate momentum toward the resistance area.
📈 Key Levels
Buy zone: 0.802 – 0.805
Buy trigger: Bullish confirmation above 0.805
Target: 0.815
Invalidation: Drop below 0.796
💡 Risks
False breakout near 0.805 may lead to rejection
Failure to form higher high would invalidate bullish sequence
Momentum divergence could slow rally near resistance
If this idea resonates with you or you have your own opinion, traders, hit the comments. I’m excited to read your thoughts!

BTCUSD – Bullish Recovery Setup Forming Near Trendline Support🧠 Market Structure & Technical Breakdown
The BTCUSD 4H chart showcases a well-formed descending triangle or falling wedge structure with clearly respected major and minor descending trendlines. Currently, price action is testing a dynamic support zone, highlighted in green, which has been a strong reaction area in the past.
This area aligns with a bullish accumulation zone, from which buyers have previously stepped in to initiate impulsive moves. Given the confluence of diagonal support and horizontal price reactions, we may be on the verge of a bullish breakout opportunity.
📍 Key Zones & Trendlines
✅ Green Support Channel (Demand Zone): Acting as a key pivot for multiple recent rejections, this area (~114,000–113,000) is now being revisited again, offering potential buy interest.
📉 Minor Trendline: A short-term descending resistance around 120,000—likely the first barrier in case of a bounce.
📉 Major Trendline: A more extended dynamic resistance line connecting swing highs, currently intersecting near the 124,000 region.
🔄 Potential Price Scenarios
Primary Bullish Setup (MMC Plan):
Price bounces off the green demand zone.
Breaks above the minor trendline (~120K).
Pullback retest to confirm breakout.
Continuation toward the major breakout level (~124K and beyond).
Invalidation / Bearish Case:
A clean breakdown below 113,000 with strong bearish momentum would negate this setup, likely targeting the psychological support near 110,000.
🧠 MMC Mindset: Trade with Patience & Confluence
This is a classic accumulation-to-breakout scenario. Smart traders wait for confirmation—especially as BTC often exhibits false breakdowns before a major move. Monitor candle behavior, volume, and reaction to the minor trendline.
Let the market show signs of strength (like bullish engulfing, pin bars, or a breakout-retest) before committing to the upside. Avoid FOMO; the key is discipline and precision entry at structural break points.
✅ Trade Plan Summary:
Watch zone: 113,000–114,500 for bullish price action
Breakout level: Minor trendline (~120,000)
Target zone: 123,500–124,000 (Major resistance)
Stop-loss idea: Below 112,800 (Invalidation of structure)

Price Doing Exactly What We Predicted… so farGBPUSD tapped the exact bottom of our marked channel and bounced — just as forecasted.
📌 Price respected structure to the pip
📌 Stoch RSI curling up right as expected
📌 Channel still in play, eyes on midline next
⏱️ Timeframe: 1H
#gbpusd #forex #chartprediction #backtest #channeltrading #technicalanalysis #tradingview

BITCOIN's Situation (1h) !!!The price is within an ascending triangle, which could be encouraging. However, since crypto doesn't always follow patterns, it might break down from below and correct to around $116K!
Best regards CobraVanguard.💚

USDCAD SELLUSD/CAD rallies further, approaches 1.3900 on higher levies to Canada
The US Dollar keeps marching higher, as the Canadian Dollar struggles after Trump decided to increase tariffs to Canada to 35% from the previous 25%, escalating the trading tension with one of its main trading partners. The US President justified his decision on Canada’s alleged reluctance to cooperate on curbing the traffic of fentanyl and other drugs across the US border
The year will be politically marked by Trump’s return to the White House. A Republican government is seen as positive for financial markets, but Trump’s pledge to cut taxes and impose tariffs on foreign goods and services may introduce uncertainty to both the political and economic landscape.
Canada’s political crisis peaked in late 2024 with a no-confidence vote against Prime Minister Justin Trudeau, leading to snap elections and a weakened Liberal minority government. Policy uncertainty and economic challenges dominate 2025’s outlook, raising concerns over market stability and investor confidence.
The BoC is set to continue easing interest rates through 2025, at least at a faster pace than the Fed is expected to, which could apply pressure on CAD’s already-rising rate differential.
SUPPORT 1.38444
SUPPORT 1.38039
SUPPORT 1.37621
RESISTANCE 1.38889
RESISTANCE 1.39049

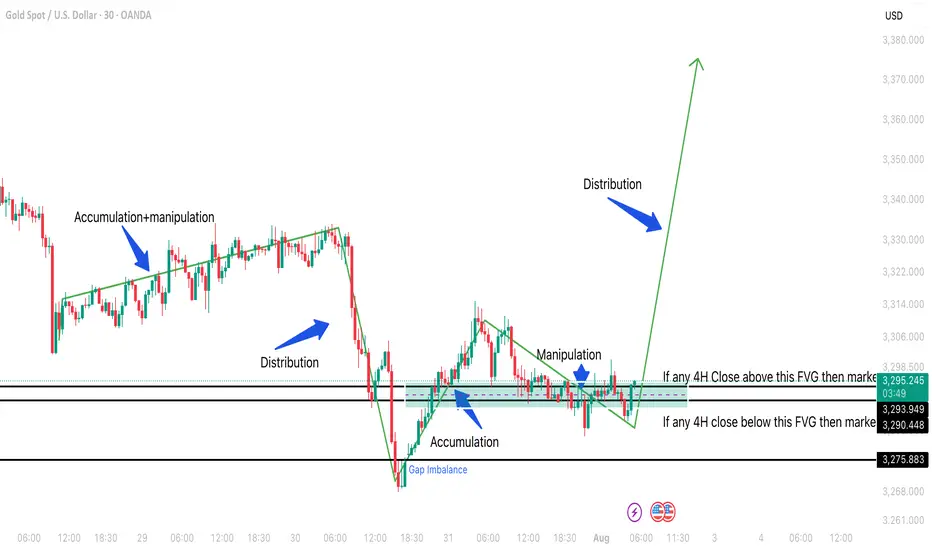
GOLD NON FARM ANALYSISAs you can see market is moving round and round inside bullish FVG from thursday night 31 july and making sell side liquidity which is till 3382 so possible move can be an expansion which will be bullish.4H bullish FVG indicates that market does not wants to go down.
Monthly $MSTR Bullflag MicroStrategy is forming a textbook bull flag on the monthly, right after a massive vertical leg from sub-$200 to over $500.
Strong pole ✅
Tight consolidation near the highs ✅
Monthly closes holding above prior resistance ✅
This thing is coiling under ~$455. Once it breaks, it could easily send toward $800–1000+, especially if CRYPTOCAP:BTC keeps surging. BTC already confirmed a major cup & handle — MSTR just lagging a bit.
High timeframe structure + BTC correlation = explosive potential.
Watching for volume + breakout confirmation. Let’s see if it rips.

Fibonacci Retrace Strategy NAS100 Trade Idea📈 NASDAQ 100 (NAS100) is holding a strong bullish trend 🚀. After a weekend gap-up 🕳️➡️📈, price retraced back into the gap zone—exactly what you'd expect in a healthy trending market.
🔍 I'm applying my Fibonacci Expansion + Retrace Strategy 🔢, watching closely for a pullback into equilibrium ⚖️ within the previous price swing. That’s where I’ll be waiting for a bullish market structure break 🔓📊 to confirm my long bias.
🧠 Patience is key here—let the setup come to you.
📌 As always, this is not financial advice!
