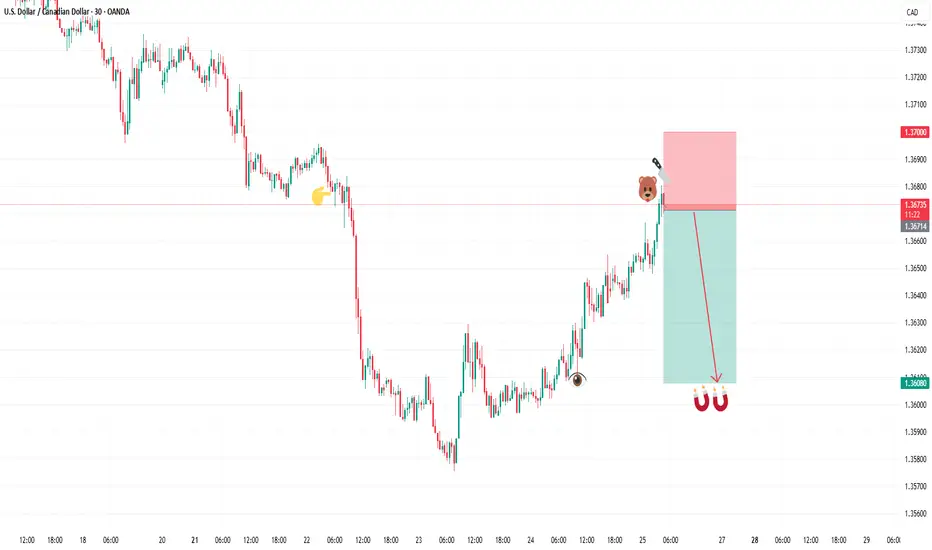
SELL USDCADIn todays session we are monitoring USDCAD for selling opportunities, we have our first entry at 1.36719 and our target is 1.36080 our stop is above 1.3700 , use proper risk management and risk what you can afford. Cheers fam.
Community ideas

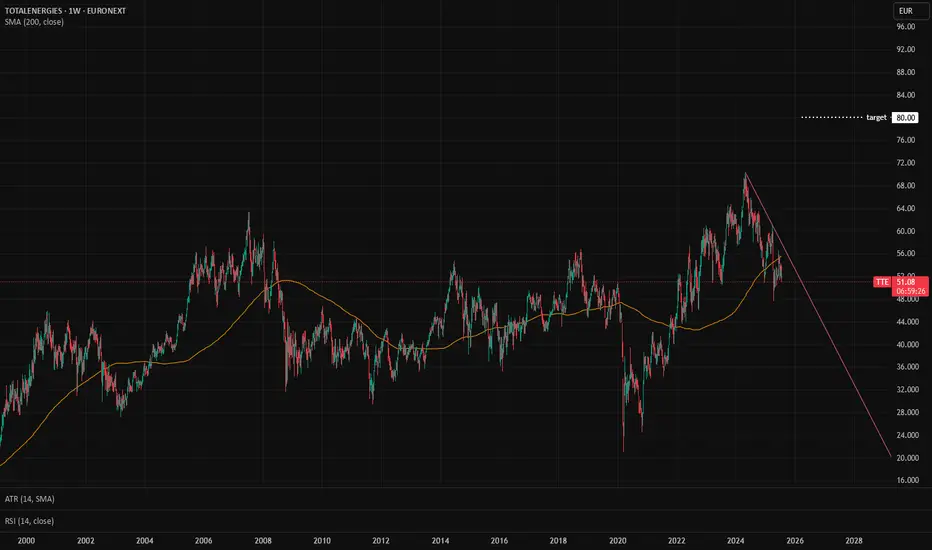
TTE: Fundamental Analysis +56 %With 2024 revenue of 195,6 billions €, Total Energies ranks among the top 10 largest energy companies in the world. EverStock identifies a fundamental revaluation potential of + 56 %.
Valuation at 7.3x net earnings
Currently valued at 115,7 billions € in market capitalization, Total Energies posted a profit of 15,76 billions € in its latest fiscal year (2024).
Balance sheet and debt
In Total Energies annual report, tangible net asset value stood at 83,62 billions €, giving a market capitalization / tangible net asset value ratio of 1.38.
The gearing ratio is good, at 0.44. (Total financial debt / net tangible assets valuation)
Current share price : 51.46 €
Target price : 80,12 €
Upside potential : +56 %
Dividend : 3.30 € (per year)
Yield : 6.41 %
The Day AheadFriday, July 25 – Financial Market Summary (Trading Focus)
Key Data Releases:
US
June Durable Goods Orders: A leading indicator of manufacturing activity. Strong growth may boost USD and treasury yields; weak numbers could fuel rate-cut bets.
July Kansas City Fed Services Activity: Gauges regional service sector performance, often a directional cue for sentiment in broader Fed outlook.
UK
July GfK Consumer Confidence: Measures household sentiment. A decline may pressure GBP as it hints at cautious spending.
June Retail Sales: A key gauge of consumer demand. Surprises could move GBP sharply, especially amid BoE rate-cut speculation.
Japan
July Tokyo CPI: A leading inflation gauge ahead of the national print. Hotter data may raise doubts about BoJ’s ultra-loose stance.
June Services PPI: Measures business input costs; could signal future CPI pressure.
Eurozone
Germany July Ifo Survey: Monitors German business sentiment. Markets use this as a proxy for Eurozone economic health. Weakness can weigh on EUR and Bunds.
France/Italy Confidence Surveys: Consumer and manufacturing sentiment—important for pricing growth expectations across the bloc.
June M3 Money Supply: Closely watched by ECB for inflation outlook.
Central Bank:
ECB Survey of Professional Forecasters: Key for insight into market inflation expectations, growth, and rate paths—could shift EUR and European yields.
Earnings – Market Movers:
HCA Healthcare: Strong US economic bellwether; watch for comments on consumer healthcare trends.
Charter Communications: Cable/streaming sector in focus—guidance may affect tech/media sentiment.
Volkswagen: Global auto demand barometer—insight into EV strategy, China exposure.
NatWest: UK-focused bank—comments on credit conditions and loan demand will influence GBP and FTSE sentiment.
Eni: Energy major—production guidance, commodity price outlooks will move oil-sensitive equities and possibly EUR.
Trading Implications:
Focus on US durable goods for risk-on/risk-off bias.
Eurozone sentiment and ECB inflation forecasts could reset EUR expectations.
UK data dump will be crucial for GBP direction amid BoE policy divergence.
Earnings from global cyclicals (Volkswagen, Eni) and banks (NatWest) may sway sectoral rotation.
This communication is for informational purposes only and should not be viewed as any form of recommendation as to a particular course of action or as investment advice. It is not intended as an offer or solicitation for the purchase or sale of any financial instrument or as an official confirmation of any transaction. Opinions, estimates and assumptions expressed herein are made as of the date of this communication and are subject to change without notice. This communication has been prepared based upon information, including market prices, data and other information, believed to be reliable; however, Trade Nation does not warrant its completeness or accuracy. All market prices and market data contained in or attached to this communication are indicative and subject to change without notice.
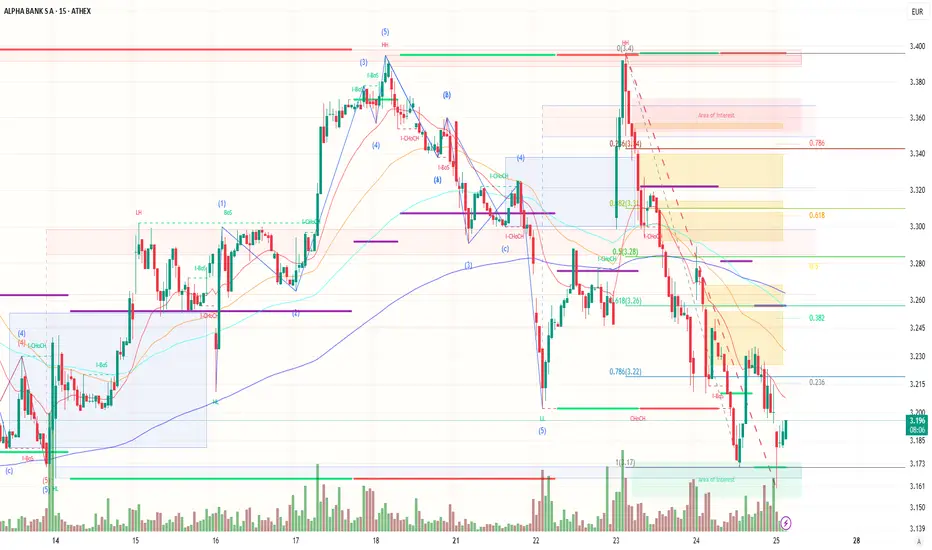
UniCredit: One Step Away from 30% in Alpha Bankhe relationship between UniCredit and Alpha Bank is reaching a turning point, as all indications suggest the Italian banking giant is accelerating its push to acquire more than 30% of the Greek systemic lender. If confirmed, the move would not only make UniCredit the dominant shareholder but also allow it to fully consolidate Alpha’s earnings under IFRS standards.
After acquiring the stake held by Dutch investor Rob Holterman, UniCredit brought its holding close to 20%. Following stalled merger talks with Germany’s Commerzbank and Italy’s Banco BPM, attention has now firmly shifted to Greece. Athens is becoming a strategic hub, and Alpha Bank the key growth vehicle.
The timing aligns with UniCredit’s record Q2 2025 profits (+25%), supported by strong liquidity and capital. Behind-the-scenes efforts are reportedly underway, potentially involving secondary market purchases or private deals with current shareholders.
Technical Analysis
Alpha Bank’s stock (ATHEX: ALPHA) trades at €3.186, currently in a corrective phase after completing a strong five-wave bullish cycle peaking at €3.384. A clear A-B-C retracement has followed, with support emerging near €3.17, confirmed by high-volume buying. The stock faces key resistances at €3.245 and €3.28 (Fibonacci 0.382 & 0.5 levels), which it must reclaim to reverse the short-term downtrend. Failing that, a break below €3.17 could trigger further downside. Market structure shifts (CHoCH, BoS) suggest high sensitivity to any new buying pressure. Investor sentiment around UniCredit’s strategic intentions may be the catalyst for the next major move.
Gold. Trade Swing buy setup 25/July/25XAUUSD "erased" all its early weekly gain by having deep pullback until its weekly pivot and channel support confluence zone again..

GBPAUD breakdown targets 2.00GBPAUD broke below key triangle support, confirming a bearish pattern with a target near 2.00. A failed retest strengthens the case for further downside. Bounces toward 2.06 may face selling pressure. Reward-to-risk remains attractive around 2.55x.
This content is not directed to residents of the EU or UK. Any opinions, news, research, analyses, prices or other information contained on this website is provided as general market commentary and does not constitute investment advice. ThinkMarkets will not accept liability for any loss or damage including, without limitation, to any loss of profit which may arise directly or indirectly from use of or reliance on such information.

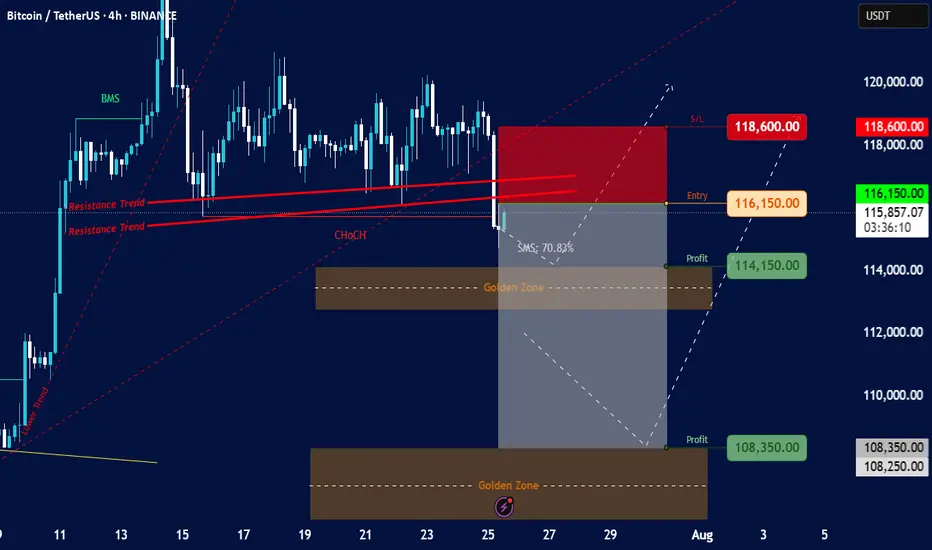
Bitcoin/TetherUS (BTC/USDT) on a 4-hour timeframeOverall Trend & Price Action:
Prior Uptrend: The chart shows a clear uptrend leading up to around July 15th, marked by an "Order Trend" line (dashed green).
Break of Market Structure (BMS): A "BMS" (Break of Market Structure) label is visible, suggesting a significant shift in market dynamics, likely indicating the end of the previous uptrend or a strong pullback.
Consolidation/Distribution: After the initial uptrend, the price appears to have entered a period of consolidation or potential distribution between approximately $115,000 and $120,000.
Resistance Trends: Several "Resistance Trend" lines (red) are drawn, indicating areas where the price has faced selling pressure. A recent breakdown below these resistance lines is evident.
Change of Character (ChoCH): A "ChoCH" label is present, which often signifies a change in the prevailing market sentiment or trend, confirming the shift away from the strong bullish momentum.
Current Price & Trading Setup:
Current Price: The current price is around $115,849.44.
Proposed Entry: The chart suggests an "Entry" point at $116,150.00. This is positioned just above the current price and within a potential retest zone of the broken resistance.
Stop Loss (S/L): The "S/L" is set at $118,600.00, indicating a risk management level if the trade goes against the intended direction.
Profit Targets (Profit):
First Profit Target: $114,150.00, located just above the first "Golden Zone."
Second Profit Target: $108,350.00, situated within the second "Golden Zone."
Golden Zones: Two "Golden Zones" (brown shaded areas) are identified, which are typically areas of significant support/demand or Fibonacci retracement levels where price is expected to react. The current setup seems to target these zones for profit-taking.
SMS: 70.83%: This "SMS" value (likely referring to "Smart Money Score" or a similar metric) of 70.83% suggests a strong bearish bias or conviction in the current setup.
Interpretation & Potential Strategy:
The analysis suggests a bearish trading setup for BTC/USDT.
The presence of BMS, ChoCH, and the breakdown below resistance trends indicate a potential shift from bullish to bearish sentiment or a significant correction.
The proposed short entry at $116,150.00 aims to capitalize on further downward movement.
The profit targets align with identified "Golden Zones," suggesting that these are anticipated areas of support where the bearish momentum might temporarily stall or reverse.
The significant "SMS" value reinforces the bearish outlook.
Risks & Considerations:
Reversal from Golden Zones: While profit targets are set at Golden Zones, these are also potential areas for price reversals if strong buying interest emerges.
False Breakout/Breakdown: The market can always surprise, and a re-entry above the stop-loss level would invalidate the current bearish setup.
Market Volatility: Cryptocurrency markets are highly volatile, and rapid price movements can occur.
News Events: Unforeseen news or macroeconomic events could significantly impact price action.
BUY USDJPYThe price drop on UJ has been wild however price is at a good support zone, we see the ABCD pattern by way of a bullish Fibonacci invasion setup hoping it will give good liquidity. Buy wisely.

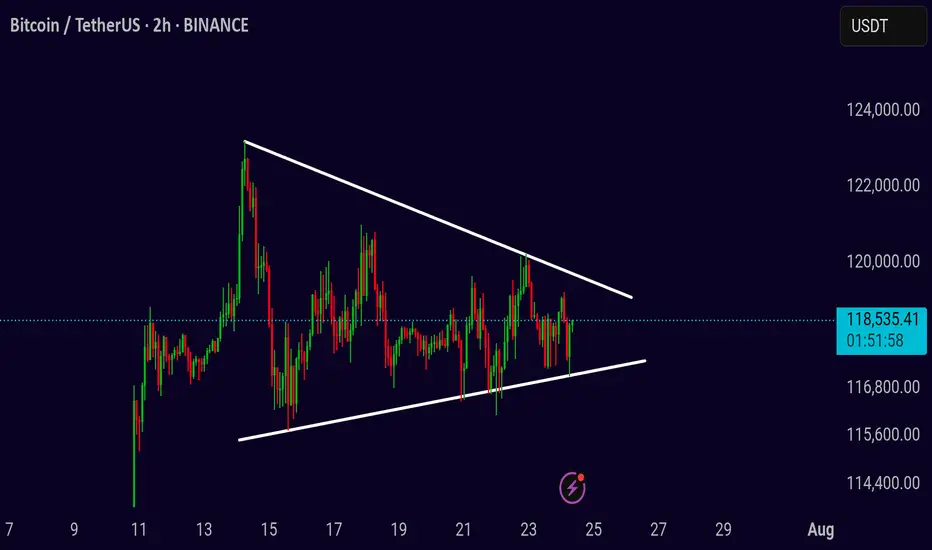
BTC Symmetrical Triangle – Decision Time Soon
BTCUSDT Idea (2H Chart)
BTC is consolidating inside a symmetrical triangle, creating pressure for a breakout. Price is currently ranging between 116K–120K, with volatility compressing.
Patience is key here — don’t rush entries.
A confirmed breakout or breakdown will give the real direction.
Break above the triangle = bullish continuation
Break below = further correction ahead
Wait for 2H close outside the pattern with volume
Watch levels:
* Upside: 120K → 124K → 128K
* Downside: 116K → 112K → 108K
Setup is maturing — breakout is just a matter of time. Let the chart lead, not emotions.
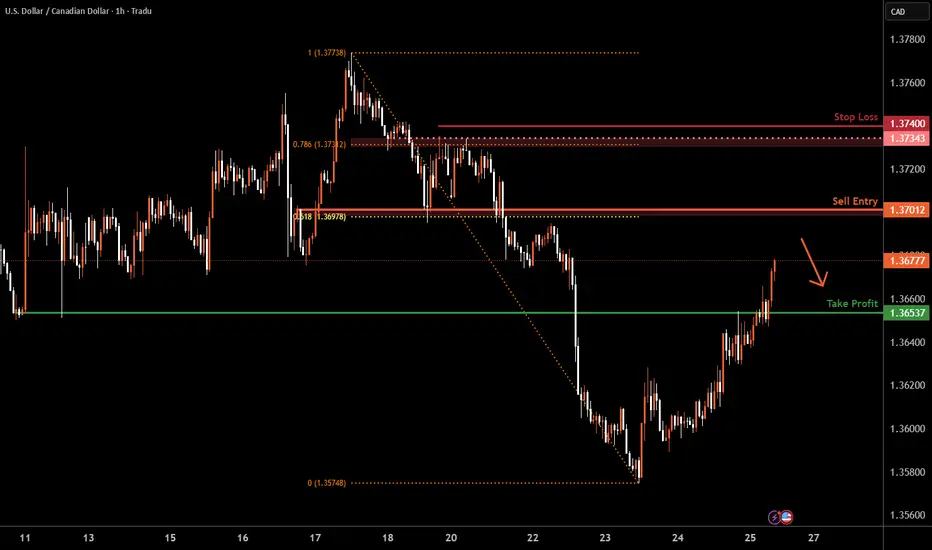
USD/CAD H4 | Potential bearish reversalUSD/CAD is rising towards an overlap resistance and could potentially reverse off this level to drop lower.
Sell entry is at 1.3701 which is an overlap resistance that aligns with the 61.8% Fibonacci retracement.
Stop loss is at 1.3740 which is a level that sits above the 78.6% Fibonacci retracement and an overlap resistance.
Take profit is at 1.3653 which is a pullback support.
High Risk Investment Warning
Trading Forex/CFDs on margin carries a high level of risk and may not be suitable for all investors. Leverage can work against you.
Stratos Markets Limited (tradu.com ):
CFDs are complex instruments and come with a high risk of losing money rapidly due to leverage. 66% of retail investor accounts lose money when trading CFDs with this provider. You should consider whether you understand how CFDs work and whether you can afford to take the high risk of losing your money.
Stratos Europe Ltd (tradu.com ):
CFDs are complex instruments and come with a high risk of losing money rapidly due to leverage. 66% of retail investor accounts lose money when trading CFDs with this provider. You should consider whether you understand how CFDs work and whether you can afford to take the high risk of losing your money.
Stratos Global LLC (tradu.com ):
Losses can exceed deposits.
Please be advised that the information presented on TradingView is provided to Tradu (‘Company’, ‘we’) by a third-party provider (‘TFA Global Pte Ltd’). Please be reminded that you are solely responsible for the trading decisions on your account. There is a very high degree of risk involved in trading. Any information and/or content is intended entirely for research, educational and informational purposes only and does not constitute investment or consultation advice or investment strategy. The information is not tailored to the investment needs of any specific person and therefore does not involve a consideration of any of the investment objectives, financial situation or needs of any viewer that may receive it. Kindly also note that past performance is not a reliable indicator of future results. Actual results may differ materially from those anticipated in forward-looking or past performance statements. We assume no liability as to the accuracy or completeness of any of the information and/or content provided herein and the Company cannot be held responsible for any omission, mistake nor for any loss or damage including without limitation to any loss of profit which may arise from reliance on any information supplied by TFA Global Pte Ltd.
The speaker(s) is neither an employee, agent nor representative of Tradu and is therefore acting independently. The opinions given are their own, constitute general market commentary, and do not constitute the opinion or advice of Tradu or any form of personal or investment advice. Tradu neither endorses nor guarantees offerings of third-party speakers, nor is Tradu responsible for the content, veracity or opinions of third-party speakers, presenters or participants.
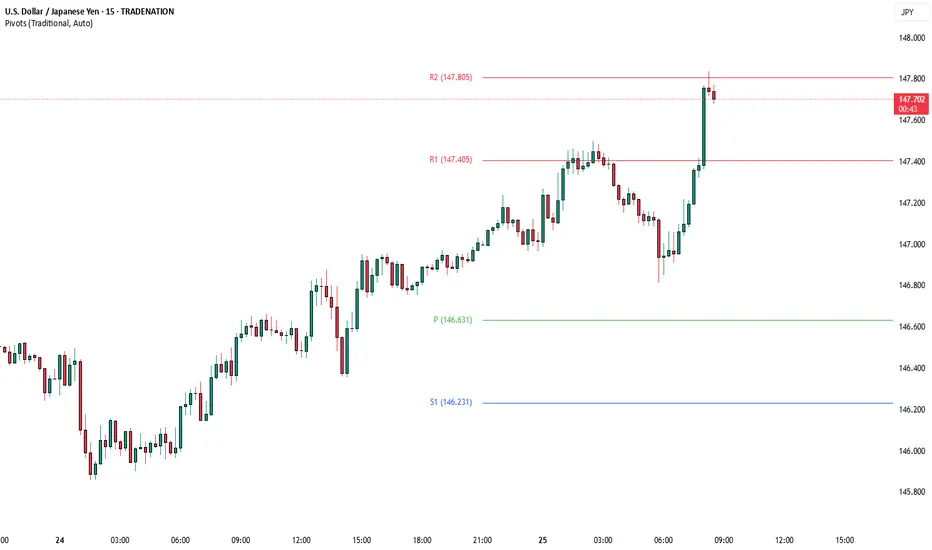
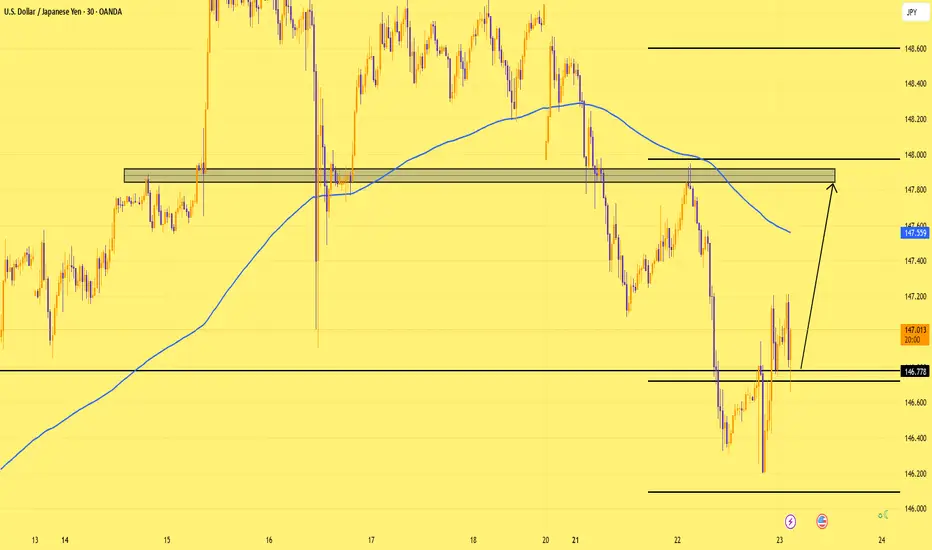
USDJPY: Back to the Shelf Before Lift-Off?Price might drop a little at the open, but I don’t expect it to go far.
Support is around 146.77—if it holds, we could see a move back up toward 147.80.
Gold short opportunityGold completed its mini bull flag target and re-entered a micro rising channel, a potentially bearish structure.
With price now testing a key supply zone, we’re watching for rejection to initiate a short, targeting the major demand zone below.

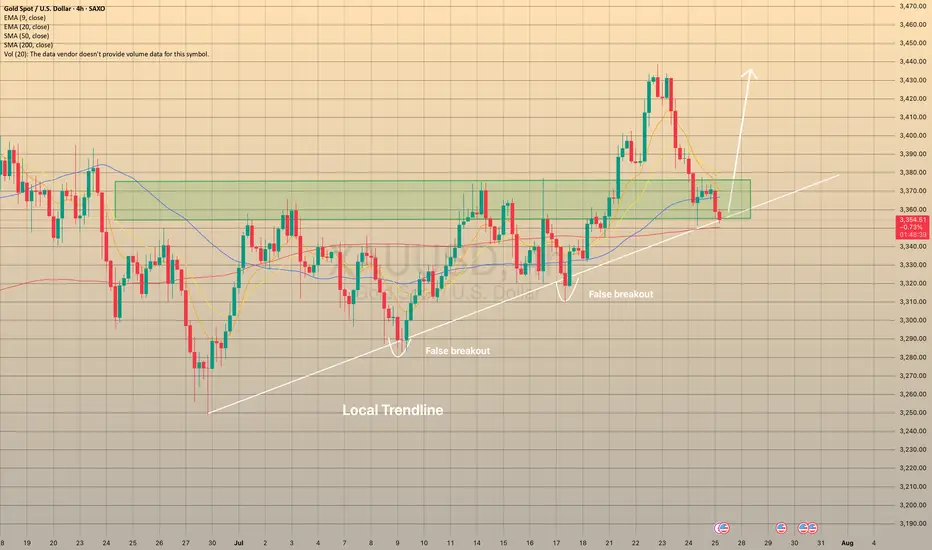
XAUUSD REACHED THE LOCAL TRENDLINEXAUUSD REACHED THE LOCAL TRENDLINE
On July 24 the U.S. Manufacturing PMI report came out way below forecasted (49.5 actual vs 52.6 forecasted). A number below 50 causes concerns among investors and could be a sign of an overall economic slowdown or recession. So, as a result, it could lead to an increase in demand for safe assets like gold.
However, today the price, despite the recent rebound from the trendline after report, came to the trendline once again. There is a high possibility that the price will rebound in nearest future: besides the local trendline we may observe the sma200 on 4-h chart. Additionally, we entered the price zone of 3,350.00-3,375.00, which used to be a resistance zone, now may play out as a support. In case of rebound, the price may go to local highs of 3,440.00 at least.
Is the DXY finally changing its trend?It seems that the DXY is showing a tendency to change its trend, but we have to see whether the sellers will allow it or not.


NZDUSD: Free Trading Signal
NZDUSD
- Classic bullish setup
- Our team expects bullish continuation
SUGGESTED TRADE:
Swing Trade
Long NZDUSD
Entry Point - 0.6013
Stop Loss - 0.6004
Take Profit - 0.6028
Our Risk - 1%
Start protection of your profits from lower levels
Disclosure: I am part of Trade Nation's Influencer program and receive a monthly fee for using their TradingView charts in my analysis.
❤️ Please, support our work with like & comment! ❤️

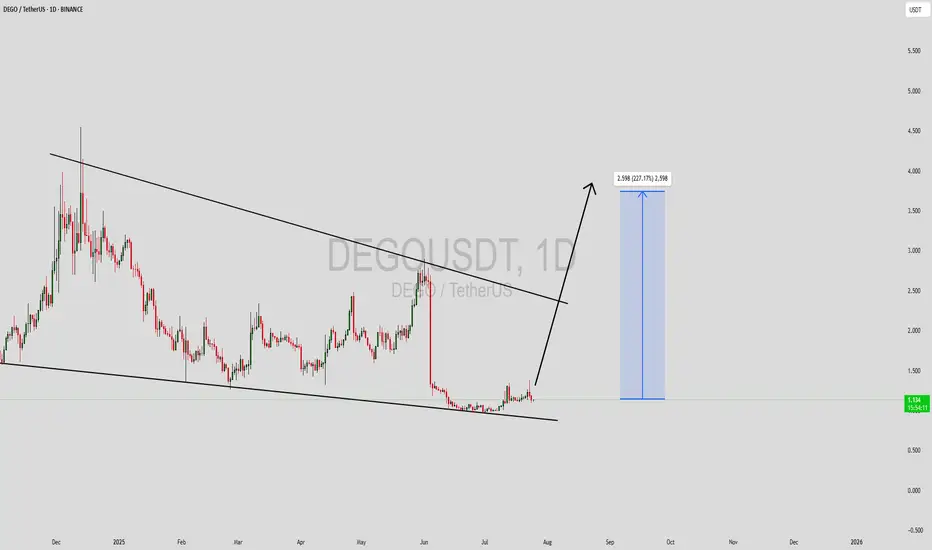
DEGOUSDT Forming Descending ChannelDEGOUSDT is currently showing signs of a strong bullish reversal setup after forming a well-defined descending channel pattern on the daily timeframe. Historically, descending channels are seen as bullish continuation or reversal patterns when price breaks above the upper trendline with increased volume. At present, DEGO appears to be nearing a breakout zone, accompanied by healthy volume, which may signal the start of a major upward move. The technical projection estimates a potential gain of 240% to 250%+, making this setup attractive for swing and position traders.
The increasing investor interest in DEGO Finance is another factor supporting the bullish outlook. As a DeFi and NFT infrastructure protocol, DEGO has maintained relevance even in volatile market phases. The combination of strong fundamentals and technical confirmation from a descending channel breakout could serve as a catalyst for an explosive price surge. Traders should keep an eye on confirmed daily closes above the resistance line and volume spikes for potential entry opportunities.
From a risk-reward perspective, DEGOUSDT offers an asymmetric setup, with the current price trading near the lower range of its historical levels. If the momentum continues and buyers step in with strength, the target range marked by the channel breakout could be hit quickly. Always watch for confirmation signals like retest support and bullish candle formations before entry to manage trade exposure effectively.
This setup is ideal for those who track high-volatility breakout patterns and understand how volume signals can lead to explosive rallies. DEGO is worth watching closely over the next few sessions, especially if market sentiment across the DeFi sector strengthens.
✅ Show your support by hitting the like button and
✅ Leaving a comment below! (What is You opinion about this Coin)
Your feedback and engagement keep me inspired to share more insightful market analysis with you!
Gold at Key Support – Will Bulls Step In or Drop Continue?🌐 Market Overview
Gold has struggled to recover after yesterday's sharp drop, driven by macro-political concerns and profit-taking at recent highs.
🔻 On July 24, former President Trump made an unexpected visit to the US Federal Reserve, sparking speculation that he's pressuring the Fed to cut interest rates soon.
While the Fed has yet to make any dovish moves, short-term bond yields dipped slightly, showing growing market expectations for policy easing.
The US dollar remains strong, reflecting some skepticism around the Fed’s possible shift despite recent economic strength.
📉 Technical Outlook
On the H2 chart, gold still maintains an overall bullish structure. However, it's approaching a critical support level near 3338, which aligns with the VPOC and the ascending trendline.
📌 If this zone breaks, price may rapidly fall toward deeper liquidity zones in the 332x – 329x range.
🎯 Trade Setups
🔽 BUY SCALP (Quick Reaction Play)
Entry: 3338 – 3336
Stop Loss: 3332
Take Profit: 3342 – 3346 – 3350 – 3354 – 3360 – 3365 – 3370 – 3380
🟢 BUY ZONE (Deep Buy Area – Long-Term Potential)
Entry: 3312 – 3310
Stop Loss: 3305
Take Profit: 3316 – 3320 – 3325 – 3330 – 3340 – 3350 – 3360 – 3370 – 3380
🔻 SELL ZONE (if market retests)
Entry: 3374 – 3376
Stop Loss: 3380
Take Profit: 3370 – 3366 – 3360 – 3355 – 3350 – 3340 – 3330
🔍 Key Levels to Watch
Support: 3350 – 3338 – 3325 – 3310 – 3294
Resistance: 3374 – 3390 – 3400 – 3421
⚠️ Risk Note
As we head into the weekend, liquidity sweeps are common – especially on Fridays. Be cautious of sharp moves.
Focus mainly on scalp setups today. Avoid early long entries unless strong confirmation appears at lower liquidity zones.
Always follow your TP/SL strategy to protect your capital.

DeGRAM | EURGBP exited the channel📊 Technical Analysis
● Fresh rejection at the blue resistance line (~3 435) pushed XAU back to the 3 355 mid-band, yet successive higher-lows (green arrows) keep price inside the May-origin rising channel.
● The pullback is probing 3 328-3 355 — confluence of the former flag roof and triangle top; holding this zone should launch another test of 3 400/3 435, with the channel crest targeting 3 500.
💡 Fundamental Analysis
● U-S S&P-Global PMIs softened, nudging 2-yr real yields to three-week lows, while cautious ECB rhetoric limits dollar gains — both supportive for gold.
✨ Summary
Long 3 328-3 355; above that aims 3 400 ➜ 3 435, stretch 3 500. Invalidate on an H4 close below 3 293.
-------------------
Share your opinion in the comments and support the idea with like. Thanks for your support!

gold bearishgold has not respected any support ony to H4 3351.
will it make its way up from here. only candle stick reaction to tell us.
however the safest trade for today to end the week is shorts.

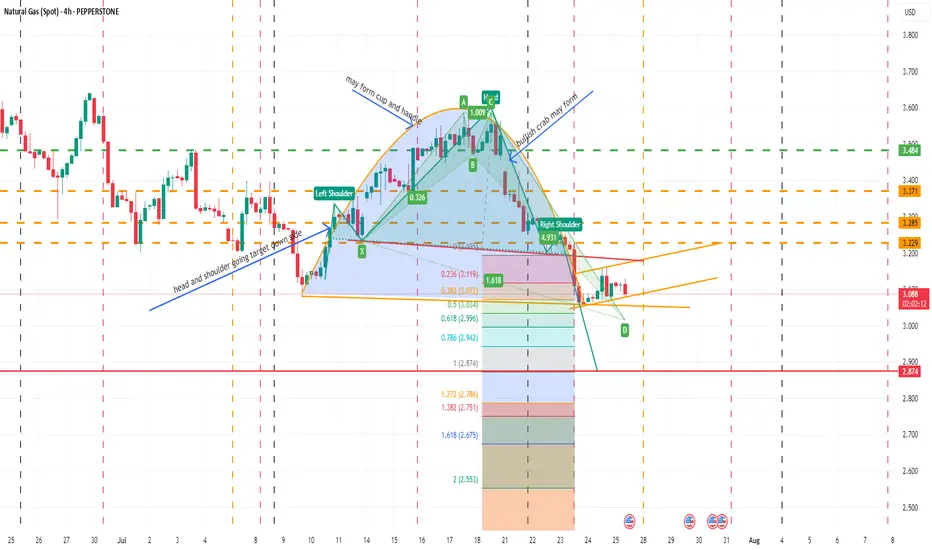
NATURAL GAS SPOTMay form inverse cup and handle, bullish crab also about to form , after completing one head and shoulder pattern already posted earlier new head and shoulder going on. In daily and 4 hr chart below ichimoku cloud. In weekly within cloud. Moving averages showing weakness in daily and weekly, monthly candle also no bearish. May be in such scenario bullish crab pattern may fail but need to be careful as over sold territory. Let see how all works in future though so far all as per analysis. I am not SEBI registered analyst.
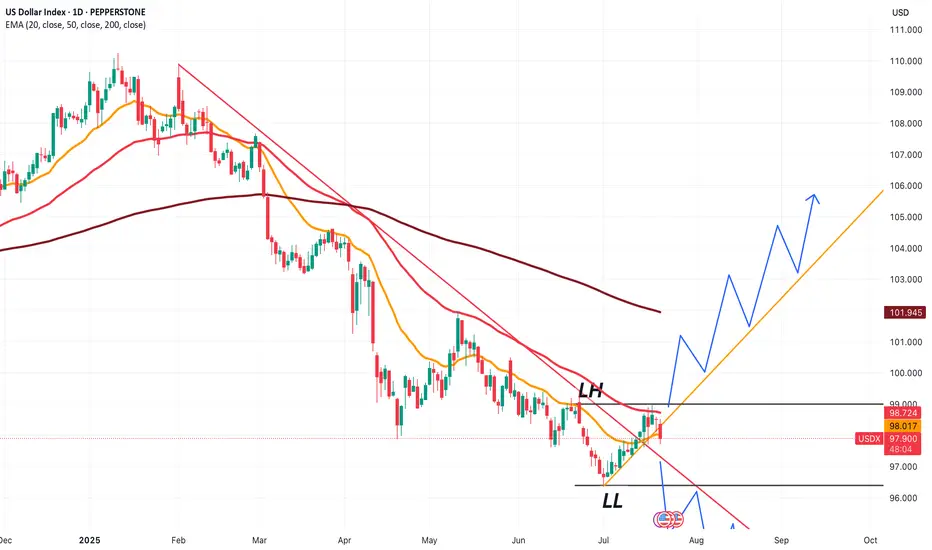
USDX at a crucial price point, which will decide trendThe next few candles for USDX price will be extremely important to understand where the dollar index is headed.
Based on that, we'll be able to choose 'which' Forex pairs we can trade, and more importantly 'how' we can trade them.
If price starts to follow the green line, and takes out 99.000, we'll be in an uptrend.
If price goes back to the red line and eventually goes below 96.400, we'll be in a downtrend.
Hopefully price won't consolidate too much, and trend in a particular direction.