Community ideas

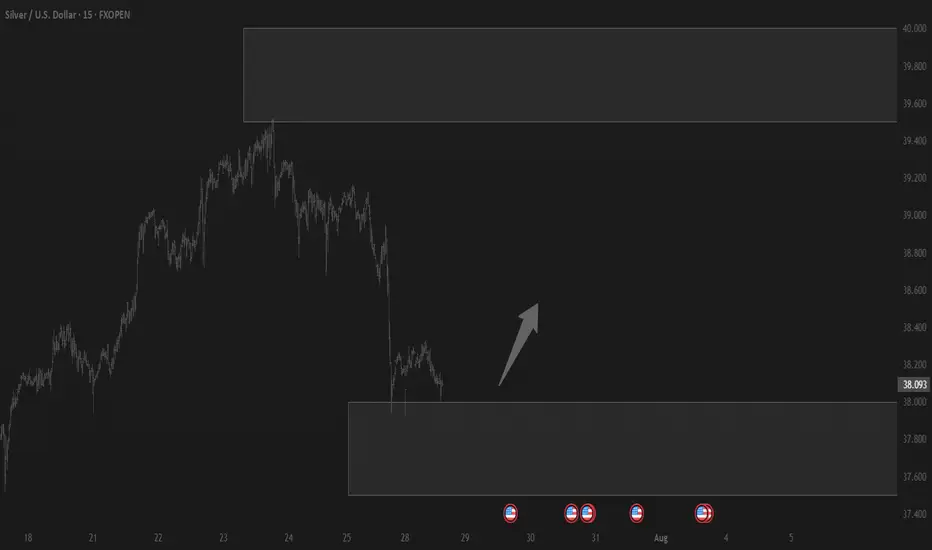
Trading balanceTrading balance The price of the asset has rebounded from the balance zone. With the prospect of growth into the resistance zone.
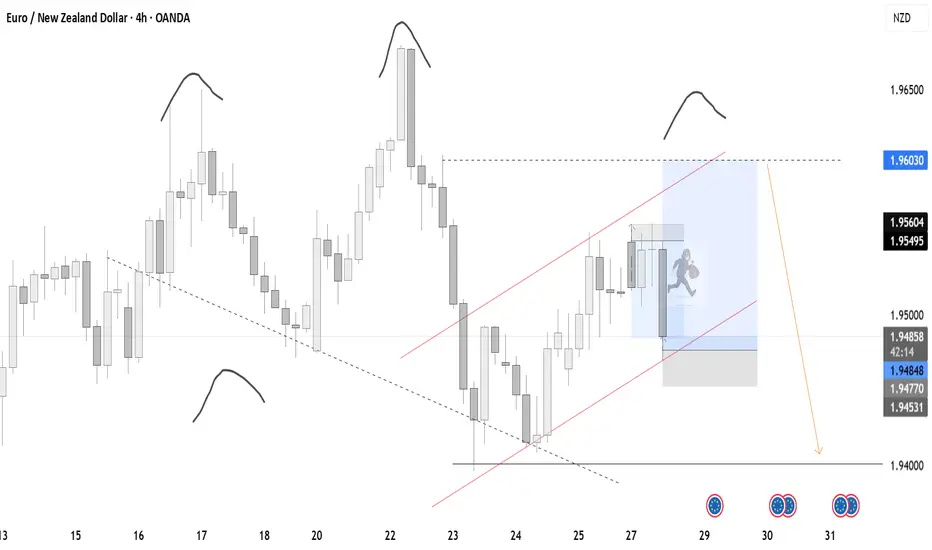
Buy EURNZDEURNZD Monday trade idea. Price is forming a bearish flag pattern. Should the demand trend line hold, price may climb back up to the resistance before completing the pattern.
BTC #This 15-minute BTC/USD chart This 15-minute BTC/USD chart shows a rising channel formation that has recently been broken to the downside, indicating potential bearish momentum. The price is currently testing a long-term ascending trendline, acting as a critical support zone around $118,600–$118,800. A breakdown below this trendline could lead to further downside, while a bounce could suggest bullish continuation. The curved arc drawn also hints at a rounding top pattern, reinforcing possible short-term weakness.

Gold Analysis and Trading Strategy | July 28
✅ Fundamental Analysis:
🔹 The United States and the European Union have reached a significant trade agreement, setting a unified tariff rate at 15% (previously threatened at 30%). The EU has also pledged to invest an additional $600 billion in the U.S. and to purchase $750 billion worth of American energy and military equipment.
🔹 This agreement has significantly eased trade tensions between the U.S. and EU, boosting market risk appetite and sending U.S. stock markets to new record highs. As a result, capital has shifted away from safe-haven assets like gold, causing gold prices to drop to the $3320 level during the Asian session.
✅ Technical Analysis:
🔸 4-Hour Chart:
Since retreating from the 3438.77 high, gold has formed a clear descending channel. While the current candlestick shows some signs of stabilization near the lower Bollinger Band, the rebound has been weak and has yet to touch the middle band, suggesting the downtrend remains intact.
Moving averages are in a bearish alignment, with the MA5 crossing below the MA10, and price continues to trade below both—indicating ongoing bearish control.
If the price fails to reclaim the MA10 level around 3347, the structure will likely remain bearish, with further downside potential targeting the 3316 and 3309 support levels.
On the upside, the 3365–3380 zone represents key resistance. For the bulls to gain meaningful control, the price must break and hold above this area.
🔸 1-Hour Chart:
The overall trend remains bearish within a weak consolidation phase, with price hovering near the lower Bollinger Band.
Despite several attempts to rebound, gold has repeatedly failed to break above the 3350 level, which now acts as a key resistance line.
The Bollinger Bands have begun to flatten slightly, and if the price cannot hold above the 3345–3350 area, the risk of a renewed drop remains. Focus on the 3320–3317 support zone in the near term.
Overall, recent rebounds appear to be corrective in nature, and the 1-hour bearish structure remains unchanged.
🔴 Resistance Levels: 3345–3350 / 3365–3370
🟢 Support Levels: 3330–3325 / 3316–3309
✅ Trading Strategy Reference:
🔻 Short Position Strategy:
🔰Consider entering short positions in batches if gold rebounds to the 3350-3355 area. Target: 3330-3310;If support breaks, the move may extend to 3280.
🔺 Long Position Strategy:
🔰Consider entering long positions in batches if gold pulls back to the 3333-3338 area. Target: 3345-3355;If resistance breaks, the move may extend to 3365.
🔥Trading Reminder: Trading strategies are time-sensitive, and market conditions can change rapidly. Please adjust your trading plan based on real-time market conditions. If you have any questions or need one-on-one guidance, feel free to contact me🤝

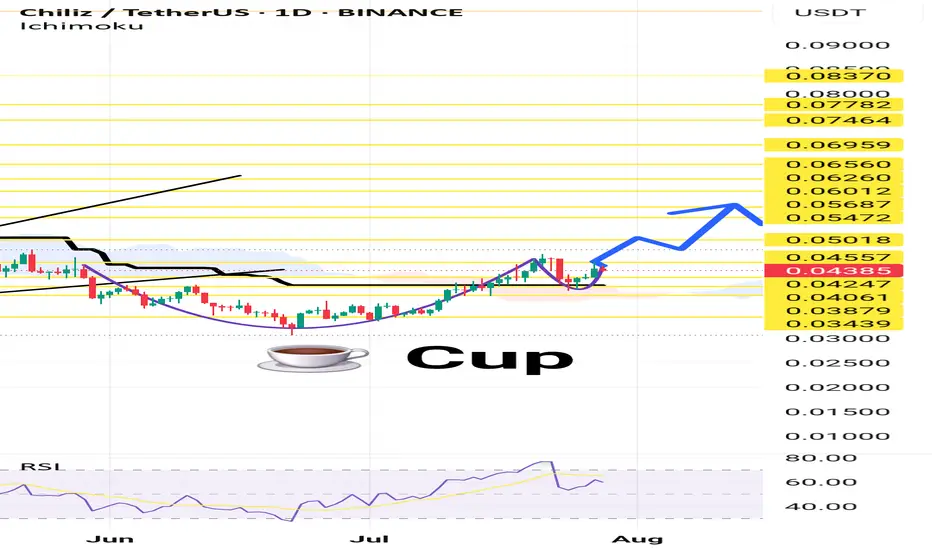
ChilzusdtHello Snipers. On the one-day timeframe, we are witnessing the formation of the Cup pattern or the Cup and Handle pattern, a chart pattern in technical analysis that appears in the form of a cup with a handle on the price chart and is usually considered as a bullish continuation pattern. This pattern indicates a period of price consolidation that forms after an upward trend and is likely to continue its upward trend.
EURCAD is BearishPrice was in a strong uptrend, however now it seems that bulls are exhausted, the notion is further validated by a double top reversal pattern with bearish divergence. If previous higher low is broken with good volume, then we can expect a bearish reversal as per Dow theory. Targets are mentioned on the chart.

Silver bullish flag developingThe Silver remains in a bullish trend, with recent price action showing signs of a continuation breakout within the broader uptrend.
Support Zone: 3686 – a key level from previous consolidation. Price is currently testing or approaching this level.
A bullish rebound from 3686 would confirm ongoing upside momentum, with potential targets at:
3814 – initial resistance
3865 – psychological and structural level
3920 – extended resistance on the longer-term chart
Bearish Scenario:
A confirmed break and daily close below 3686 would weaken the bullish outlook and suggest deeper downside risk toward:
3645 – minor support
3590 – stronger support and potential demand zone
Outlook:
Bullish bias remains intact while the Silver holds above 3686. A sustained break below this level could shift momentum to the downside in the short term.
This communication is for informational purposes only and should not be viewed as any form of recommendation as to a particular course of action or as investment advice. It is not intended as an offer or solicitation for the purchase or sale of any financial instrument or as an official confirmation of any transaction. Opinions, estimates and assumptions expressed herein are made as of the date of this communication and are subject to change without notice. This communication has been prepared based upon information, including market prices, data and other information, believed to be reliable; however, Trade Nation does not warrant its completeness or accuracy. All market prices and market data contained in or attached to this communication are indicative and subject to change without notice.


ETHEREUM LOOKS AMAZINGYes, I continue to share ETH and largely ignore other altcoins. There’s a reason. When ETH outperforms, you can usually throw a dart to find other altcoins that are doing well - a rising tide lifts all boats.
Ethereum had an epic weekly retest of the 50 MA and previous resistance as support, before beating bought back up and turning green on the week. Incredible demand, even vs. Bitcoin. Remember, that line was the first higher high for Ethereum in years, and the first price action above the 50 MA.

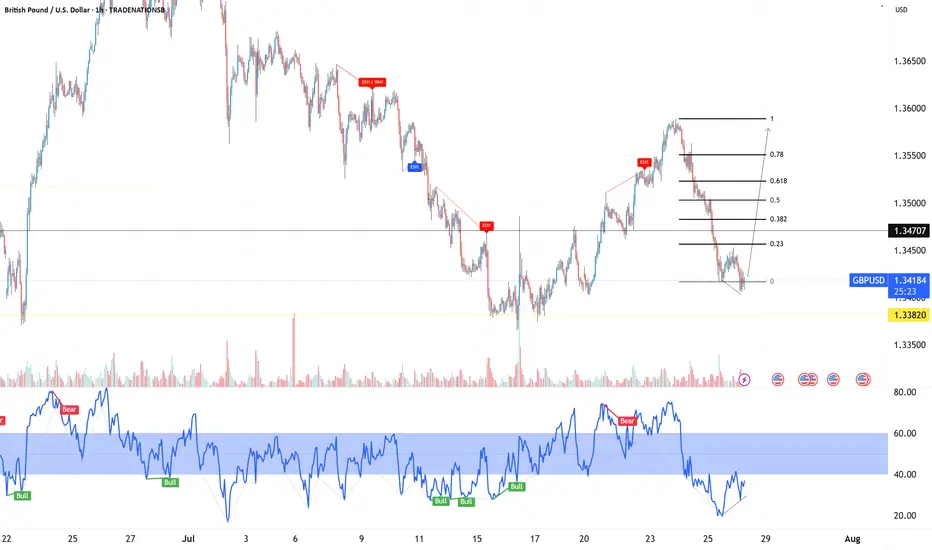
GBPUSD eyes 1.3600 as there is RSI Divergence on 1H timeframe.Early Long entry from 1.3412 -1.3420 area is recommended with strict risk management.
Entry: 1.3412-1.3420
Long:
Stoploss: 1.3400
TP: 1.3550
GOLD Will Move Lower! Sell!
Here is our detailed technical review for GOLD.
Time Frame: 9h
Current Trend: Bearish
Sentiment: Overbought (based on 7-period RSI)
Forecast: Bearish
The market is testing a major horizontal structure 3,337.68.
Taking into consideration the structure & trend analysis, I believe that the market will reach 3,280.02 level soon.
P.S
The term oversold refers to a condition where an asset has traded lower in price and has the potential for a price bounce.
Overbought refers to market scenarios where the instrument is traded considerably higher than its fair value. Overvaluation is caused by market sentiments when there is positive news.
Disclosure: I am part of Trade Nation's Influencer program and receive a monthly fee for using their TradingView charts in my analysis.
Like and subscribe and comment my ideas if you enjoy them!

AUD/CAD SELLERS WILL DOMINATE THE MARKET|SHORT
Hello, Friends!
We are now examining the AUD/CAD pair and we can see that the pair is going up locally while also being in a uptrend on the 1W TF. But there is also a powerful signal from the BB upper band being nearby, indicating that the pair is overbought so we can go short from the resistance line above and a target at 0.885 level.
Disclosure: I am part of Trade Nation's Influencer program and receive a monthly fee for using their TradingView charts in my analysis.
✅LIKE AND COMMENT MY IDEAS✅

XAUUSD REBOUNDED FROM CURRENT TRENDLINE. WHAT'S NEXT?XAUUSD REBOUNDED FROM CURRENT TRENDLINE. WHAT'S NEXT?
Gold had successfully rebounded from the trendline, still showing mid-term bullish trend despite recent news on U.S. - E.U. and U.S. - Japan trade deals. Currently price is attempting to hold above the EMA20 on 1-h chart timeframe.
If this occurs and the asset develops another short-term bullish impulse, we may expect the price to reach 3,360.00 resistance level with further possible impulse towards 3,400.00 level.

AUDCAD SHORT Market structure bearish on HTFs 3
Entry at both Daily and Weekly AOi
Weekly Rejection at AOi
Previous Weekly Structure Point
Daily Rejection at AOi
Previous Structure point Daily
Around Psych Level 0.90000
H4 EMA retest
H4 Candlestick rejection
Rejection from Previous structure
Levels 4.51
Entry 120%
REMEMBER : Trading is a Game Of Probability
: Manage Your Risk
: Be Patient
: Every Moment Is Unique
: Rinse, Wash, Repeat!
: Christ is King.

APT - HUGE POTENTIAL (130+% SPOT) You probably forgot about this altcoin but it is justified. Downtrend since 2023 and lower highs, lower lows but....
If we look more close and use tool fixed price volume we can see that price is above VAL (Value area low), we had break through but price returns..Also good reaction of FVG (Fair value gap).
Now, we can try buy this coin and have some stop lose. Price is in range 172 days and all people forget abut this coin. Analysis is right only if we close daily candlestick about 6$.
Stop lose can be below 4.4$ which is 6-7% of losing.
Second entry is monthly level at 3.3 and stop lose should be below the lowest low 3$.
For me is great opportunity because risk reward is excellent.
Ivan

EURUSD LOSSES BULLISH MOMENTUM. WHERE TO GO?EURUSD LOSSES BULLISH MOMENTUM. WHERE TO GO?
The asset didn't reach the local resistance of 1.18300 and started to consolidate before reaching this level. RSI shows weakness of the impulse on 4-h chart, as well as MACD is in the red zone. Therefore, we expect the price to slowly decline towards local trendline, where SMA200 is situated.

MUGHAL | Bullish RecoveryAccumulation Range @ 69.50-69.80
Target 1 @ 72.50-72.85
Target 2 @ 76.50-77.00
Target 3 @ 84.50-85.00
Stoploss @ 65.50

Nasdaq Index Analysis (US100 / NASDAQ):The Nasdaq index continues its medium- to long-term uptrend and has recently reached a new high at 23,466 USD.
1️⃣ A break and close below 23,200 USD could lead to a pullback toward 23,000, followed by 22,920 USD.
2️⃣ However, if the price holds above 23,330 USD, further bullish continuation is expected, potentially leading to a new all-time high.
⚠️ Disclaimer:
This analysis is not financial advice. It is recommended to monitor the markets and carefully analyze the data before making any investment decisions.

GBP USD SHORT RESULT Price had completed the Inverse Head and Shoulders and in Confluence created a good supply zone as I indicated before setting up the entry.
Price just missed my entry price and then moved down aggressively better than I even expected.
Good Setup though.
But Better still to come.💪
_THE_KLASSIC_TRADER_.🔥

ARVIND SMARTSPACES LTD S/RSupport and Resistance Levels:
Support Levels: These are price points (green line/shade) where a downward trend may be halted due to a concentration of buying interest. Imagine them as a safety net where buyers step in, preventing further decline.
Resistance Levels: Conversely, resistance levels (red line/shade) are where upward trends might stall due to increased selling interest. They act like a ceiling where sellers come in to push prices down.
Breakouts:
Bullish Breakout: When the price moves above resistance, it often indicates strong buying interest and the potential for a continued uptrend. Traders may view this as a signal to buy or hold.
Bearish Breakout: When the price falls below support, it can signal strong selling interest and the potential for a continued downtrend. Traders might see this as a cue to sell or avoid buying.
MA Ribbon (EMA 20, EMA 50, EMA 100, EMA 200) :
Above EMA: If the stock price is above the EMA, it suggests a potential uptrend or bullish momentum.
Below EMA: If the stock price is below the EMA, it indicates a potential downtrend or bearish momentum.
Trendline: A trendline is a straight line drawn on a chart to represent the general direction of a data point set.
Uptrend Line: Drawn by connecting the lows in an upward trend. Indicates that the price is moving higher over time. Acts as a support level, where prices tend to bounce upward.
Downtrend Line: Drawn by connecting the highs in a downward trend. Indicates that the price is moving lower over time. It acts as a resistance level, where prices tend to drop.
Disclaimer:
I am not SEBI registered. The information provided here is for learning purposes only and should not be interpreted as financial advice. Consider the broader market context and consult with a qualified financial advisor before making investment decisions.

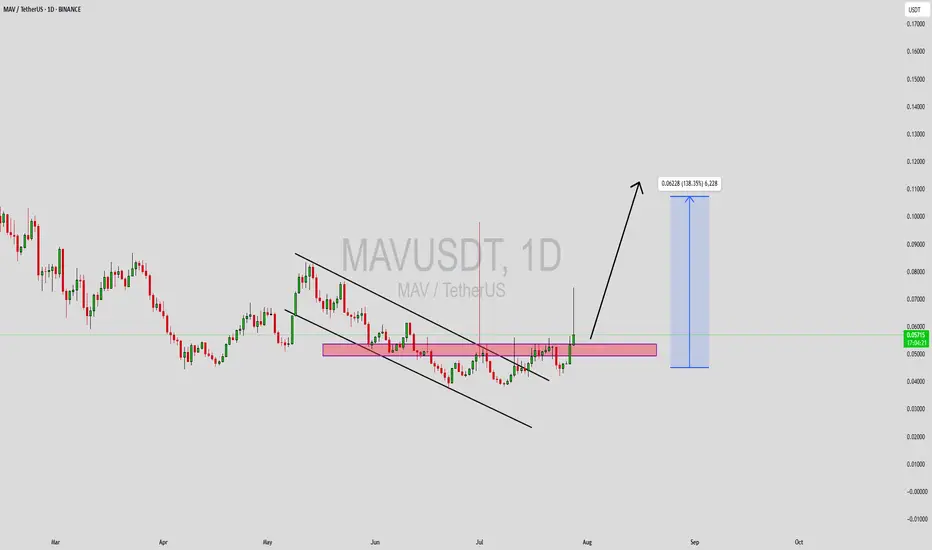
MAVUSDT Forming Falling ChannelMAVUSDT has recently broken out of a falling channel pattern, signaling a potential trend reversal from its prolonged downtrend. This breakout is supported by a noticeable surge in trading volume, adding strength to the bullish momentum. The chart shows that price has successfully retested the previous resistance zone, now acting as strong support. This structural shift provides a compelling setup for an explosive upward move, especially as momentum builds across the altcoin market.
Traders are closely watching MAV due to its technical setup, as well as the broader interest in decentralized finance (DeFi) protocols. The current price action hints at a high-probability bullish continuation, with a projected gain of 90% to 100%+ if bullish sentiment remains intact. The combination of solid support formation, high-volume breakout, and clear upside potential makes this a high-conviction play among smart money participants.
Maverick Protocol (MAV) is gaining attention for its unique approach to liquidity provisioning in DeFi. As the ecosystem matures and more investors look for efficient capital deployment strategies, protocols like MAV stand to benefit. The fundamentals, combined with the technical picture, suggest that the current levels may represent a key accumulation zone before a major breakout.
This setup could offer significant upside for early movers. Watching for follow-through candles and sustained volume above breakout zones will be key to validating the strength of this breakout move.
✅ Show your support by hitting the like button and
✅ Leaving a comment below! (What is You opinion about this Coin)
Your feedback and engagement keep me inspired to share more insightful market analysis with you!
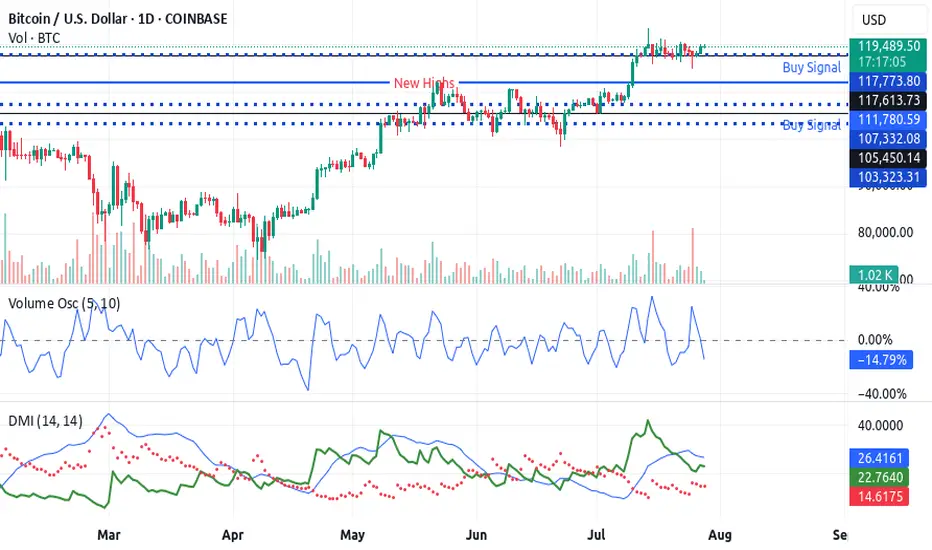
Bitcoin Set to Explode: 3 Powerful Buy Signals Active NowBitco🚀 Bitcoin is Flashing a Buy Signal — Rocket Booster Strategy in Play!
Bitcoin is currently in a strong buy zone, and the Rocket Booster Strategy confirms it’s go-time for traders and investors who know how to ride the wave.
✅ Top 3 Confirmations (Rocket Booster Strategy)
MACD Crossover – Bullish momentum is building. The MACD has crossed above the signal line, indicating a trend reversal.
Oscillator Rating: BUY – Leading oscillators such as the RSI and Stochastic show a bullish signal.
Candlestick Pattern: Rising Window / Bullish Engulfing – Clear bullish confirmation from price action.
This combination of technical signals is what we call the Rocket Booster Setup — a strategy that looks for lift-off moments just before a major upward thrust.
📈 Timeframe:
Daily timeframe only – This is a long-term investment setup, not a short-term scalp. Perfect for swing traders and HODLers.
⚠️ Disclaimer:
This is not financial advice. Always use a simulation/demo account before trading real money. Risk management is key.