BTC Retrace RoadMap and 3 nearby supports worth watching NOWThis is a near-term followup to my big picture linked below.
Dip is underway after orbiting our Genesis Fib at 117.9k.
Quickly approaching the next three supports worth watching.
Supports get stronger below but each one needs to slow the dip.
$ 115,140 is a minor fib but possible end of dip wave.
$ 113,9xx is a double fib that should be pretty strong
$ 111,661 is the sister Genesis fib, and a MUST HOLD
.
Big Picture chart and why 117.9k was KEY
=======================================================
.
Community ideas

Good comeback candle by Nifty today. Nifty fought back against the Tariff odds today and gained 157.4 points. The combination of Friday's candle and today's candle are forming a Bullish Harami kind of pattern. Harami in Japanese means pregnant woman. Usually this is a Bullish pattern but it requires a follow up positive candle in its support. So if we get a positive candle tomorrow then we can consider Friday's low as a good temporary support.
Supports for Nifty currently remain at: 24482 (Important Trend line resistance), 24317, 24186 (Father line support on daily chart), The zone between 23932 (final support, below this level Bears can take total control of the index).
Resistances for Nifty currently remain at: 24802, 24906 (Mother line resistance on daily chart), 25007, 25249-25346 (Important trend line resistance zone, a closing above 25346 will give control of the index to Bulls).
Disclaimer: The above information is provided for educational purpose, analysis and paper trading only. Please don't treat this as a buy or sell recommendation for the stock or index. The Techno-Funda analysis is based on data that is more than 3 months old. Supports and Resistances are determined by historic past peaks and Valley in the chart. Many other indicators and patterns like EMA, RSI, MACD, Volumes, Fibonacci, parallel channel etc. use historic data which is 3 months or older cyclical points. There is no guarantee they will work in future as markets are highly volatile and swings in prices are also due to macro and micro factors based on actions taken by the company as well as region and global events. Equity investment is subject to risks. I or my clients or family members might have positions in the stocks that we mention in our educational posts. We will not be responsible for any Profit or loss that may occur due to any financial decision taken based on any data provided in this message. Do consult your investment advisor before taking any financial decisions. Stop losses should be an important part of any investment in equity.

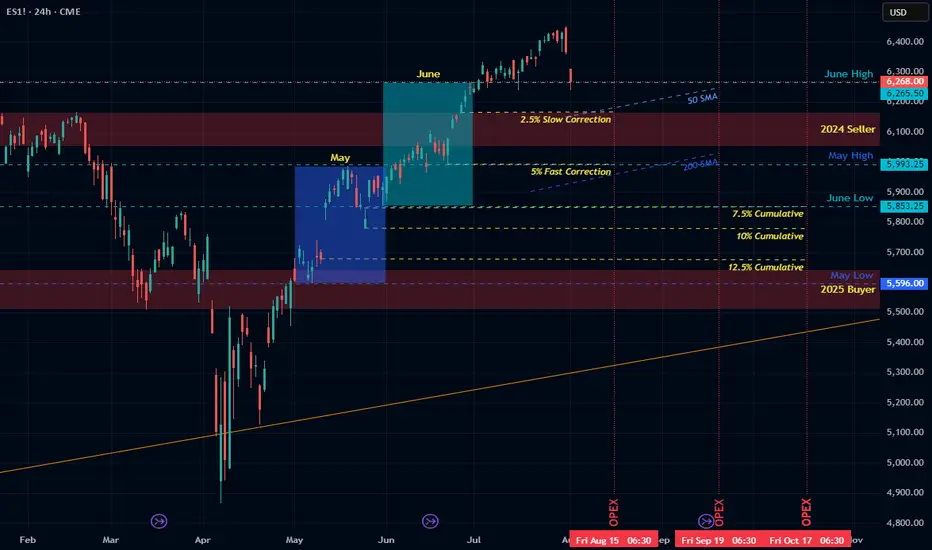
Path into Q3Outlook for the Next Few Months
• Now–August OpEx: -2.5% to -5% slow correction
• August–September OpEx: potential 5–7.5% additional decline
• By late Q3: cumulative 10–12.5% drawdown (target S&P ~5700).
• October: possible bounce — or acceleration if data worsens
• End of Year: risk of deep drop à la Oct–Dec 2018 if trends continue
Macro Backdrop
• Watch for margin compression, CPI surprise, and unemployment uptick
• Private data shows more fragility than government numbers
• QRA-driven liquidity tightening may amplify downside risk
Political Timing and Fed Policy
• Administration may welcome controlled decline to enable early 2026 rate cuts
• If market doesn’t decline soon, blow-off top/melt-up into midterms possible
USOIL Is Bearish! Short!
Please, check our technical outlook for USOIL.
Time Frame: 9h
Current Trend: Bearish
Sentiment: Overbought (based on 7-period RSI)
Forecast: Bearish
The market is approaching a significant resistance area 69.178.
Due to the fact that we see a positive bearish reaction from the underlined area, I strongly believe that sellers will manage to push the price all the way down to 66.684 level.
P.S
The term oversold refers to a condition where an asset has traded lower in price and has the potential for a price bounce.
Overbought refers to market scenarios where the instrument is traded considerably higher than its fair value. Overvaluation is caused by market sentiments when there is positive news.
Disclosure: I am part of Trade Nation's Influencer program and receive a monthly fee for using their TradingView charts in my analysis.
Like and subscribe and comment my ideas if you enjoy them!

Silver Wave Analysis – 4 August 2025- Silver reversed from the support zone
- Likely to rise to the resistance level 39.45
Silver recently reversed from the support zone between the support level 36.20 (which also stopped wave ii at the start of July), lower daily Bollinger Band and the 38.2% Fibonacci correction of the upward impulse from May.
The upward reversal from this support zone created the daily Japanese candlesticks reversal pattern, Piercing Line – which marked the end of the earlier correction 2.
Given the clear daily uptrend, Silver can be expected to rise to the next resistance level at 39.45 (top of earlier impulse wave 1 from July).

BTC accumulates, slightly adjusts down💎 BTC PLAN UPDATE – START OF THE WEEK (04/08)
🔍 1. Current Technical Structure
Price Pattern: The chart shows BTC is forming a falling wedge pattern, with converging support and resistance lines.
False Break: There was a false break below the strong support zone around ~112,000, followed by a sharp rebound. This indicates buyers are actively defending this level, showing potential buying pressure.
Fibonacci Retracement: From the recent low to high, the 0.5 (115,559) and 0.618 (116,361) Fibonacci levels are acting as key resistance zones.
Key Price Levels:
• Strong support: 111,800 – 112,300
• Near resistance: 115,500 – 116,500
• Next resistance: downtrend line and previous high around 118,000 – 119,000
🔄 2. Possible Trend Scenarios
✅ Main scenario (bullish):
BTC made a false break below the wedge → rebounded toward Fibonacci resistance → potential:
• Continue rising to the 115,500 – 116,500 zone
• If it breaks and holds above this zone, BTC could break out of the wedge pattern and target 118,000 – 120,000
• A longer-term target could be the 1.618 Fibonacci Extension around ~123,159
❌ Alternative scenario (bearish):
If BTC fails to break above 116,000 and gets rejected:
• It may retest the 112,000 support zone again
• A breakdown below this support would bring back the downtrend
🔄 3. Bullish Supporting Factors:
• The false break signals a shakeout of weak sellers.
• A potential inverse head-and-shoulders pattern is forming, supporting a bullish reversal.
• Moving Averages (MA): Price is nearing the 200 MA (red) – a possible bullish crossover with shorter-term MAs may occur, signaling a buy.
🧭 Suggested Trading Strategy
• Safe buy zone: Around 113,500 – 114,000 if there’s a pullback.
• Take profit in stages: 116,500 – 118,000 – 120,000
• Stop-loss: Below 112,000 in case of a confirmed breakdown

USDCHF BUY ANALYSISUSDCHF New Forecast👨💻👨💻
This is my personal trade and not in anyway a mandatory setup.
Note:
Follow proper risk management rules. Never risk more then 2% of your total capital. Money management is the key of success in this business...... Set your own SL & TP.
Please support this idea with a Like and COMMENT if you find it useful click "follow" on our profile if you will like these type of trading ideas delivered straight to your email in the future.
Thanks for your continued support!! lemme know your thoughts in the comment sec..

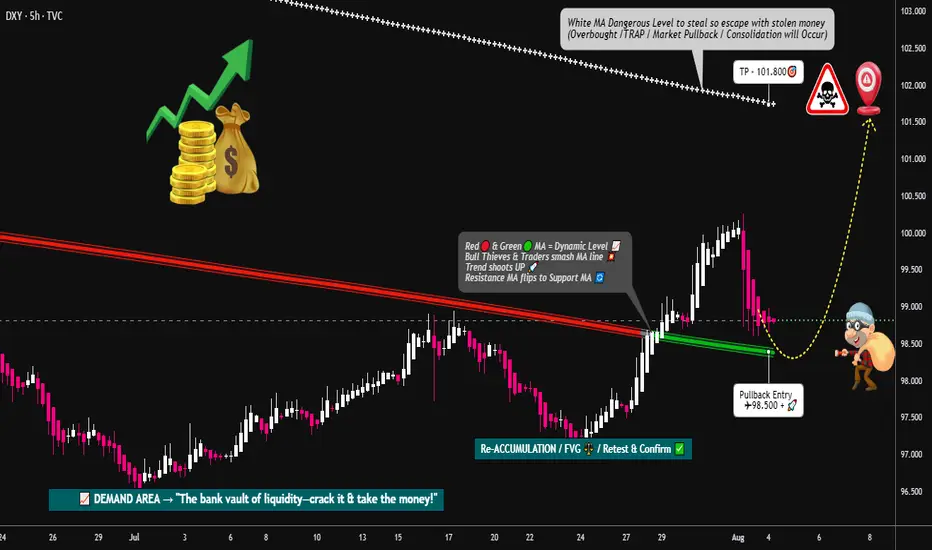
DXY Locked & Loaded: Robber's Gameplan for Profit Pullout💸💼 "DXY Market Heist Blueprint – The Thief's Bullish Escape Plan" 💼💸
Rob the Market, Not the Rules – Trade Smart, Trade Sharp, Trade Thief Style™
🌍 Hey Money Makers, Risk Takers & Market Robbers!
Hola! Ola! Bonjour! Hallo! Marhaba! 🙌
Let’s break into the DXY vault and swipe those profits with precision. 💼💸
🧠💡This Thief Trading Style™ Master Plan is a high-stakes operation backed by technical setups, macro-fundamentals, and robbery-level insights. Follow the blueprint laid out on the chart. Our target? The High-Risk Yellow ATR Zone – where the real treasure is buried.
💼 ENTRY: "The Vault Is Open – Grab the Bullish Bags!"
Enter long as price approaches key pullback levels within a 15–30 min timeframe. Use the most recent candle wick’s swing low/high for sniper-style DCA entries.
🔑 Layer multiple limit orders like a thief stacking getaway bags (aka the DCA / Layering Method). Be patient and precise.
🛑 STOP LOSS: "Don’t Get Caught by the Market Police"
📍 Place SL just below the nearest 4H swing low (example: 97.300) depending on your strategy (scalping/swing).
⚖️ Your SL should reflect your risk appetite, lot size, and how many limit orders you’re running. Thieves don’t risk it all on one job. 🎭
🎯 TARGET: 101.800 (or Escape Before the Sirens)
Once the target zone nears, decide whether to collect full loot or exit before resistance hits. We trade smart, not greedy. 🧠💰
📈 Why This Heist Makes Sense: Market Conditions Breakdown
Bullish momentum supported by macro drivers and intermarket forces
COT report and sentiment leaning in favor of USD
Dollar Index structure showing signs of reversal + trend confirmation
Consolidation trap zones hinting at institutional accumulation
💡 This is not just a blind entry—it's a well-researched and time-tested plan. Check the chart details and refer to:
🔗 Fundamentals | COT Reports | Sentiment Score | Quantitative Outlook
🚨 NEWS & POSITION MANAGEMENT ALERT
Before jumping in, beware of high-impact news!
🗞️ To keep your trades safe and stress-free:
Avoid opening new positions during major news releases
Use trailing SLs to protect gains
Monitor volatility triggers (economic calendar is your best friend!)
🏴☠️💥 BOOST THE ROBBERY – Hit That Like/Boost Button
The more you boost, the stronger the heist crew becomes! 💪🚀
Help fellow traders steal opportunities with the Thief Trading Style™ – calculated, bold, and sharp.
🔥 Let's continue to outsmart the markets and make each trade count. Stay tuned for the next heist update – fresh trades, deeper insights, and bigger bags. 🤑💼
🔔 Disclaimer: This plan is not financial advice. Use it for educational and entertainment purposes. Always conduct your own analysis and manage risk accordingly.
📌 Markets shift quickly. Stay adaptable, informed, and always ready to pivot.
GBP/JPY BULLS ARE GAINING STRENGTH|LONG
Hello, Friends!
Previous week’s red candle means that for us the GBP/JPY pair is in the downtrend. And the current movement leg was also down but the support line will be hit soon and lower BB band proximity will signal an oversold condition so we will go for a counter-trend long trade with the target being at 197.696.
Disclosure: I am part of Trade Nation's Influencer program and receive a monthly fee for using their TradingView charts in my analysis.
✅LIKE AND COMMENT MY IDEAS✅

SHIB Still Faces Pressure Below Parabolic SAR ResistanceSHIB continues to struggle beneath its Parabolic SAR, which has established dynamic resistance above its current price at $0.00001382. This persistent downward positioning below the SAR dots suggests that sellers remain in control, limiting bullish momentum and keeping the asset under pressure in the short term.
The Parabolic SAR indicator tracks potential reversals and trend direction. When the SAR dots appear above the price, it typically signals a bearish trend, while dots below the price suggest bullish momentum.
In SHIB’s case, the indicator’s placement overhead means upward attempts may continue to face resistance unless a strong breakout occurs.
Until SHIB flips this level and closes above the SAR, traders may expect continued consolidation or downward movement.

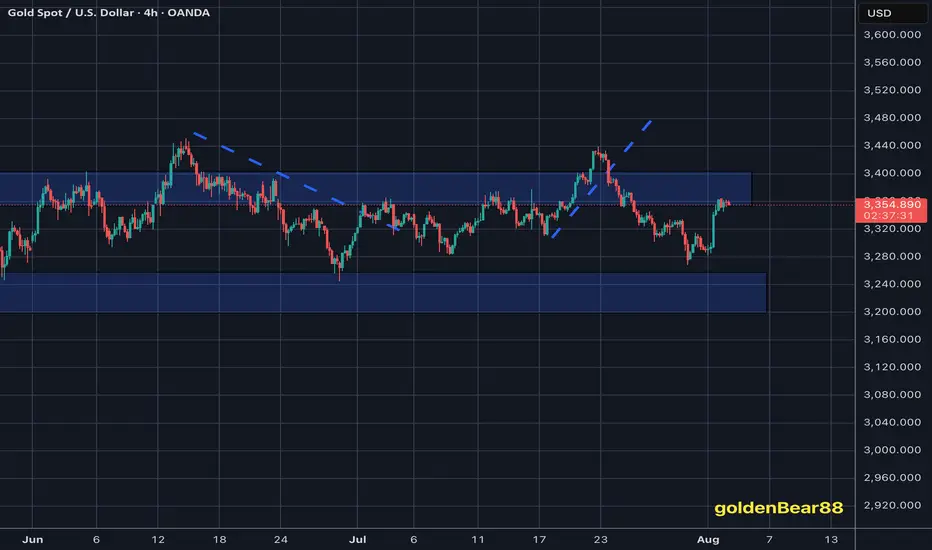
Gold soaring with NFP debacle as an catalystQuick update: Gold is Trading on NFP fuelled relief rally and Bearish Technicals are invalidated once again (I announced lately that this might happen if NFP delivers downside surprise / debacle). The Hourly 4 chart's Ascending Channel increases it's gains towards Overbought levels as #3,352.80 benchmark is showcasing strong durability. Both Weekly chart (#1W) and Monthly (#1M) are on mild gains (# +0.65% and # +0.71% respectively) and with ranging candles (Gold consolidating above the Support for the fractal) I do not see any rebound (to the downside) possibility yet.
My position: As discussed above, I will keep Buying every dip on Gold and will not Sell Gold throughout today's session (if I do, will be aggressive in & out Scalp only). Gold remains very sensitive to every Bullish development while Bearish ones are still on second place.
ENA/USD: BBTrend Suggests Latent Bullish Momentum UnfoldingSince June 29, the BBTrend (Bollinger Band Trend) indicator on ENA’s daily chart has shown a steady series of growing green bars. This expansion signals increasing underlying bullish momentum, even as the token’s price trended mostly downward over the past week.
However, today’s 10% rally marks the strongest upside move in that entire period—potentially signaling the start of a reversal. In technical terms, when BBTrend bars expand during price consolidation, it often precedes a breakout. That appears to be playing out now. If this renewed momentum sustains, ENA could be setting up for further upside in the sessions ahead.

EUR/GBP BULLS ARE STRONG HERE|LONG
EUR/GBP SIGNAL
Trade Direction: long
Entry Level: 0.863
Target Level: 0.872
Stop Loss: 0.857
RISK PROFILE
Risk level: medium
Suggested risk: 1%
Timeframe: 9h
Disclosure: I am part of Trade Nation's Influencer program and receive a monthly fee for using their TradingView charts in my analysis.
✅LIKE AND COMMENT MY IDEAS✅

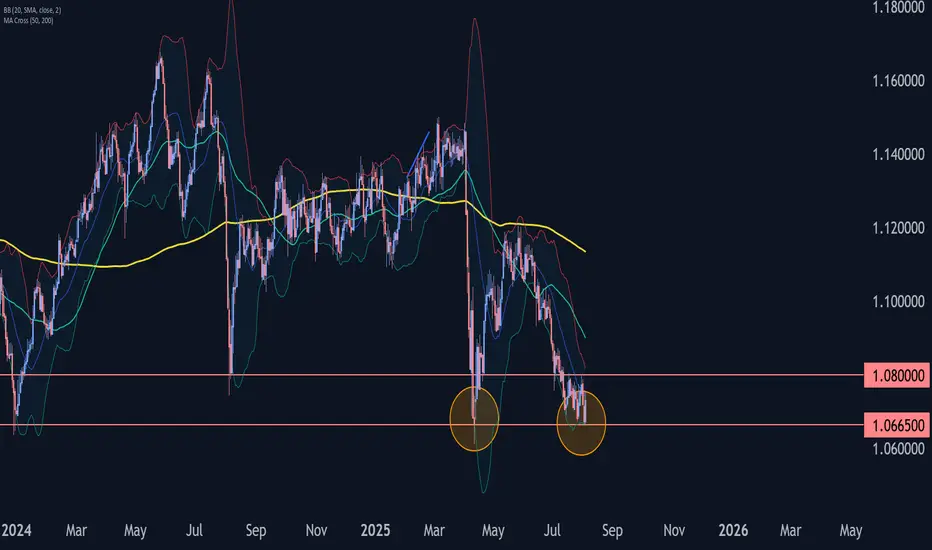
GBPCHF Wave Analysis – 4 August 2025
- GBPCHF reversed from key support level 1.0665
- Likely to rise to the resistance level 1.0800
GBPCHF currency pair recently reversed from the support zone between the pivotal support level 1.0665 (former strong support from April) and the lower daily Bollinger Band.
The upward reversal from this support zone will likely form the daily Japanese candlesticks reversal pattern Bullish Engulfing, if the pair closes today near the current levels.
Given the strength of the support level 1.0665 and the bullish divergence on the daily Stochastic, GBPCHF can be expected to rise to the next resistance level 1.0800 (which stopped earlier corrections (ii) and ii).
EUR/USD DAILY CHART ANALYSIS - 4TH AUG 2025EUR/USD Daily Trade Setup – August 4, 2025
Anticipating a move in EUR/USD into the yellow imbalance zone between 1.16991 and 1.16025, for short positions.
Final take-profit target for these sells is the red zone between 1.10120 and 1.08126. If price does not reach the yellow zone, then no entry for short positions. PATIENCE

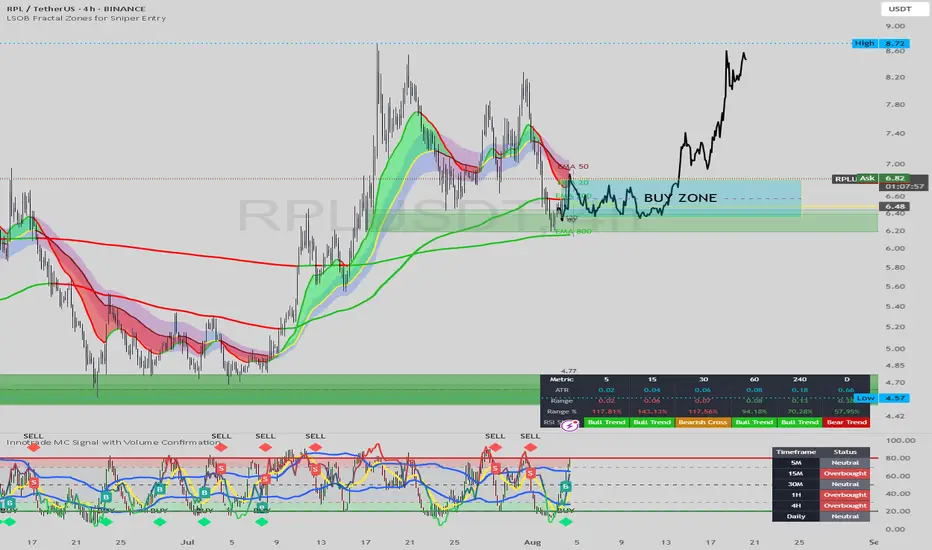
RPL/USDT Enters Prime Buy Zone: Accumulation Before Next Leg Up?Firstly, our Algo-based indicators are used to create this analysis. Please Follow, Boost and leave your comments if you profited with our posts, so we may continue:
This 4-hour chart for RPL/USDT highlights a key support area that could serve as a launchpad for the next bullish impulse.
Analysis:
Corrective Pullback: After a strong rally that peaked near $8.72, the price has entered a corrective phase, pulling back to a significant area of interest.
The "BUY ZONE": A critical support zone has been identified between $6.48 and $6.80. This area represents a confluence of technical support:
Horizontal Structure: It aligns with a previous support/resistance level, where price has reacted multiple times.
Moving Averages: The price is currently testing the EMA 200 and is hovering just above the longer-term EMA 800, both of which often act as dynamic support during uptrends.
Indicator Confirmation: The custom indicator at the bottom of the chart shows the price has dipped into the oversold "BUY" territory, and a fresh "B" (Buy) signal has just appeared. This suggests that selling pressure is exhausting and buyers are beginning to step in.
Price Projection: The drawn black line illustrates a potential scenario where the price consolidates and accumulates within the "BUY ZONE." This period of sideways action would build a base before a strong continuation of the primary uptrend, targeting a retest and potential break of the recent high at $8.72.
Strategy:
Idea: Look for buying opportunities within the defined support zone.
Entry: The area between $6.48 and $6.80 is the designated "BUY ZONE." Traders might look for signs of consolidation or bullish price action within this range to initiate long positions.
Target: The initial target would be the recent high of $8.72.
Conclusion:
The current price action presents a classic dip-buying opportunity. The confluence of structural support, key moving averages, and a bullish indicator signal in the "BUY ZONE" suggests a high probability of a bullish reversal. Accumulation in this zone could fuel the next significant move upwards for RPL.
Disclaimer: This analysis is for educational purposes only and should not be considered financial advice. Always conduct your own research and manage risk appropriately.