LINK - The sleeping Giant ready to wake!Don't forget to add LINK to your watchlist — it's a solid project with long-term investment potential.
The weekly chart shows that LINK is currently retesting the downtrend line it recently broke — a textbook bullish retest.
The lower trendline now acts as a key support level, and as long as price holds above it, the structure remains healthy.
Currently trading around $17.6, the price hasn’t moved significantly yet —
You’ve got:
✅ A strong fundamental project
✅ A bullish technical setup
✅ Large market cap
✅ Still early entry
What more do you need to enter?
Accumulate now... and thank me later.
Best Regards:
Ceciliones🎯
Community ideas

dogeusdtMy opinion is based on the Arti M strategy. Share your thoughts with me. Is your opinion right or wrong?

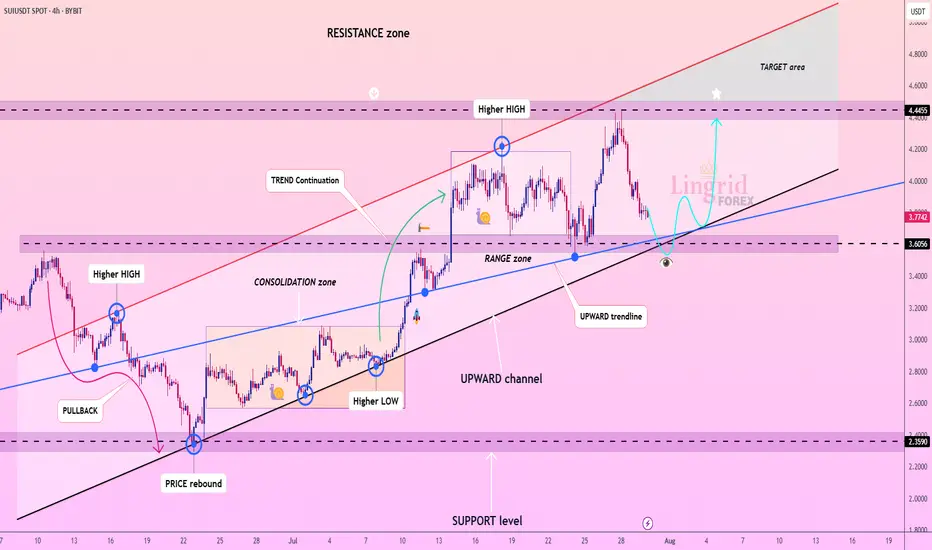
Lingrid | SUIUSDT Approaching Key Level for Potential LongBINANCE:SUIUSDT has pulled back from the 4.44 resistance but remains within a well-defined upward channel, holding above the 3.60 support zone. The structure shows higher lows with price hovering around the blue upward trendline, indicating ongoing bullish momentum. As long as 3.60 holds, buyers may regain control and push price back toward the 4.44 resistance and beyond. Momentum favors continuation as the consolidation phase near support suggests accumulation.
📉 Key Levels
Buy trigger: Break and close above 3.85
Buy zone: 3.60–3.70
Target: 4.44
Invalidation: Drop below 3.26
💡 Risks
Failure to hold above 3.26 could trigger deeper pullback.
Resistance near 4.44 may cause rejection.
Low market volume could delay breakout attempts.
If this idea resonates with you or you have your own opinion, traders, hit the comments. I’m excited to read your thoughts!
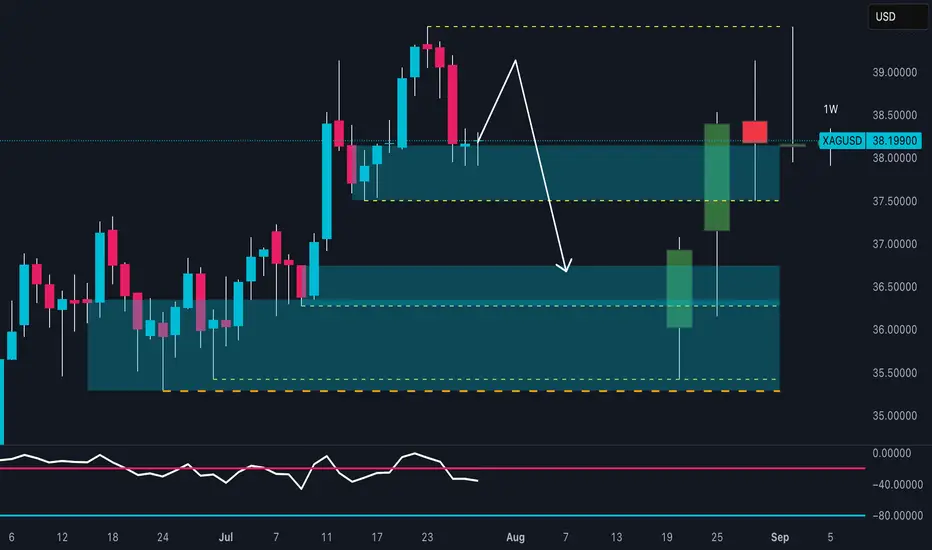
SILVER Is About to Collapse? Watch This Critical Supply Zone!Price recently tapped a high near 39.20 before sharply rejecting from the 38.80–39.20 supply zone, confirming strong selling pressure. The current structure shows:
- Supply zone tested and rejected
- Likely return to the previous demand zone (36.50–36.00)
- RSI is turning down, confirming loss of momentum
A pullback toward 38.30–38.50, followed by a bearish continuation toward the 36.50 area, which acts as a key structural and institutional support.
🗓️ Seasonality
Historically, July is bullish for silver:
Last 5Y average: +0.89%
Last 2Y average: +2.18%
However, August–September are bearish months:
August: mildly positive, but weak
September: consistently negative across all time frames (-0.86% to -1.10%)
This increases the probability of a downward move starting in early August, in line with current price action rejection.
🪙 Commitment of Traders (COT) – July 22
Non-Commercials (speculators):
Longs: +656
Shorts: -516
Commercials (hedging):
Longs: +1,337
Shorts: +916
➡️ Commercials are increasing both long and short exposure, while non-commercials remain net long — a sign of moderate optimism.
However, long positioning is slowing down compared to previous weeks. A potential exhaustion in bullish momentum is forming.
📉 Sentiment
52% short vs 48% long
Volume: more lots on the short side (492 vs 454)
Sentiment remains neutral to slightly contrarian bullish, but not extreme. This may allow for a fake breakout before a deeper move down.
🧩 Operational Summary
Main bias: Bearish short to mid-term (starting August), supported by:
- Technical rejection at supply
- Negative seasonal tendencies ahead
- RSI showing momentum loss
- COT showing stabilization, not accumulation
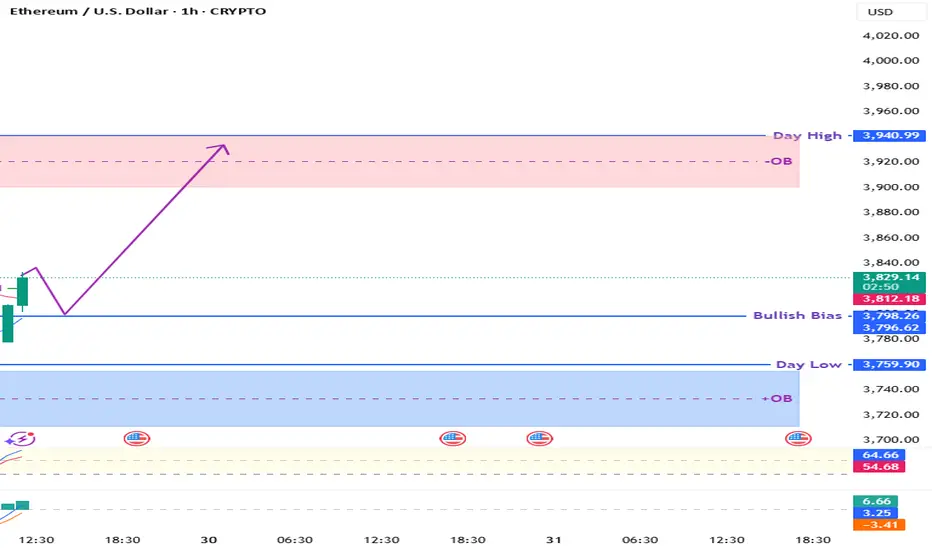
ETH/USD (1H) – Bullish Reversal Confirmed After CHoCHPrice just flipped structure bullish with a clear CHoCH above the prior range, reclaiming the Bullish Bias Zone around $3796–$3800 after rejecting from a major OB.
🔹 OB Tap + Liquidity Grab Confirmed
🔹 Strong CHoCH with bullish momentum
🔹 MACD and RSI support the push
🔹 Expecting a minor pullback → continuation to the OB zone near $3940
📌 Bias: Bullish
🎯 Target: $3930–$3940 OB Mitigation
📍 Invalidation: Break below $3790
Ideal setup for a continuation play on 1H and 15M structure.
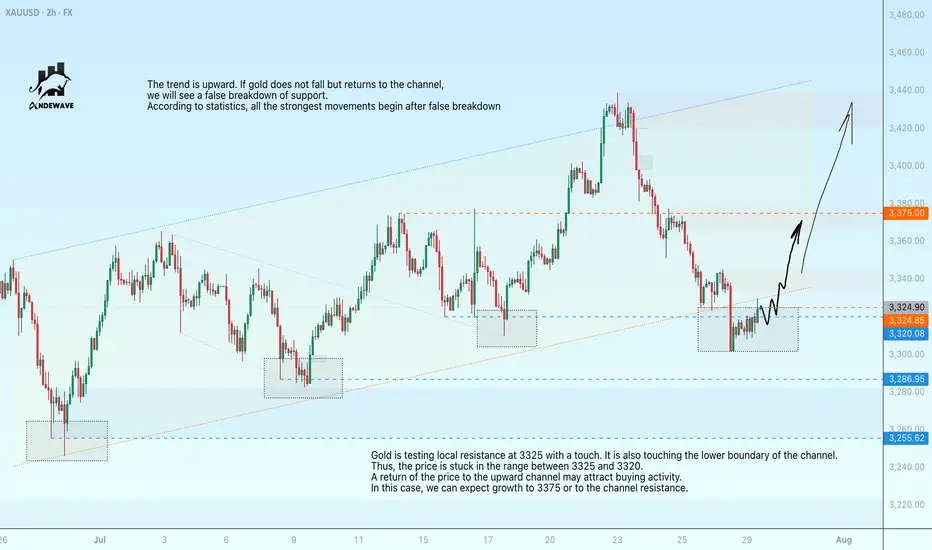
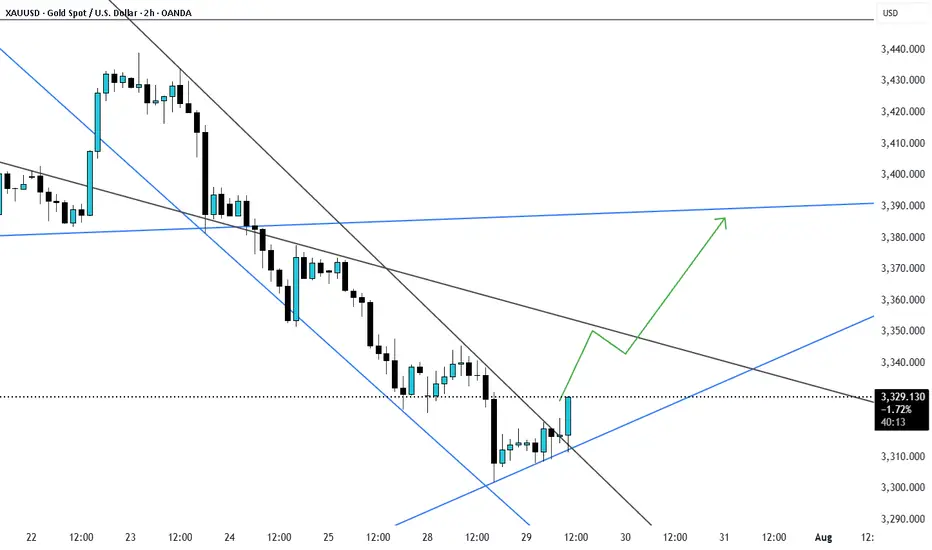
Gold may paint a false breakdown of supportGold is testing local resistance at 3325 with a touch. It is also touching the lower boundary of the channel. Thus, the price is stuck in the range between 3325 and 3320. A return of the price to the upward channel may attract buying activity. In this case, we can expect growth to 3375 or to the channel resistance.
The trend is upward. If gold does not fall but returns to the channel, we will see a false breakdown of support. According to statistics, all the strongest movements begin after false breakdown
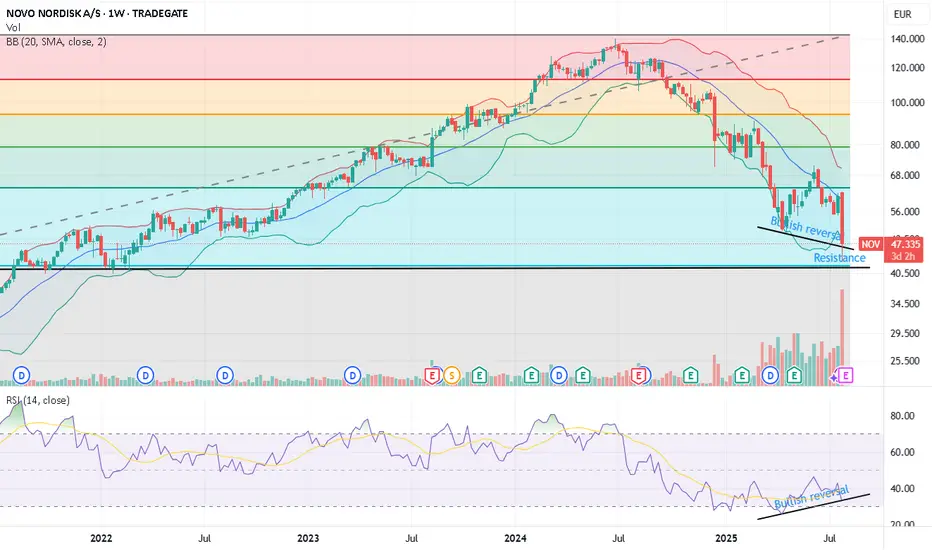
Fib resistance + RSI bullish reversal After the bearish news earlier today, it seems like Novo has had its final capitulation.
There's a fib resistance + historical resistance dating back to '21-'22.
On the weekly, the RSI is also presenting a bullish divergence - although we may want to await the closing of this week to confirm this.
Taking into account strong fundamentals, analyst consensus, it seems like this stock is a BUY!
GBPNZD BUY from support zone at 2.23000 buyers area📊GBPNZD 4H Forecast
GBPNZD has broken down from the ascending channel, but now showing signs of a potential bullish reversal from the demand zone at 2.23000
Buyers could step in soon from this key level
📌Target Zones:
2.25800 – Resistance Level
2.27500 – Supply Zone
Outlook:
As long as price holds above 2.23000, a bullish bounce is possible with targets at resistance and supply zones.
Monitoring price action for confirmation at the demand area

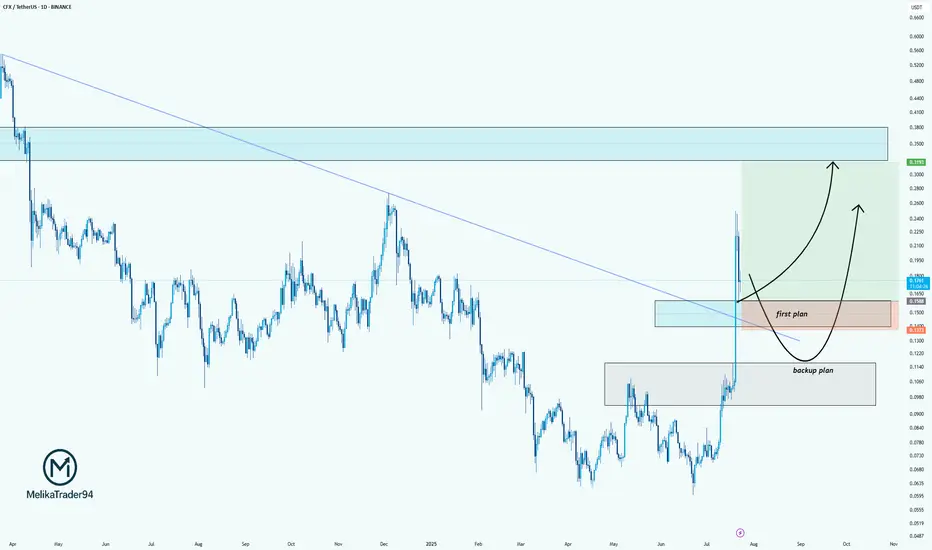
CFX/USDT: Two-Plan Strategy for the Next MoveHello guys.
CFX just broke out of a long-term downtrend line, showing strong bullish momentum. After this sharp impulse, we're now patiently watching for the pullback zone.
Here’s my plan:
✔ First plan: Looking for a reaction around the breakout retest zone (0.1500–0.1300). This is the ideal area for a bullish continuation if buyers step in early.
✔ Backup plan: If the price drops deeper, the second demand zone (around 0.1060–0.0950) is where we’d expect stronger buyer defense.
Potential upside target: 0.31+, where price previously showed strong selling pressure.

GBP/USD Bearish Breakdown with Downside PotentialThe GBPUSD chart indicates a bearish trend, with price breaking below a key ascending support line. This breakdown suggests a shift in momentum, favoring sellers. The price is currently trading below the Ichimoku cloud, which reinforces the bearish bias. A pullback to the broken support zone may offer a retest before further decline. The structure points toward lower lows, and the chart outlines two potential support levels where price may react. Continued downside is expected if the current resistance zone holds. Bearish continuation appears likely as long as price remains below the recent high and beneath the cloud.
Entry Sell: 1.33360
First Target point: 1.32250
Second Target point: 1.30000
If you found this analysis helpful, don’t forget to drop a like and comment. Your support keeps quality ideas flowing—let’s grow and win together! 💪📈

Gold Break of channel resistance next target is 3360-3375Gold was trending in down trend but now it has broken the resistance and is likely to go up.
EURNZD Update: This short trigger could spark a waterfall dropYo traders, Skeptic from Skeptic Lab! 🩵 EURNZD just broke its daily upward trendline, setting up a sharp drop. Weekly shows a fading uptrend. Daily’s got a strong bearish candle, full body, no buyer fight. 4H trendline broke and... more on this video:)
👀Beware of fakeouts this week—volatility’s high! Trade smart, keep risk tight, and don’t FOMO. Share your thoughts in the comments, boost if it helps <3

Gold's Strong Moves: Will the Bears Take Over?Hello everyone, Kevinn here!
Today, gold continues to experience significant fluctuations in the new week, with XAU/USD currently hovering around 3,325 USD. Amid the strong rise of the USD, the gold market has seen a sharp adjustment. However, the medium-term trend still seems to favor the bears.
The main reason for the turbulence in gold prices is the strengthening of the U.S. dollar, following strong economic news from the U.S. that points to a clear recovery. The stronger USD has made gold more expensive for international investors. Additionally, the market is awaiting further moves from the Fed regarding interest rate policies, which is limiting the flow of capital into gold.
Looking at the technical chart, we can see that although gold has shown a slight uptick, bearish pressures are still lurking. Indicators and patterns suggest that gold may break its rising price channel, with a high likelihood of further declines. The next support level could be around 3,310 USD, and if broken, gold may continue to fall toward 3,300 USD or lower.
Based on the signals from the chart, ENTRY 1 strategy would be to sell when the price breaks the upward channel. Additionally, if the price pulls back to the upper limit zone, ENTRY 2 could present another potential selling point.
For today's strategy, I expect gold to decrease. What do you think? Share your thoughts in the comments!

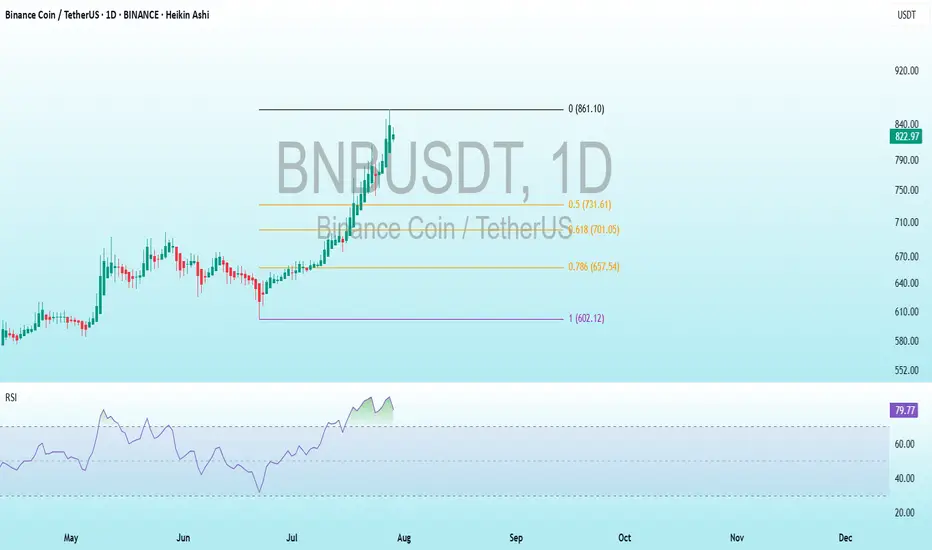
BNB Bearish DivergenceBINANCE:BNBUSDT
Trade Setup:
Target 1: 731.61 (0.50 Fibonnaci Golden Zone).
Target 2: 701.05 (0.618 Fibonnaci Golden Zone).
Target 3: 657.54 (0.786 Fibonnaci Golden Zone).
Target 4: 602.12 (1 Fibonnaci).
Stop Loss: 861.10 (above recent high, ~25% above current price).
RSI Analysis: The RSI shows a bullish divergence (price making lower lows while RSI makes higher lows), suggesting potential upward momentum. Current RSI is around 79.74, nearing overbought territory (>70), so caution is advised.
Possible Double bullish flag for #SOLThere is a world where SOL is confirming this double bullish flag setup for New Higher Highs...Let's wait and see. It needs to hold the 179 -178 line and keep and eye on Volume for a healthy push until the next Fibo level around 220.
The only pb is August has always been a bad month for crypto in gnl. Trade carrefully ! Educational content only


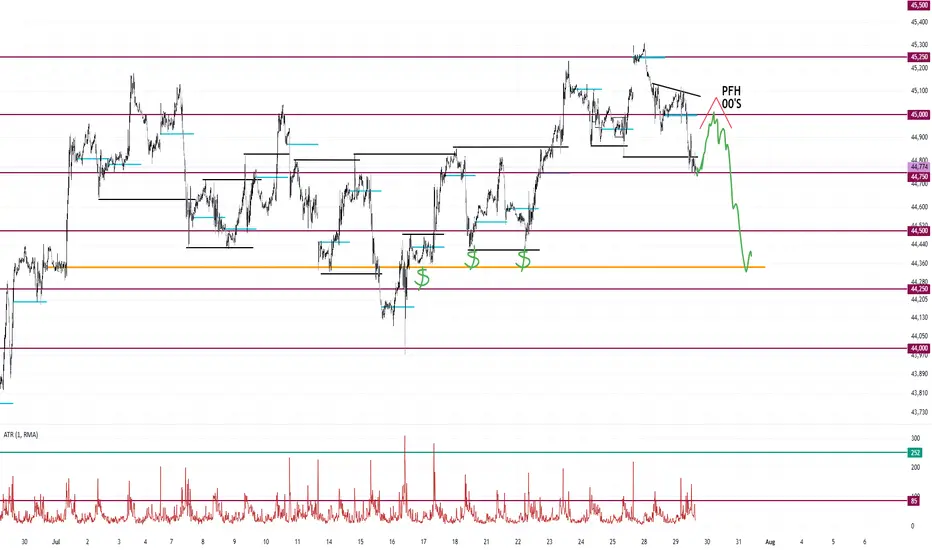
Peak Formation High Into Double Zero's Dump to Monthly OpenLooking for a peak formation high to form under the double zeros.
The market is most likely targeting the liquidity sitting around the monthly open.
I don't see any support until the market takes out some of these lows. Maybe at 44,250.
Highlighted in red brush is every peak formation high formed this month.
DOGE/USDT Technical Analysis – Breakout AnticipationDOGE/USDT Technical Analysis – Breakout Anticipation
As of the current market structure, DOGE/USDT is showing signs of a potential bullish reversal from the demand zone (support), aiming toward the projected target at 0.27253 USDT.
🔍 Chart Structure & Price Action
Support Zone (0.21873 – 0.22568): The price has previously respected this area, making it a strong demand zone where buyers stepped in.
Resistance Zone (0.27756 – 0.29000): A key supply zone where previous rallies halted. This is the ultimate test for bulls after the breakout.
Current Price (0.23743) is showing consolidation above the support, suggesting accumulation before a move.
🧠 Technical Indicators
Supertrend Indicator: Currently flipping to bullish (10,3 settings), indicating potential upside continuation.
Volume Profile (VRVP): Shows high volume nodes around the support level, confirming strong interest from institutional players or large orders.
Market Structure: A higher-low is forming, indicating early signs of a bullish market shift.
🎯 Target
The projected move towards 0.27253 USDT aligns with previous price action and supply zone interaction. A clean breakout from the current consolidation could fuel momentum toward this level.
🎓 Educational Insight
This setup reflects the principles of Smart Money Concepts (SMC):
Price tapping into demand before impulse moves.
Liquidity grab at lows.
Break of structure (BOS) to the upside could trigger continuation.
Traders can learn the value of combining structure-based trading with volume analysis to improve entry precision and confidence.

BTCUSD LongWe´re in a bigger bullish 5wave structure. Right now we´re in the 4th wave and could have completed a ABC correction. On 15min Chart we can see, that we just formed the 1st wave to start the 5th wave in the bigger structure
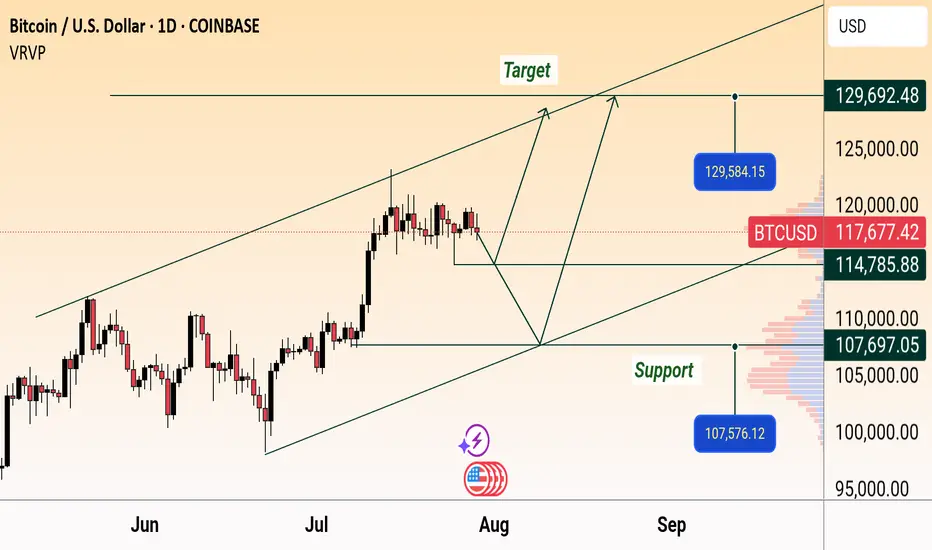
BTC/USD Daily Outlook: Support & Target Levels IdentifiedBitcoin (BTC/USD) Daily Chart Analysis:
Price is currently at $117,758.70, showing a slight decline. Key support levels are marked at $114,785.88 and $107,576.12, while targets are projected near $129,584.15 and $129,692.48. Chart suggests a possible upward channel, with both bullish and bearish scenarios mapped.
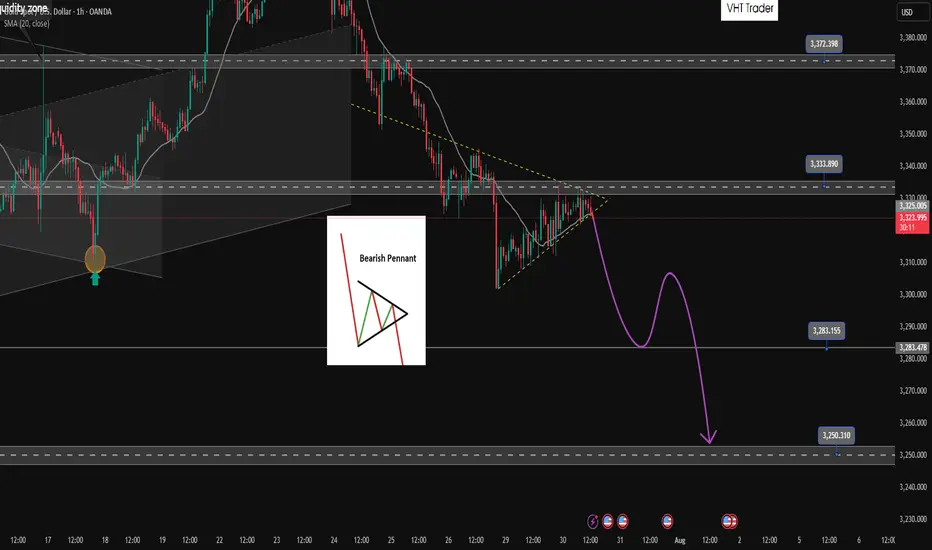
Bearish pennant pattern active. Active SELL✏️Gold price is forming a triangle accumulation pattern. That shows the hesitation of investors at the moment, they may be waiting for important economic indicators of the US this week. Just an impact that makes Price break out of the triangle border can create a strong FOMO trend. The price line is quite similar to the bearish pennant pattern and heading towards really strong support areas.
📉 Key Levels
SELL Trigger: Break bottom line 3324
Target 3285, lower is the 3250 area
BUY Trigger: Break and trading above 3333
BUY Trigger: Rejection and confirmation of candle at 3285
Leave your comments on the idea. I am happy to read your views.