CARDANO (ADAUSD): Bullish Move Ahead!
ADA is testing a key daily support cluster.
I think the market is going to bounce from that
and continue growing.
Next resistance - 0.97
❤️Please, support my work with like, thank you!❤️
Community ideas

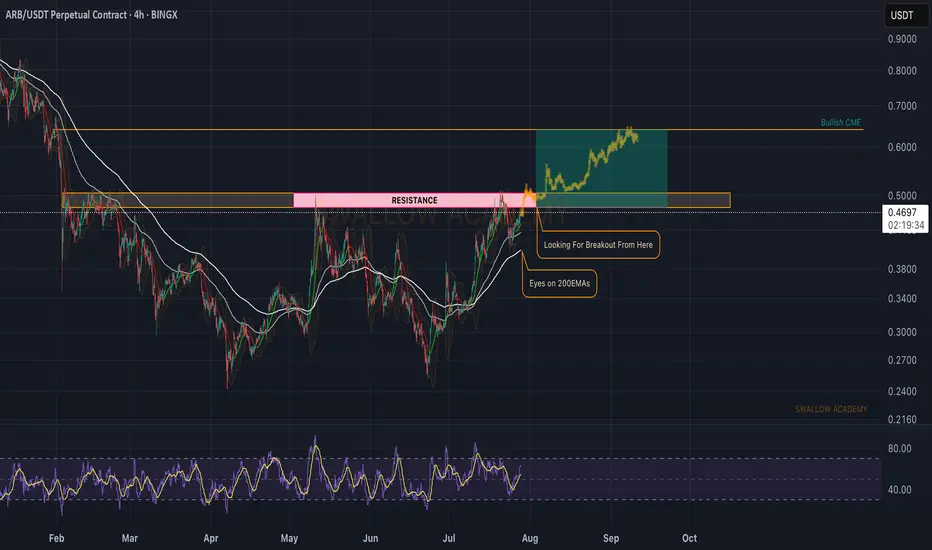
Arbitrum (ARB): Approaching Major Resistance ZoneARB is getting closer and closer to that resistance zone, which we are looking to be broken in order to give us that proper BOS and opportunity for movement to fill that bullish CME gap!
Swallow Academy
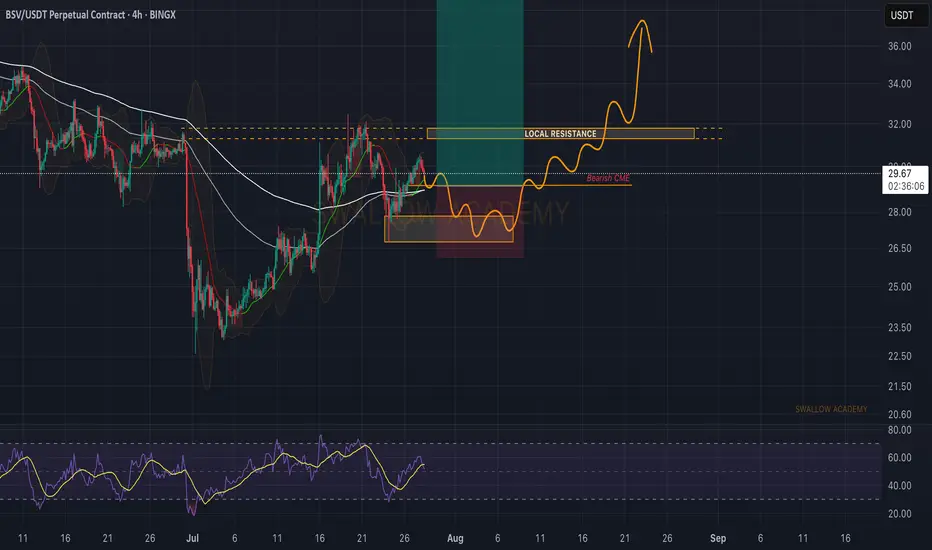
Bitcoin SV (BSV): Expecting Smaller Correction Before BreakoutBSV is going to have a smaller correction most likely which should fill the Bearish CME gap and give us a potential accumulation that we need to breakout from local resistance, which then would open us a potential 50% movement to upper zones.
Swallow Academy
XAUUSD - market structureXAUUSD - market structure, XAUUSD - market structure , use risk and trade managment, this is not FULL analysis
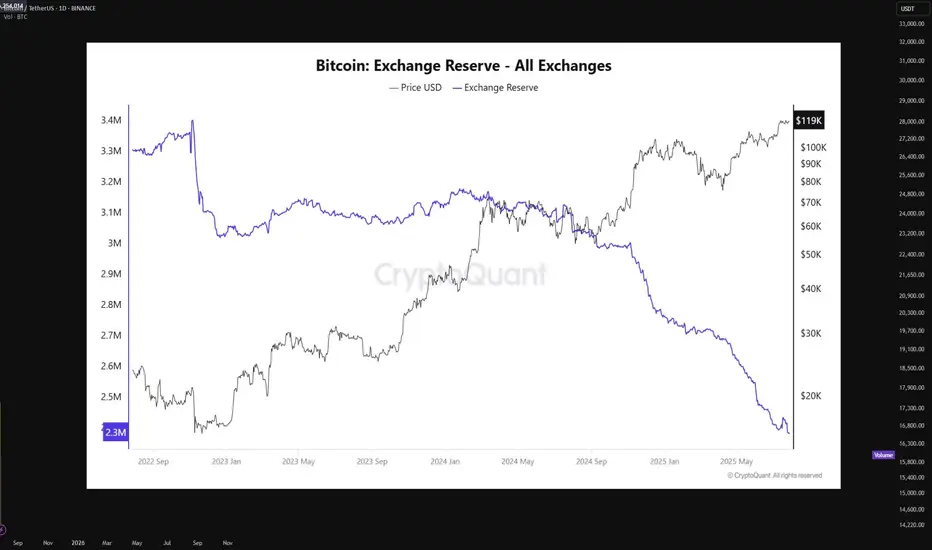
Bitcoin supply on exchanges is at an all-time lowBitcoin is currently undergoing a textbook supply-side shock, a rare phenomenon that historically precedes vertical price expansion. The latest on-chain data from CryptoQuant shows that BTC exchange reserves have declined to an all-time low of just 2.3 million BTC, down from approximately 3.3 million BTC in mid-2022. This marks a 27% drop in immediately sellable supply — a net outflow of over 900,000 BTC from centralized exchanges.
This trend signifies that a substantial portion of BTC holders have opted for long-term self-custody, indicating growing conviction among market participants. When coins leave exchanges, they are typically sent to cold wallets for long-term storage, effectively removing them from the liquid supply pool. This restricts the ability for large-volume sell orders to materialize, especially during rapid price appreciation, thereby creating a supply squeeze.
In parallel, the price of Bitcoin has risen steadily, now trading around $119,000, with a clear break above prior resistance clusters in the $75K–$85K zone. The price has shown strong momentum divergence against exchange reserves, with reserves falling while price rallies, a bullish continuation signal. This decoupling indicates aggressive spot accumulation in the background, often a signal of institutional or whale-level interest.
Technically, BTC is also showing signs of a parabolic structure forming, supported by rising volume on upward moves and decreasing volume on retracements — confirming bullish market structure. Price action has respected key Fibonacci levels throughout the rally, and is currently pressing into a price discovery phase with minimal historical resistance above.
The macro backdrop further supports this narrative. With Bitcoin ETFs now live and facilitating regulated inflows, capital has increasingly favored BTC as a store-of-value hedge amid fiat debasement and monetary policy uncertainty. Combined with the 2024 halving, which cut block rewards from 6.25 to 3.125 BTC per block, new supply issuance has halved, while demand remains elevated.
When supply dries up — as it clearly is — and demand persists or increases, price must equilibrate higher. This is a fundamental economic principle now playing out in real-time. The current environment mirrors late 2020 to early 2021, when a similar supply drop from exchanges preceded Bitcoin’s rally from $20K to $64K.
In summary, Bitcoin is entering a phase of constrained supply coupled with aggressive demand, pushing the asset toward price discovery territory. With on-chain reserves at historic lows, minimal overhead resistance, and strong macro alignment, the technicals now point to a structurally bullish setup.
If this trend persists, a sustained breakout beyond $120K could trigger a feedback loop of FOMO-driven spot bids, further deepening the supply shock and accelerating the next leg of the bull cycle.

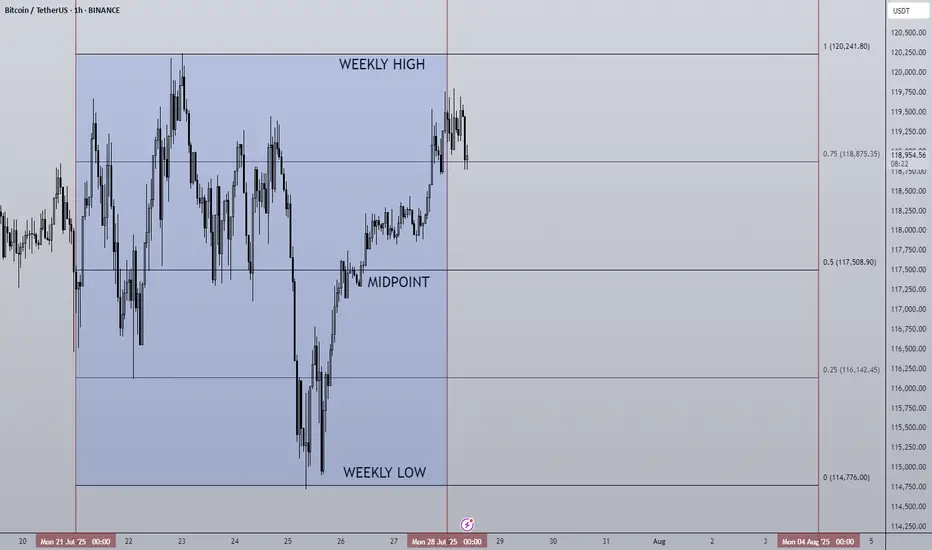
28/07/25 Weekly OutlookLast weeks high: $120,241.80
Last weeks low: $114,776.00
Midpoint: $117,508.90
As we approach the end of the month BTC continues to trade sideways during a cooling off period as altcoins finally take the stage. Last week Bitcoin saw a relatively flat net inflow via ETFs of $72m, ETH on the other hand posted the second largest net inflow week ever at $1.85B! The concentration has certainly shifted...
This IMO is still a very bullish structure for BTC, very shallow pullbacks being bought up/absorbed by still happy to purchase at these levels. As long as this continues altcoins have a strong base to continue growing on, if BTC breaks structure and price accepts below ~$110,000 then the altcoin rally will be over for now I believe.
This week some major altcoins are set to reach HTF resistance areas, ETH has already tagged $4,000 which looks to be a battleground level of major importance.
TOTAL2 which is the combined market cap of all altcoins is currently ~8% from the highs, keeping this in mind for where altcoins may run out of steam...
Good luck this week everybody!
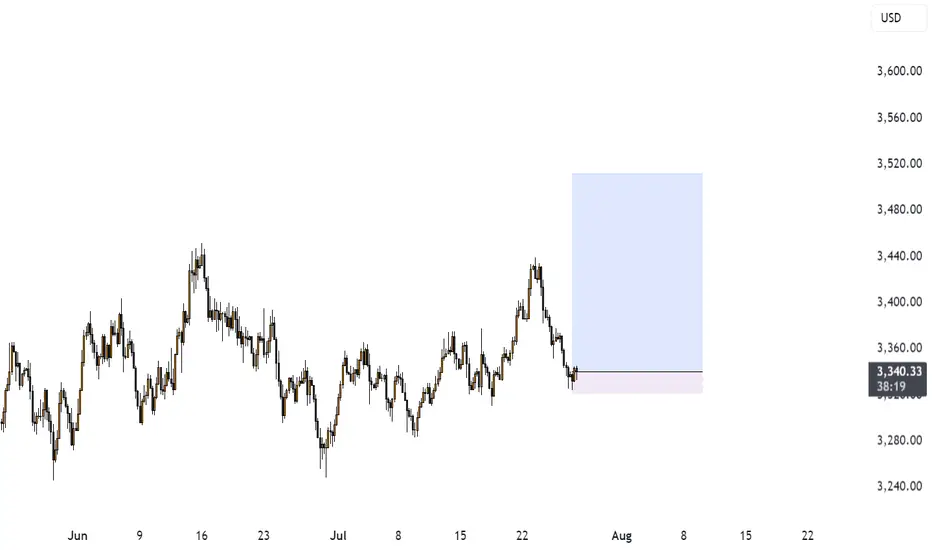
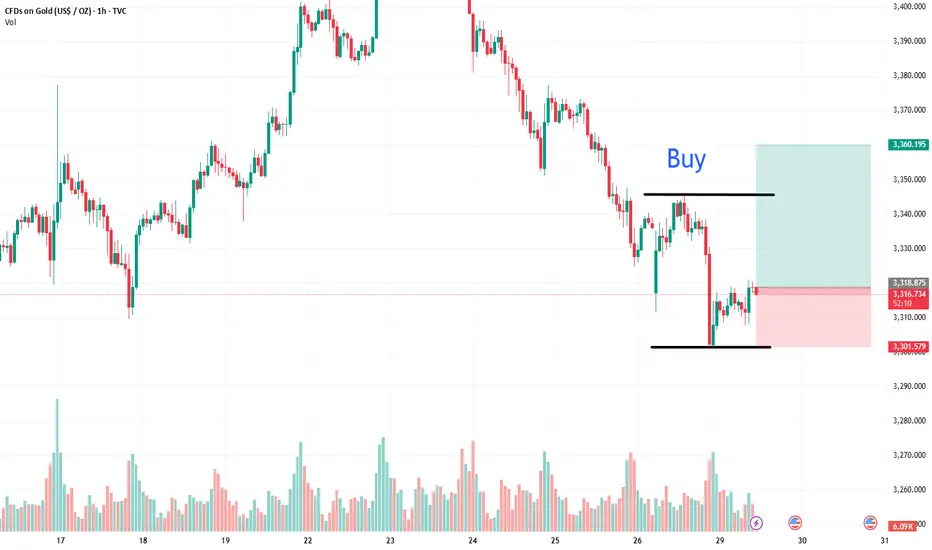
7.29 Gold 1-hour bottom signal appearsIn the short term, we see the daily line as the range of 3301-3345, and the current price is showing a volatile rebound, so we have to buy on dips. Then 3306-08 is the long point, but the price has risen in the morning, so the long position should be around 3310-12 in advance. If it falls below 3301 during the day, it will continue to test the 3292-3282 line downward. Similarly, if it breaks above 3345 during the day, it will continue to test 3372 upward and show a rebound trend in the next few days.
Will gold continue to fall on July 29:
Comprehensive analysis of the gold market and trading strategy recommendations
News analysis
Short-term support factors
Weakened US dollar: The market is in a wait-and-see mood before the Fed's interest rate meeting, and the US dollar bulls are temporarily suspended, providing support for interest-free assets such as gold.
Safe-haven demand: Policy uncertainty (such as the Fed's interest rate decision) may trigger a short-term return of funds to gold.
Repressive factors
Trade situation easing: The US-EU tariff agreement, US-Japan and US-China trade progress boost risk appetite and weaken the safe-haven appeal of gold.
Bull-bear game: Gold is currently at a balance between "macro game" and "technical adjustment", and needs to wait for the FOMC statement and economic data (GDP, PCE) to guide the direction.
Technical analysis
Long-term trend (monthly/weekly)
Top signal appears: 3 consecutive months of long upper shadows (April-June). If the long upper shadow is closed again in July, it may confirm that the bears are dominant, and the market may drop to the 3000-2950 area in the future.
Key resistance: 3400-3500 area is a historically strong pressure. Even if the Fed cuts interest rates to stimulate the rise, it may form a "lure to buy" and then reverse.
Short-term key position (daily/4 hours)
Bull-short watershed: 3350 is the short-term strong and weak boundary. If it breaks through, it will look up to 3370-3405; if it is under pressure, it will look down to 3330-3290.
Oscillation characteristics: The recent long-short continuity is poor (such as last week's sharp rise and then a sharp drop), so be wary of repeated washes.
Today's operation strategy
Short-order opportunity
Entry area: 3330-3340 (aggressive investors can arrange in batches), stop loss above 3350.
Target position: 3290-3280, look at 3245 after breaking down.
Long-order opportunity
Pullback support: 3290-3280 light position to try long, stop loss below 3270, target 3310-3320 (short-term rebound).
Breakthrough follow-up
Break above 3350: Wait and see if it is a false breakthrough. If it stabilizes, you can buy short-term to 3370-3405 (need to cooperate with the Fed's dovish signal).
Break below 3280: Be cautious when chasing shorts, avoid low-level sweeps, and pay attention to the support of 3245.
Risk warning
Federal Reserve decision: If the interest rate is cut but the "hawkish expectations" are released (such as the subsequent suspension of interest rate cuts), gold may rise and fall.
Data impact: If GDP/PCE is stronger than expected, it may strengthen the US dollar and suppress gold prices.
Summary: At present, gold is in a volatile bearish pattern. It is recommended to sell short at the rebound high as the main trading idea, and strictly stop loss. Conservatives can wait for the trend to become clear after the Fed's decision before making a layout.
DXY: USD Flexes Muscle - Pairs SlideFriday, July 25, 2025
The foreign exchange markets are experiencing a pronounced USD bullish session this morning, with the US Dollar Index (DXY) showing robust gains of +0.35% while simultaneously pressuring all major currency pairs into negative territory. The Japanese Yen (JPY) is bearing the brunt of this dollar strength, currently registering losses between -0.4% to -0.66% across JPY pairs. This market behavior suggests traders should pay particularly close attention to DXY dynamics, as its movements will likely dictate price action across all major currency pairs in today's session.
Technical Perspective: DXY at Critical Inflection Point
A detailed examination of the Dollar Index reveals several compelling technical factors that market participants should consider:
1. Weekly Demand Zone Reaction
- The DXY has demonstrated a strong rejection from a significant weekly demand area
- The subsequent bullish spike indicates potential continuation of upward momentum
- This price action suggests institutional buyers are defending this key level
2. Commitment of Traders (COT) Report Insights
Non-commercial traders (typically hedge funds and speculators) have increased their positions from a bottom level not seen since June 2021 meanwhile the Commercial traders (often corporations hedging FX exposure) show opposing extreme positioning. This stark divergence between trader categories often precedes significant market moves
3. Seasonal Patterns Favor USD Strength
- Historical seasonal analysis indicates the current period typically supports dollar appreciation
- The combination of technical and seasonal factors creates a potentially powerful bullish setup
✅ Please share your thoughts about DXY in the comments section below and HIT LIKE if you appreciate my analysis. Don't forget to FOLLOW ME; you will help us a lot with this small contribution.

USD/CAD - 6C1! : Trade update FundamentalThe US dollar index (DXY) gained strength against major currencies on Monday following a landmark trade agreement between the United States and the European Union. During the meeting in Scotland on Sunday, President Donald Trump and European Commission President Ursula von der Leyen announced a new trade framework, which includes a 15% import tariff on EU goods—half of the 30% rate Trump had initially threatened to impose starting August 1.
The DXY opened higher at the start of the week, and it’s clear that most currencies are likely to see a decline in response. This trend also extends to pairs like the 6C1! (USDCAD), where the USD has been increasing its long positions. Last week, non-commercial traders added to their holdings, while commercial traders remain at their highest levels since 2021. Based on this setup, we are maintaining a bullish outlook and expect the continuation of our long position strategy.
Previous Idea :
✅ Please share your thoughts about USD/CAD in the comments section below and HIT LIKE if you appreciate my analysis. Don't forget to FOLLOW ME; you will help us a lot with this small contribution.

THEUSDT Forming Bullish PennantTHEUSDT is showing a highly promising structure, currently consolidating within a classic bullish pennant pattern. This type of formation typically follows a strong upward impulse, where price enters a phase of tight consolidation before potentially continuing its move higher. With strong volume observed throughout the recent price action and a well-defined pennant forming, the setup is aligning for a high-probability breakout to the upside.
Technical traders are paying close attention to this chart due to the textbook nature of the pattern and the potential for an explosive move. Bullish pennants are continuation patterns, and when combined with increasing volume and market interest, they often lead to powerful rallies. With the current market momentum and rising interest from investors, a breakout from this consolidation zone could trigger a 90% to 100% surge in the coming sessions.
Fundamentally, THE token has been attracting attention from both retail and institutional participants, thanks to its unique position in the Web3 and AI ecosystem. This renewed focus is not just technical but also driven by growing community engagement and strategic developments that hint at long-term sustainability. Investors looking for altcoins with strong upside potential are beginning to position early.
With the breakout point approaching, THEUSDT could soon confirm its bullish bias. Keep an eye on volume spikes and clean breaks above resistance lines to validate the move. If confirmed, this could be one of the top-performing setups in the current market cycle.
✅ Show your support by hitting the like button and
✅ Leaving a comment below! (What is You opinion about this Coin)
Your feedback and engagement keep me inspired to share more insightful market analysis with you!

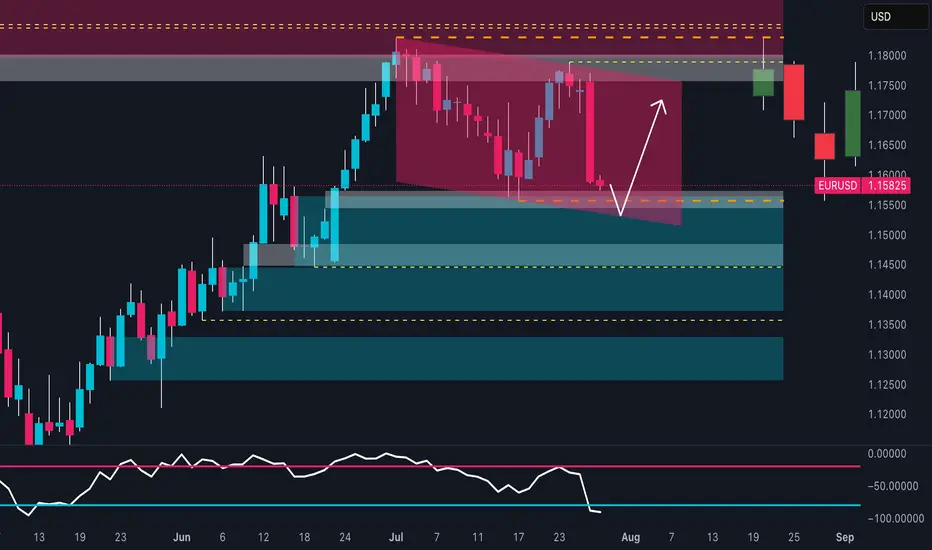
EUR/USD at a Turning Point:Rally or Trap for the Bulls?📉 Technical Analysis
Price has decisively broken out of the descending channel highlighted in recent weeks. The weekly support zone between 1.1540 – 1.1580 is holding, triggering a significant technical reaction. The weekly RSI has entered oversold territory, suggesting a potential short-term reversal.
Key Support: 1.1530–1.1580 (currently reacting)
Key Resistance: 1.1720–1.1780 (inefficiency & supply zone)
Base Case: Potential rebound toward 1.1720–1.1750 before next structural decision
🧠 Sentiment Analysis
82% of retail traders are long, with an average entry at 1.1635
Only 18% are short, a clear minority
This extreme imbalance suggests downside pressure may persist to flush out weak long hands before a genuine reversal takes place.
📊 COT (Commitment of Traders)
USD Index:
Non-Commercials increased both long (+663) and short (+449) positions → uncertain stance but slight USD strengthening
EUR Futures:
Non-Commercials increased long (+6,284) and short (+8,990) positions, but net increase favors the bears
This shift signals a bearish turn in sentiment among large speculators, indicating short-term downward pressure.
📈 Seasonality
In July, EUR/USD historically tends to rise, but:
This year’s price action is underperforming the seasonal pattern, showing relative weakness
August is historically flat to slightly bearish
Seasonality does not currently support a strong bullish continuation
✅ Strategic Conclusion
Current Bias: Bearish-neutral (with short-term bullish bounce expected)
A technical rebound toward 1.1720–1.1750 is likely (liquidity void + RSI bounce + retail imbalance)
However, 1.1720–1.1750 is a key supply zone to monitor for fresh shorts, in line with:
Dollar-supportive COT data
Overcrowded long retail positioning
Weak seasonal context
🧭 Operational Plan:
Avoid holding longs above 1.1750 without macro confirmation
Monitor price action between 1.1720–1.1750 for potential short re-entry
Clean breakout above 1.1780 → shift bias to neutral/bullish
XAUUSD Selling Expecting Movement Buy Zone Activated after rejection from resistance
First Target 3310.50
Final Target 3275.50
The bullish breakout scenario remains valid as long as price holds above the lower channel boundary. A clean break and retest of the current structure could provide further confirmation for long entries.
Key Notes
Watch for volatility near marked U.S. data events
Maintain tight risk management and monitor for rejection candles near target zones

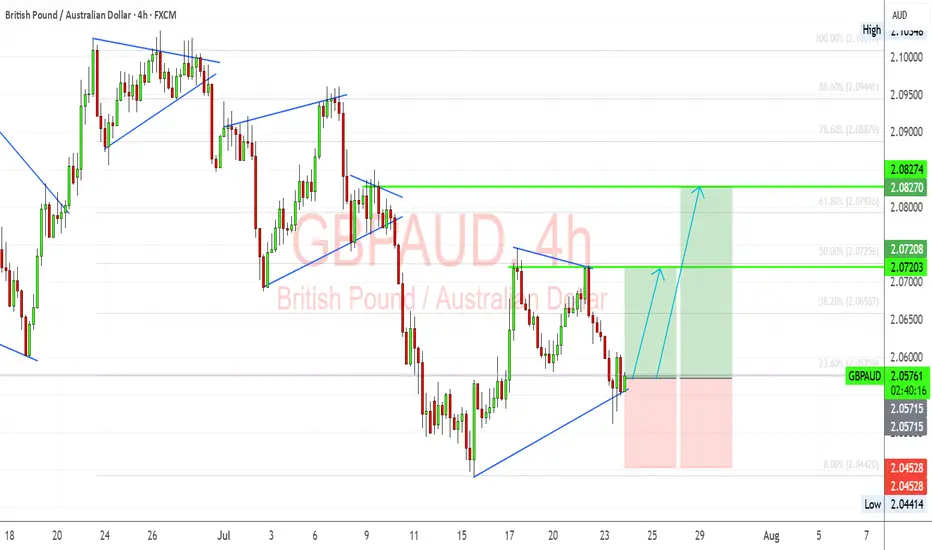
GBP/AUD Trade Setup – Bullish Flag Breakout in PlayGBPAUD has formed a clean bullish flag structure after a significant impulsive move upward. Following the correction, we’re now testing breakout levels with clear Fibonacci confluence and bullish structure support around 2.0560. I'm anticipating a push toward the next resistance levels if buyers defend this trendline.
🔎 Technical Highlights (My View):
Bullish Flag Pattern: The corrective flag has broken to the upside and is being retested. This suggests a possible continuation of the bullish trend.
Fibonacci Support: Price bounced near the 23.6% retracement of the previous bullish leg, which acts as a minor but effective support in trending moves.
Bullish Trendline Holding: The ascending trendline from the July lows continues to act as dynamic support. This shows sustained buyer interest.
Target Zones:
TP1: 2.0720 – aligns with 50% retracement and recent structure.
TP2: 2.0827 – aligns with 78.6% retracement and past resistance.
SL: Below 2.0450 to invalidate the setup.
🏦 Fundamental Context:
GBP Strength: The Bank of England remains more hawkish than the RBA. UK inflation data remains sticky, and traders are still pricing in the potential for another hike if services inflation remains elevated.
AUD Weakness: AUD is under pressure due to soft labor market data and declining commodity demand from China. RBA minutes also struck a cautious tone, which weighs on the Aussie.
China Risk: AUD is sensitive to Chinese sentiment. Current trade and tariff tensions are adding indirect bearish pressure to the AUD.
⚠️ Risks to My Setup:
If Aussie labor or CPI data surprises to the upside, AUD could regain strength.
UK economic data deterioration (e.g., services PMI, wage inflation) could weaken GBP.
Break below 2.0450 would invalidate the bullish setup and suggest potential range continuation.
📅 Upcoming Catalysts to Watch:
UK Retail Sales – A strong print supports GBP continuation.
AU CPI (Trimmed Mean) – Any upside surprise could limit AUD downside.
China Industrial & Services PMI (if released soon) – indirect AUD mover.
⚖️ Summary – Bias & Trade Logic
I’m currently bullish GBP/AUD, expecting a continuation of the prior uptrend now that price has broken and retested the flag structure. Fundamentally, GBP is supported by relatively hawkish BoE expectations, while AUD remains pressured by RBA caution and China-linked macro weakness. My bias stays bullish as long as the trendline holds and Aussie data doesn’t surprise significantly.
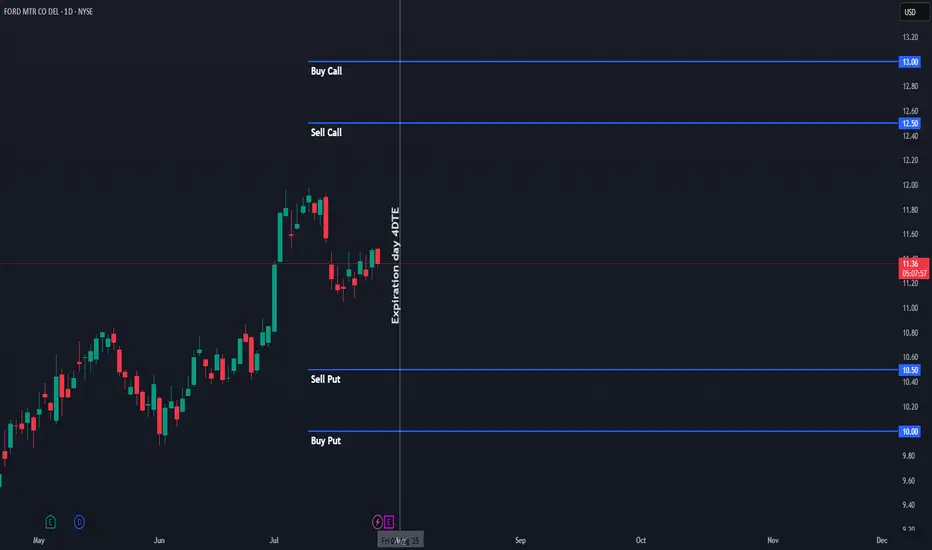
$F Iron Condor – Aug 1st Expiration | $7 Credit | I’m opening an Iron Condor on Ford ($F) with expiration on Friday, August 1st, 2025. The trade is based on the daily chart, using visible support/resistance levels to define the range. I selected strikes with approximately 0.15 delta on each side, giving the setup a high probability of success.
🔹 Total premium collected: $7 per contract
🔹 Stop loss: Defined at 50% of the premium collected (~$3.50)
🔹 Trade logic: We want $F to stay within the range throughout the week to let theta do its job.
🔹 Exit plan: If the price approaches either short strike, I will consider exiting at break-even or take a controlled loss.
This is a non-directional options strategy designed to benefit from time decay and low volatility. The setup is ideal for sideways price action, with no major catalysts expected during the week.
🎯 Target: Full profit if price stays within range until expiration.
❌ Stop: Exit if the price threatens any wing – max loss capped at 50% of the premium received.
This trade combines high probability with well-defined risk and is perfect for consistent weekly income when the market shows indecision or chop.
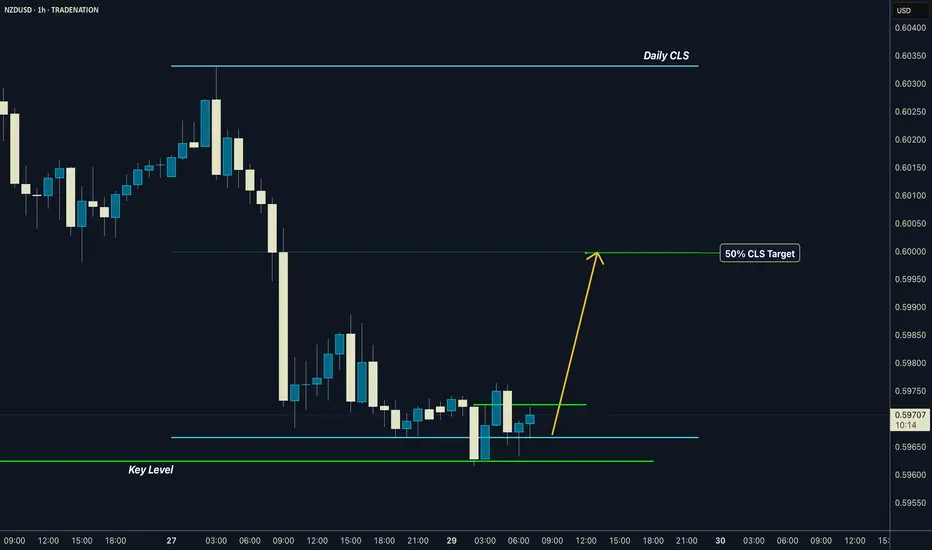
NZDUSD | Daily CLS I Model 1 I 50% CLS TargetHey, Market Warriors ⚔️
Fresh outlook drop — if you’ve been riding with me, you already know:
🎯My system is 100% mechanical. No emotions. No trend lines. No subjective guessing. Just precision, structure, and sniper entries.
🧠 What’s CLS?
It’s the real smart money. The invisible hand behind $7T/day — banks, algos, central players.
📍Model 1:
HTF bias based on the daily and weekly candles closes,
Wait for CLS candle to be created and manipulated. Switch to correct LTF and spot CIOD. Enter and target 50% of the CLS candle.
For high probability include Dealing Ranges, Weekly Profiles and CLS Timing.
Analysis done on the Tradenation Charts
Disclosure: I am part of Trade Nation's Influencer program and receive a monthly fee for using their TradingView charts in my analysis.
Trading is like a sport. If you consistently practice you can learn it.
“Adapt what is useful. Reject whats useless and add whats is specifically yours.”
David Perk aka Dave FX Hunter
💬 Don't hesitate to ask any questions or share your opinions
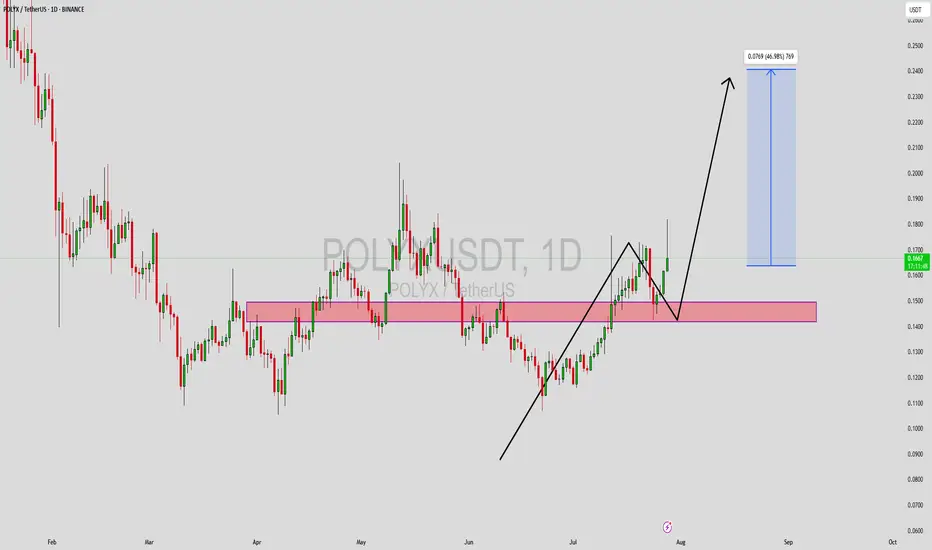
POLYXUSDT Forming Falling WedgePOLYXUSDT is currently showcasing a falling wedge pattern, a well-known bullish reversal setup that typically precedes a strong upward breakout. The chart structure reflects tightening price action with lower highs and lower lows, forming a wedge that has now broken to the upside. This pattern, coupled with a good spike in trading volume, supports the probability of a trend reversal. Price action has also respected the previous demand zone, reinforcing the likelihood of a sustained bullish movement.
Traders are increasingly turning their attention to POLYXUSDT due to its historical tendency to rally after consolidation phases like this. With a potential gain of 30% to 40% projected from the current levels, it offers an attractive setup for swing traders aiming to catch early entries before broader market participation. The chart also suggests that the token has reclaimed key support-turned-resistance zones, a critical bullish indicator in technical analysis.
The sentiment surrounding POLYX is improving as the broader altcoin market shows signs of recovery. As regulatory clarity improves and blockchain adoption expands, projects like Polymesh—which POLYX is native to—gain stronger traction. The falling wedge breakout, along with healthy volume and favorable macro signals, indicates that POLYX could be poised for a solid mid-term rally. It remains important for traders to watch retests of the breakout zone as confirmation before scaling in.
This technical opportunity could evolve into a strong move if bullish momentum continues to build across the market. Monitor volume surges and daily candle confirmations as catalysts to further validate this potential breakout trade.
✅ Show your support by hitting the like button and
✅ Leaving a comment below! (What is You opinion about this Coin)
Your feedback and engagement keep me inspired to share more insightful market analysis with you!
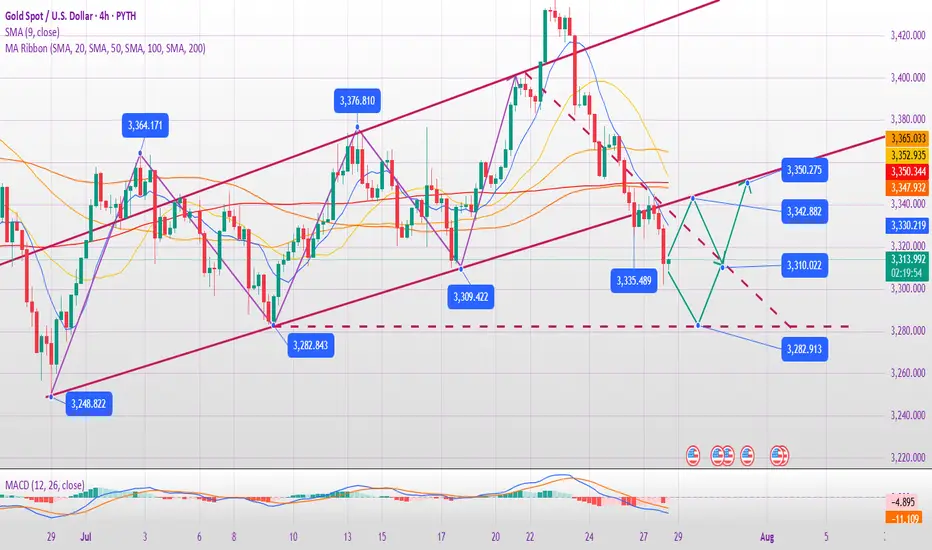
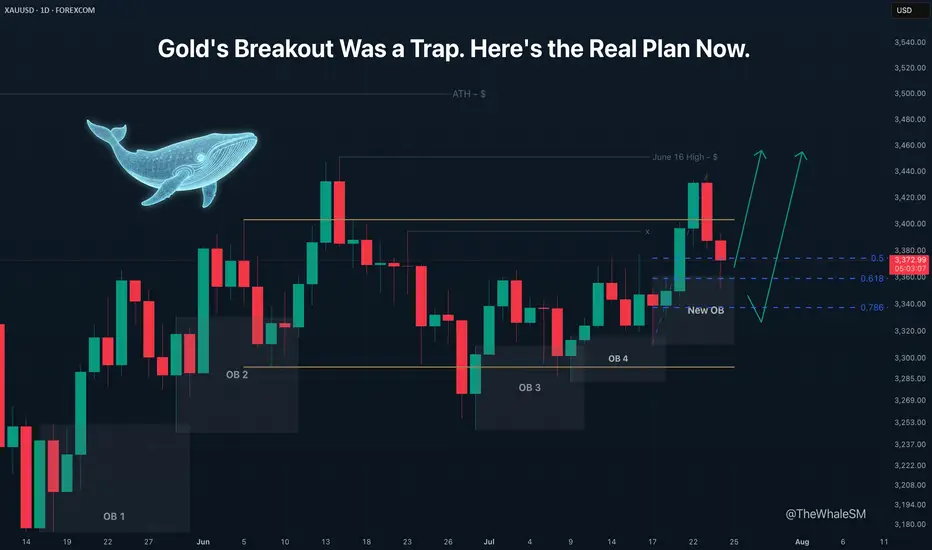
Gold's Breakout Was a Trap. Here's the Real Plan Now.Gold has made its next move, and it was quite sharp. I was expecting a smoother correction with a return to the manipulation zone, but Gold followed a different scenario, which I described at the end of my last gold analysis:
Gold has practically confirmed its breakout from the global range it has been in since the beginning of June. The only thing that could prevent this is a complete engulfing of the bullish daily candle that broke the upper boundary of the range by a bearish candle, but I consider this an unlikely scenario.
The closed red daily candle, which completely engulfed the preceding bullish one, showed that the move was, in fact, an internal liquidity sweep . The price has not yet managed to break out of the range. Therefore, when I wrote "Gold has practically confirmed its breakout from the global range" , the daily candle had not yet closed, and the price had not secured its position above the range's upper boundary.
Essentially, it's not important how the price arrives at a Point of Interest (POI) . What matters is what we have now: the price has mitigated a manipulation in the form of a new daily order block that was formed inside the range.
Although the middle of a range is a highly unpredictable area for price movement, and I almost never consider it for entries, in this case, there is a strong exception that allows us to consider longs from this order block. The reason for this exception is the bullish order flow on the daily structure, which I have mentioned several times, and the ascending daily structure within the range. This structure allows us to identify the start of the last impulse and draw Fibonacci retracement levels, which will serve as an additional condition for our potential long setup. We can now see that the price has reached the 61.8% Fib level and has shown a reversal reaction to it. To see more precisely if there is a potential entry point, let's switch to the 4H timeframe.
On the 4H chart, we see that the 61.8% level has held, and we can look for entry confirmation on a lower timeframe. The 4H timeframe also shows that the liquidity sweep created a supply zone , which will act as resistance on the path of the next attempt to break out of the range. Due to this zone, considering a long from the current position is not optimal because the risk-to-reward ratio is too small. Furthermore, the price could reject from this supply zone and continue its correction to the next level, the 78.6% Fib level . To find an entry with a more acceptable R:R, let's move to the lower timeframes.
Two Potential Long Scenarios
SCENARIO 1: Entry from the 15M Demand Zone or 15M OB
The 15M timeframe shows a break of the 15M structure and the formation of manipulations in the form of a demand zone and a 15M order block within it.
► Setup Condition: I will consider a long position upon the mitigation of one of these manipulation zones and a clear reversal reaction from it. If the price continues to move up from the current levels, I will not enter due to the large stop loss required and the suboptimal R:R to the nearest resistance.
► Invalidation: A break below these support zones on the lower timeframe will invalidate this scenario.
SCENARIO 2: Entry from the 78.6% Fib Level
This scenario becomes active if the first one fails.
► Setup Condition: If the price breaks the 15M supports, I will watch for its interaction with the 78.6% Fib level . For a potential entry, this level must hold, show a reversal reaction, and be followed by confirmation on a lower timeframe.
► Invalidation: A decisive close below the 78.6% Fib level.
~~~~~~~~~~~~~~~~~~~~~~~~~~~~~~~~~~~~~~~~~~~~~~~~~~~~~~~~~~~~~~~~~
The principles and conditions for forming the manipulation zones I show in this trade idea are detailed in my educational publication, which was chosen by TradingView for the "Editor's Picks" category and received a huge amount of positive feedback from this wonderful, advanced TV community. To better understand the logic I've used here and the general principles of price movement in most markets from the perspective of institutional capital, I highly recommend checking out this guide if you haven't already. 👇
P.S. This is not a prediction of the exact price direction. It is a description of high-probability setups that become valid only if specific conditions are met when the price reaches the marked POI. If the conditions are not met, the setups are invalid. No setup has a 100% success rate, so if you decide to use this trade idea, always use a stop-loss and proper risk management. Trade smart.
~~~~~~~~~~~~~~~~~~~~~~~~~~~~~~~~~~~~~~~~~~~~~~~~~~~~~~~~~~~~~~~~~
If you found this analysis helpful, support it with a Boost! 🚀
Have a question or your own view on this idea? Share it in the comments. 💬
► Follow me on TradingView to get real-time updates on THIS idea (entry, targets & live trade management) and not to miss my next detailed breakdown.
~~~~~~~~~~~~~~~~~~~~~~~~~~~~~~~~~~~~~~~~~~~~~~~~~~~~~~~~~~~~~~~~~
BTCUSD SHORTBTCUSD 6RR short | 15s entry | 5m confirmation | 4H trend bias
Caught the shift as 5m structure broke, creating a flip liquidity grab for the zone above — making it even stronger.
4H wasn’t clean, but the imbalance below gave full reason for lower prices — and that’s exactly what birthed the short.
Zero emotion. Risk defined.
Just posting what works.

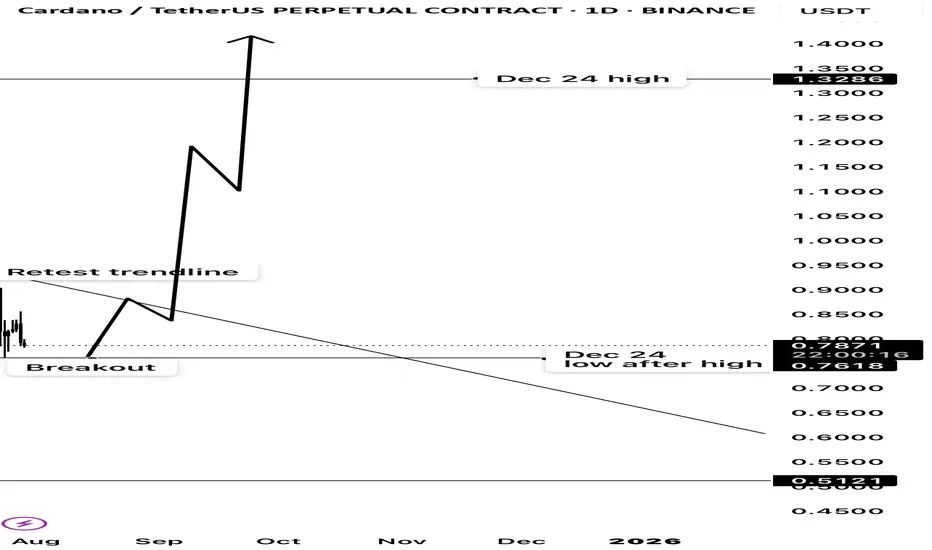
Cardano potential multi month breakout ?From december’s high cardano has been in a downtrend since.
The first low it made after the top from december had been a massive resistance.
It has risen from its 2025 lows and broke that resistance from all the way of december and retested its downtrend.
My take is, once it breaks that trendline it will go higher than the top of dec 2024.
What goes around comes full CRCLFor the record, I bought in at ~$220 and looking to exit to ethical reasons. I believe that this stock will reach over $400USD for the end of the year but with every l opportunity left off for a greater cause, there will always be a greater reward.
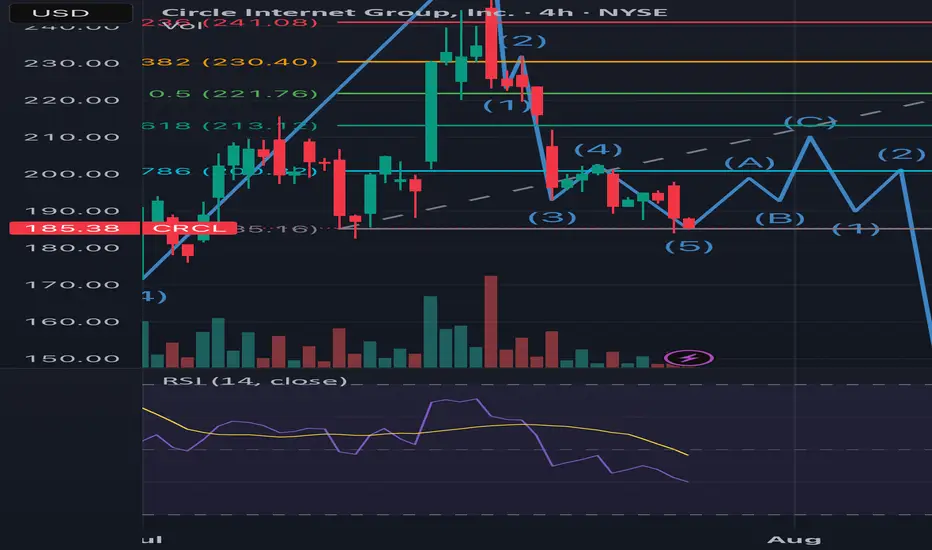
1. Notice the end of the first 5 wave Elliot Impulse coincides with the passing of the GENIUS bill. Wave 3 peak was the ATH and wave 5 was the Friday peak of around $262.
2. We’ve entered the correction where sellers are looking to close from the hype
Wave 1 of the correction was the sell off from the wave 5 peak.
From the chart you can see the 3 wave correction is beginning with wave 1 of the 3 coming to an end.
Good news if you want to swing it to 213, this would be a good entry. Bad news if you want ito t hold it for ATH as it means you’d have to bear the third wave of the correction phase (gap fill ~$216), from there I’m expecting the huge sell off post earnings and FED expectations.
However, after retracing a new cycle will emerge led by major catalysts like the CLARITY Bill, CIRCLE’s bank charter application, USDT diminishing presence in the US and the adoption of USDC even possibly making it the standard stablecoin for all US crypto activity, DE-Fi growth and tradfi participation and growth in their MMF and remittance segments. This will kick start a new run where the highs of $400 will be achieved.
So target next high (earnings time) is $213. I assume price will not go below this region. But a recommended sell until q4
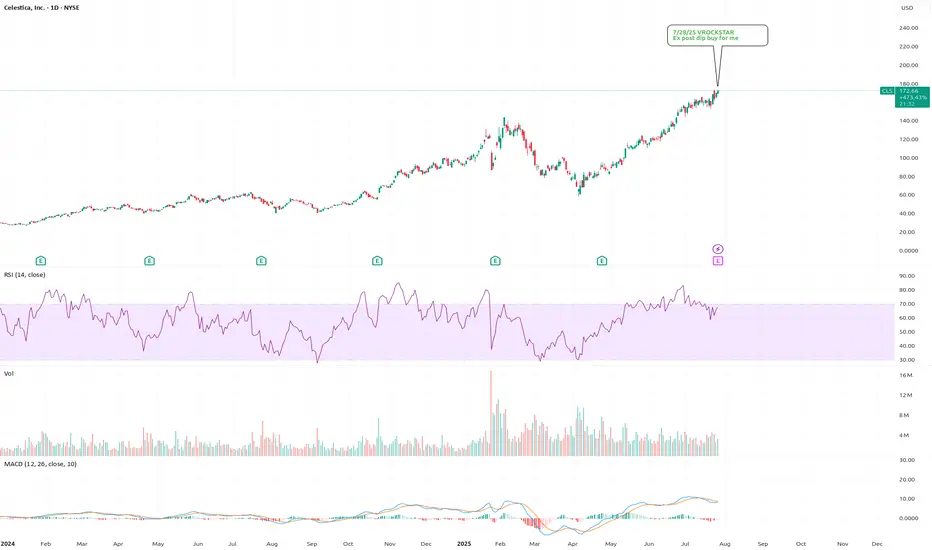
7/28/25 - $cls - Ex post dip buy for me7/28/25 :: VROCKSTAR :: NYSE:CLS
Ex post dip buy for me
- reminds of NYSE:GEV , great product, backlog, growth etc. etc.
- valuation at 2.5% fcf yield, low leverage and mid teens EBITDA for teens EBITDA growth++ is v reasonable
- don't really have an edge here, except to say.. i think any "miss" will quickly get bot and that's where i'd participate
- otherwise i think it's probably a beat/ should head higher all else equal
V