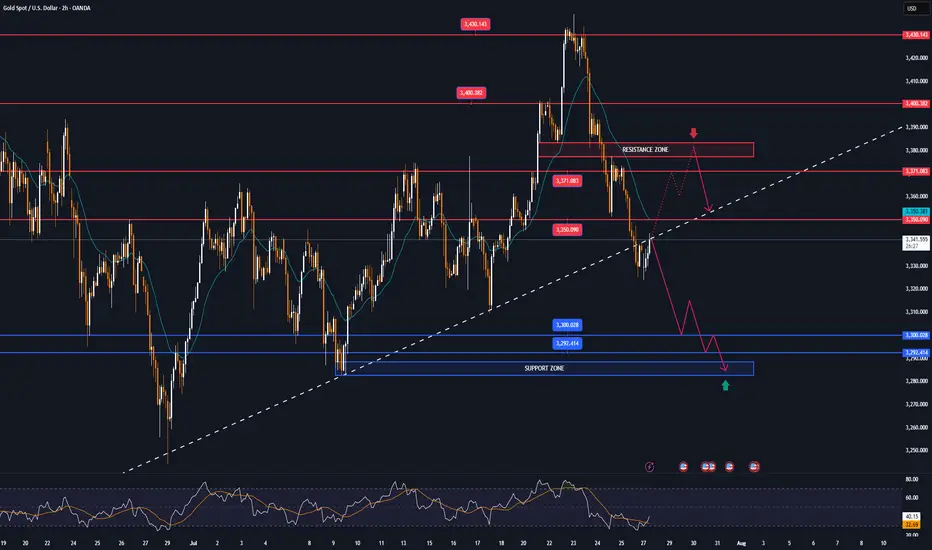
Gold Could Show there Potentially BearishGold is currently consolidating, but a downtrend range is forming based on the prevailing market setup. After erasing early gains, XAUUSD stabilized near 3340 on Monday, with downside pressure largely influenced by a stronger U.S. Dollar following the announcement of the US-EU trade agreement.
Price rejected sharply from the 3340 resistance zone, suggesting continued bearish momentum. A minor pullback was seen after testing the upper boundary, with sellers regaining control near resistance. Traders are closely watching the 3350–3362 resistance zone, where another rejection could fuel a fresh downside move A confirmed breakdown below 3312 could open the path toward 3282 in the short term.
Ps: Support with like and comments for more better analysis.
Community ideas

GBPUSD BUY TIGER SETUP LOOOOOOOOOOOONGwelcome
we have strong mitigation order block on time frame weekly and daily
and on 4H we have break downtrend and retest on it
and we in well discount area
and we have demand on high time frame
so this is good idea for buying
Don't forget to follow me
so that get refresh analysis

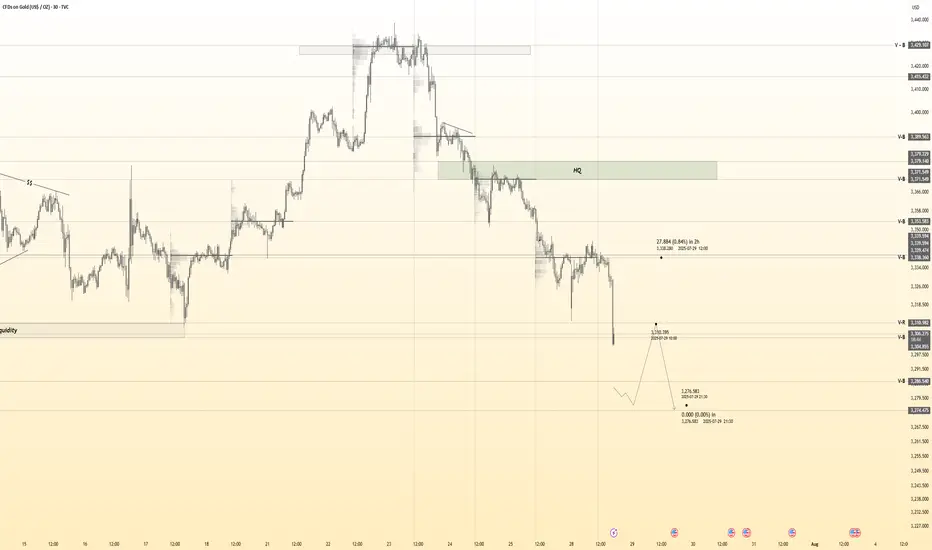
Gold 30Min Engaged ( Bearish Break Out Entry Detected )Time Frame: 30-Minute Warfare
Entry Protocol: Only after volume-verified breakout
🩸Bearish From now price - 3306
➗ Hanzo Protocol: Volume-Tiered Entry Authority
➕ Zone Activated: Dynamic market pressure detected.
The level isn’t just price — it’s a memory of where they moved size.
Volume is rising beneath the surface — not noise, but preparation.
🔥 Tactical Note:
We wait for the energy signature — when volume betrays intention.
The trap gets set. The weak follow. We execute.
Gold Eyes Rebound Toward $3,438 TargetGold (XAU/USD) is trading near $3,314, approaching support along the rising trend line. A potential bounce could target the $3,438 resistance area, as marked in the chart.

GOLD falls on USD and trade talks, big data weekSpot OANDA:XAUUSD ended its rally this week on Friday (July 25) and closed down nearly 1%, mainly affected by the recovery of the US Dollar TVC:DXY and progress in trade negotiations that weakened safe-haven demand.
DXY recovered 0.27% on Friday to close at 97.642, ending a two-week low, making gold less attractive than its direct correlation.
Earlier, news of a US-Japan trade deal and a breakthrough in US-EU talks weakened the market's demand for safe-haven assets.
For the content of the US-Japan trade deal, readers can review it in the daily publications during the past trading week.
Data and Fed Expectations
The latest US jobless claims fell to a three-month low, suggesting the job market remains solid. This gives the Federal Reserve reason to maintain interest rates at 4.25%-4.50%, despite President Trump once again pressuring Powell to cut rates.
However, in the short term, the fundamental direction of gold may need to wait for the Federal Reserve to announce more policy signals at its meeting next week.
Speculative Longs Hit High Near April Peak
Data from the U.S. Commodity Futures Trading Commission (CFTC) showed that as of the week of July 22, the speculative net long position in COMEX gold rose by 27,211 lots to 170,868 lots, the highest level since April. This shows that as gold prices fall again, buyers are still actively deploying, waiting for more guidance from policy and data.
Last Week Review and This Week’s Fundamental Outlook
Last week, gold prices initially rose and then fell. Due to risk aversion and volatility in the US dollar, gold prices surpassed the $3,400/ounce mark at the start of the week, but as trade optimism increased and profit-taking emerged, gold prices fell back, trying to stay above $3,300/ounce.
Investors will face several major events this week:
Federal Reserve policy meeting (Wednesday): Markets expect interest rates to remain unchanged, but Powell’s speech could influence market expectations for a rate cut this year.
Macro data will be released in batches: including ADP employment data on Wednesday, PCE price index on Thursday and non-farm payrolls report on Friday. These data will determine the next move of gold.
Global central bank trends: The Bank of Canada and the Bank of Japan also hold policy meetings next week. Investors will be watching to see if their policy signals cause volatility in the US dollar and gold prices.
Technical Outlook Analysis OANDA:XAUUSD
On the daily chart, gold is in a rather important position after 3 consecutive corrective declines. However, the bearish momentum still keeps gold above the base price, which is an important psychological point for the bullish expectation of 3,300 USD.
In terms of position and indicators, gold has not completely lost the ability for a bullish outlook. Specifically, gold is still in a short-term rising channel and supported by the EMA21. On the other hand, it is still supported by the horizontal support level of 3,310 USD, followed by the psychological level of 3,300 USD and the 0.382% Fibonacci retracement.
Gold will only qualify for a bearish cycle if it sells below the 0.382% Fibonacci retracement level, then the target will be around 3,246 USD in the short term, more than the 0.50% Fibonacci level.
RSI is sloping down, but has not yet crossed the 50 level, and in the current case, the 50 level acts as a momentum support for the RSI. It shows that there is still room for an increase in price, and if RSI sloping up from 50, it will provide a bullish signal with relatively wide room.
If gold rises above the 0.236% Fibonacci retracement level (3,371 USD), it will be eligible for a new bullish cycle with a target of around 3,400 USD in the short term, more than 3,430 – 3,450 USD then the all-time high.
In the coming time, in terms of position and indicators, gold still has a technical outlook leaning more towards the upside and the notable points will be listed as follows.
Support: 3,310 – 3,300 – 3,292 USD
Resistance: 3,350 – 3,371 – 3,400 – 3,430 USD
SELL XAUUSD PRICE 3371 - 3369⚡️
↠↠ Stop Loss 3375
→Take Profit 1 3363
↨
→Take Profit 2 3357
BUY XAUUSD PRICE 3303 - 3305⚡️
↠↠ Stop Loss 3299
→Take Profit 1 3311
↨
→Take Profit 2 3317
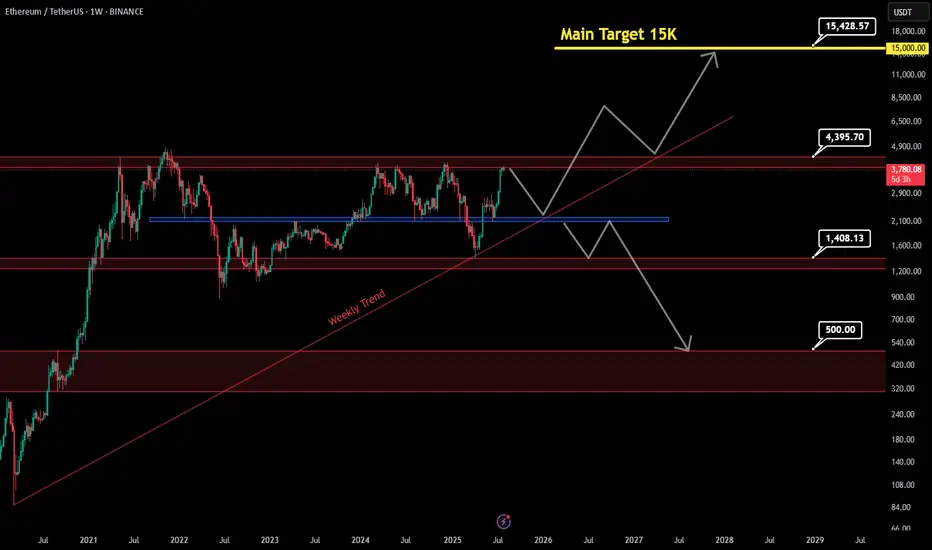
Ethereum to 15K ? or fall to 500$ !!📊 Ethereum – Long range outlook
If the price manages to break the red resistance zone above and hold above it, the path will be poised to reach the main target at $15,000, as shown by the rising arrows. If it fails, it has another opportunity to regroup buyers from the resistance at $2,228, with a very important trend that will support the upward move.
If the price fails to break the rebound from $2,227, closes this area ($2,227), and then breaks the weekly trend, we expect a sharp drop to $1,408 and even $500 in the long term.
Main Target : 15,000$
How Do Traders Use the Pivot Points Indicator? How Do Traders Use the Pivot Points Indicator?
Pivot points are a popular technical analysis tool for spotting areas where the price is expected to react, i.e. pause or reverse. Calculated using the previous day’s high, low, and close, they’re projected onto the current session to highlight potential support and resistance levels, especially useful for intraday traders.
Alongside stock charts, pivot point levels can be used in a wide variety of markets, including forex, commodities, and cryptocurrencies*. As a versatile indicator, pivot points also come in many different types. This article breaks down the definition of pivot points, the variations traders use, and how they can fit into a broader trading strategy.
A Deeper Look at Pivot Points
A common question in technical analysis is, “What is a pivot point?” Pivot points trading, or pivot point theory, is a popular technical analysis concept used in a range of financial asset classes, including stocks, currencies, cryptocurrencies*, and commodities. The indicator assists traders in gauging overall market trends and determining possible support and resistance barriers.
How to Read Pivot Points
The pivot point indicator is static—it’s an average of the high, low, and close prices from the previous trading day. It includes three levels: pivot point (P), support (S), and resistance (R). If the price is above the pivot point, it is supposed to target resistance barriers. Conversely, if it’s below the pivot, it could move to support levels. Thus, support and resistance levels serve as targets or stop-loss zones. They remain constant throughout the period, enabling traders to plan ahead.
In the EURUSD daily chart below, the price is trading above R2; therefore, market sentiment is assumed to be bullish. R3 indicates the next possible price target. Should a shift below P occur, bearishness arises, and S1 becomes the upcoming support level.
Pivots are widely used with trend indicators such as moving averages and Fibonacci tools. In the chart below, Fibonacci retracements could be used to identify intermediate levels of support and resistance within widely placed pivots.
How to Calculate Pivot Points?
There are four key types of pivots, including standard, Woodie’s, Camarilla, and Fibonacci. While there’s no need to use a pivot points calculator—they’re calculated automatically when implemented on a price chart—it is worth looking at their formulas to understand how they differ from each other.
Note the labels for the following formulas:
P = pivot point
H = high price
L = low price
C = close price
Standard Pivot Points
Traders commonly use standard pivot points. Traditional pivots (P) identify potential levels of support (S) and resistance (R) by averaging the previous trading period's high, low, and close prices.
P = (H + L + C) / 3
S1 = (2 * P) - H
S2 = P - (H - L)
R1 = (2 * P) - L
R2 = P + (H -L)
Although they are popular among traders, they can produce false signals and lead to incorrect trades in ranging markets and during periods of high volatility.
Woodie’s Pivot Points
Woodie's pivots are similar to standard pivots but include a slight modification to the calculation. In Woodie's method, the close price is assigned more weight.
P = (H + L + 2 * C) / 4
R1 = (2 * P) - L
R2 = P + H - L
S1 = (2 * P) - H
S2 = P - H + L
However, their extra sensitivity can make them less reliable during choppy markets or when the price lacks a clear direction.
Camarilla Pivot Points
Camarilla pivots use a set formula to generate eight levels: four support and four resistance. They are based on the previous day’s close and range and multiplied by a certain multiplier. The inner levels (R3 and S3) often act as reversal zones, while R4 and S4 are watched for breakouts. Still, in trending markets, the reversals can fail frequently.
R4 = C + (H - L) x 1.5
R3 = C + (H - L) x 1.25
R2 = C + (H - L) x 1.1666
R1 = C + (H - L) x 1.0833
P = (High + Low + Close) / 3
S1 = C - (H - L) x 1.0833
S2 = C - (H - L) x 1.1666
S3 = C - (H - L) x 1.25
S4 = C - (H - L) x 1.5
Fibonacci Pivot Points
Fibonacci pivot points are based on the Fibonacci sequence, a popular mathematical concept in technical analysis.
They are calculated in the same way as the standard indicator. However, the levels of support and resistance are determined by including the Fibonacci sequence with a close monitoring of the 38.2% and 61.8% retracement levels as the primary price points.
P = (High + Low + Close) / 3
S1 = P - (0.382 * (H - L))
S2 = P - (0.618 * (H - L))
R1 = P + (0.382 * (H - L))
R2 = P + (0.618 * (H - L))
Despite their popularity, Fibonacci pivots can become less reliable when the price reacts to other fundamental drivers.
Trading with the Pivot Points
Although every trader develops their own trading approach, there are common rules of pivot point trading that are expected to improve their effectiveness.
Day Trading
Day trading with pivot points is usually implemented for hourly and shorter intraday timeframes. As pivot levels are updated daily and calculated on the previous day's high, low, and close prices, this allows traders to react promptly to market changes and adjust their strategies. Some traders prefer Camarilla pivots as their calculation takes into account the volatility of the previous trading period to produce pivot levels closer to the current price.
Medium-Term Trading
When looking at a medium-term analysis, weekly pivot levels are added to four-hour and daily charts. These are calculated using the previous week's high, low, and close prices, which remain unchanged until the start of the next week.
Long-Term Trading
For longer-term analysis, traders use monthly pivots on weekly charts. These levels, gathered from the previous month's data, offer a broader picture of market trends and price movements over time.
Pivot Point Trading Strategies
The pivot points indicator is typically used in two ways – breakout and reversal trading.
Breakout Trading Strategy
The breakout approach seeks to take advantage of market momentum by entering trades when prices break above or below significant levels of support and resistance.
- Bullish Breakout. When levels P and R1 are broken, and the price closes above either, it’s more likely a rise will occur.
- Bearish Breakout. When levels P and S1 are broken, and the price closes below either, it’s more likely the price fall will occur.
Strong momentum and high volume are two critical factors needed for a solid price movement in both cases.
Trading Conditions
If a breakout is confirmed, traders enter a trade in the breakout direction. A take-profit target might be placed at the next pivot level. A stop-loss level can be placed beyond the previous level or calculated according to a risk/reward ratio. Traders continuously monitor their trades and adjust their stop-loss levels to lock in potential returns if prices move in their favour.
Reversal Trading Strategy
The reversal strategy seeks to take advantage of a slowdown in market momentum by entering trades when prices stall at significant levels of support or resistance.
- Bullish Reversal. When levels S1 and S2 are not broken and the price stalls above either, a reversal is more likely to occur.
- Bearish Reversal. When levels R1 and R2 are not broken and the price stalls below either, a reversal is expected to happen.
Note: Reversals are always confirmed by another indicator or a chart pattern.
Trading Conditions
If a reversal is confirmed, traders consider entering a trade in its direction. The next level may be a take-profit target, which might be trailed to the next level if the market conditions signal a continuation of a price move. A stop-loss level is typically placed below a swing low or above a swing high, depending on the trade direction.
Pivot Points and Other Indicators
While pivots show where the price may reverse, there’s nothing to say a market won’t trade through these areas. Therefore, traders typically pair them with other technical indicators and patterns.
Candlestick and Chart Patterns
Traders often combine levels with specific reversal candlestick formations, like three black crows/three white soldiers or engulfing patterns, to confirm a change in market movements. For example, a bullish engulfing candle forming at S1 could reinforce the idea of a reversal at that level.
Moving Averages
When a pivot aligns with a major moving average, e.g. the 50-period or 200-period EMA, it strengthens the area. As moving averages act as dynamic support and resistance levels, an overlap can signal a strong area where a reversal might occur.
RSI and Stochastic Oscillator
Momentum indicators like RSI or Stochastic help judge whether the price is likely to bounce or break through a pivot. If it hits support and RSI is oversold, that adds conviction. But if momentum is still strong in one direction, it might get ignored.
Considerations
Even with strong confluence, these combinations can fail. Markets don’t always respect technical alignment, especially around data releases or sharp movements in sentiment. For instance, in stocks, pivot points may be ignored if an earnings release strongly beats analyst estimates. Instead, they are believed to work when treated as one piece of a broader technical framework.
Limitations
Pivot points are widely used, but like any tool, they have flaws. They’re based purely on past price data, so they don’t account for news, sentiment shifts, or broader market context.
- False signals in ranging markets: The price often oscillates around pivot zones in markets without a clear direction, meaning setups might not follow through.
- Less reliable during strong trends: In trending conditions, the price can blow past several levels without reacting.
- No built-in volatility filter: The points don’t adapt to changing volatility, so levels might be too close or too far apart to be useful.
- Lag in real-time shifts: Since pivots are pre-calculated, they don’t adjust mid-session as new data emerges.
Final Thoughts
Pivot points are widely used in stock trading as well as in commodity, cryptocurrency*, and currency markets. While they can be useful tools, their limitations cannot be overlooked. It is essential to conduct a comprehensive analysis and confirm the indicator signals with fundamental and technical analysis tools.
FAQ
What Is a Pivot Point in Trading?
The pivot point meaning refers to a technical analysis tool used to identify potential support and resistance levels. It’s calculated using the previous day’s high, low, and close prices, and helps traders find areas where the price may react during the current session.
What Is the Best Indicator for Pivot Points?
There isn’t one best indicator, but traders often pair pivot points with moving averages, RSI, or candlestick patterns to confirm a potential reversal. The most effective setup usually depends on the strategy and market conditions.
What Are the Pivot Points’ R1, R2, and R3?
R1, R2, and R3 are resistance levels above the central point. They represent increasingly stronger potential resistance zones where the price may stall or reverse.
Which Is Better, Fibonacci or Camarilla?
Fibonacci offers wider levels based on retracement ratios, useful in trending markets. Camarilla focuses on tighter reversal zones, which are mostly used for intraday strategies. Each suits different trading styles; neither is objectively better.
*Important: At FXOpen UK, Cryptocurrency trading via CFDs is only available to our Professional clients. They are not available for trading by Retail clients. To find out more information about how this may affect you, please get in touch with our team.
This article represents the opinion of the Companies operating under the FXOpen brand only. It is not to be construed as an offer, solicitation, or recommendation with respect to products and services provided by the Companies operating under the FXOpen brand, nor is it to be considered financial advice.
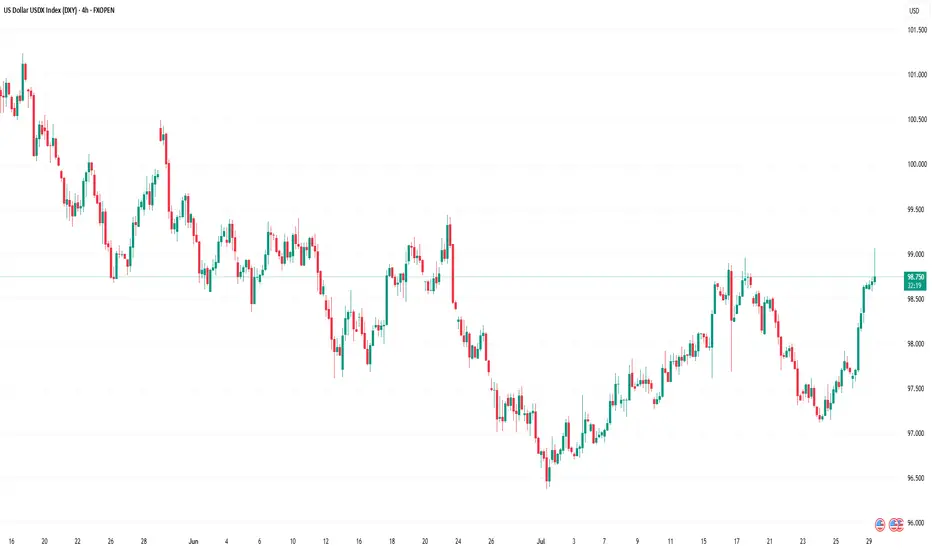
US Dollar Index (DXY) Reaches One-Month HighUS Dollar Index (DXY) Reaches One-Month High
The US Dollar Index (DXY) has risen to its highest level since early July. According to media reports, the bullish sentiment in the market is driven by the following factors:
→ Optimism around US trade agreements. A new trade deal with the EU — which includes a 15% tariff on European goods — is being perceived by the market as favourable for the United States.
→ Confidence in the resilience of the US economy. Strong Q2 corporate earnings have acted as an additional bullish catalyst. Investors may have started covering short positions against the dollar, viewing concerns over a US slowdown as overstated.
→ Expectations that the Federal Reserve will keep interest rates on hold.
From a technical standpoint, today’s DXY chart reflects strengthening bullish momentum.
Technical Analysis of the DXY Chart
Two U-shaped formations (A and B) that developed over the summer have created a bullish сup and рandle pattern — a formation that suggests waning bearish pressure, as evidenced by the shallower second dip.
This setup points to the potential for a bullish breakout above the trendline (marked in red) that has defined the downward movement in the DXY throughout the first half of 2025.
As previously analysed, there are signs that the dollar index may have found a base following a period of decline. This could indicate a shift in market sentiment and the possible end of the recent bearish phase.
This article represents the opinion of the Companies operating under the FXOpen brand only. It is not to be construed as an offer, solicitation, or recommendation with respect to products and services provided by the Companies operating under the FXOpen brand, nor is it to be considered financial advice.
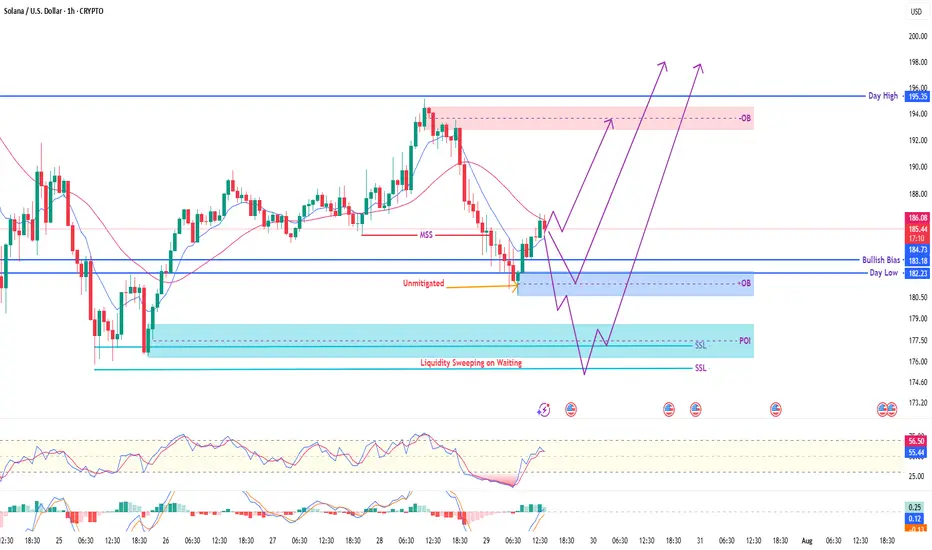
SOL/USD (1H) – Smart Money Accumulation in MotionSolana is setting up for a high-probability bullish move after price swept liquidity and tapped into a key zone of interest.
🧠 Smart Money Concepts in Play:
✅ MSS (Market Structure Shift) confirmed
✅ Price tapped into unmitigated OB zone (183–184.70)
✅ Bullish OB + POI layered below at 177–180
✅ RSI & MACD confirm strength building
🔻 SSL liquidity sweep still pending, giving us dual scenario potential
📌 Two High-Probability Scenarios:
1️⃣ Shallow Pullback Entry:
Rejection from current OB
Entry near 183–184.5
TP at 195 zone (Previous Day High / OB Mitigation)
2️⃣ Deep Sweep Entry:
Liquidity sweep below SSL toward 177
POI + OB confluence = sniper re-entry zone
Bullish explosion toward 195+
⚠️ Bias: Bullish (with liquidity engineering in process)
🎯 Target: 194–195
🛑 Invalidation: Clean break below 175 = re-evaluation
💬 Watch for clean 15M confirmation before executing either plan
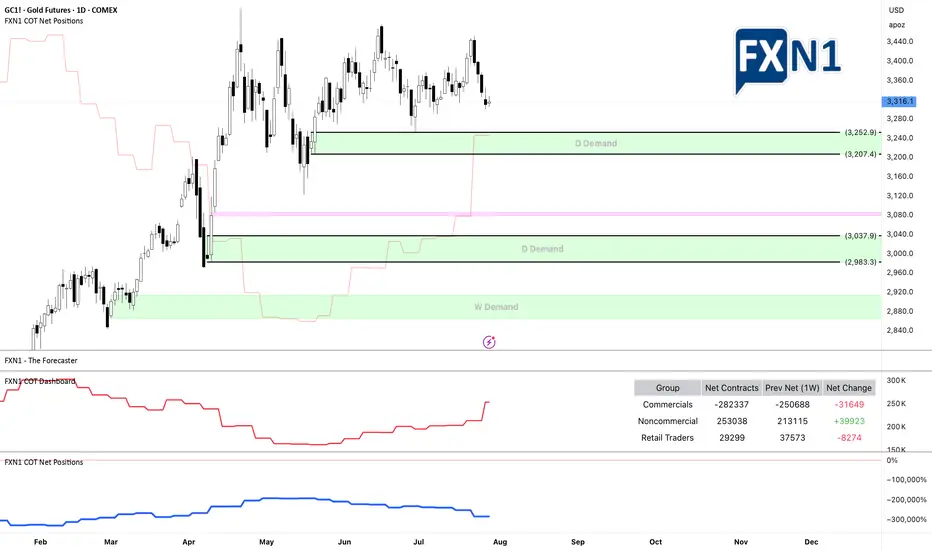
Gold Price Analysis (GC1! or XAU/USD): Challenges and OutlookSince reaching a historic high of $3,509 on April 22, 2025, gold has struggled to maintain its upward momentum. On the daily timeframe, the price experienced a sharp rejection spike after touching that peak, prompting a sideways range as the market seeks a clearer direction.
From a technical perspective, a stronger US dollar typically puts downward pressure on gold, making it a more expensive investment for holders. However, examining the chart of GC1! * alongside the DXY shows that even during periods of a robust dollar, gold has continued to rise. Additionally, recent years have seen seasonality effects on gold largely ignored, with the yellow metal persistently climbing. The underlying reasons are multifaceted, but a key factor is gold’s status as a safe-haven asset—investors prefer to hold gold during times of uncertainty and economic turmoil.
* GOLD and DXY correlation
Looking ahead, investors are awaiting the Federal Reserve’s upcoming monetary policy announcement scheduled for Wednesday. According to the CME FedWatch tool, the consensus is that the Fed will keep interest rates steady at 4.25%-4.50%, marking the fifth consecutive meeting with unchanged rates.
From both fundamental and technical viewpoints, recent data suggest a cautious outlook. Notably, non-commercial traders added nearly 40,000 long contracts last week, indicating bullish sentiment. Conversely, retail traders have reduced their positions, which could signal a potential shift in market dynamics.
The key question remains: where might be a strategic entry point if gold resumes its upward trend?
In the chart, I’ve highlighted two daily demand zones and a strong weekly demand area. There’s a possibility that the price may not revisit the weekly demand zone to accommodate new longs, instead triggering entry signals from one of the daily demand zones. I recommend adding these zones to your watchlist as potential entry points.
What are your thoughts? I look forward to your insights!
✅ Please share your thoughts about GC1! in the comments section below and HIT LIKE if you appreciate my analysis. Don't forget to FOLLOW ME; you will help us a lot with this small contribution.
XAUUSD – Weak Rebound, Bearish Bias RemainsYesterday was a quiet and choppy day for Gold.
Although price managed to recover a small portion of last week’s 1400 pip drop, the rebound remains anemic — price barely reached the 23% Fibonacci retracement.
To make things worse for the bulls, the recovery from around $3300 is starting to take the shape of a bearish flag, a continuation pattern that typically signals further downside ahead.
📌 Resistance Zones to Watch:
- Initial resistance: $3345–3350
- Stronger resistance: $3370, a level already proven and well-defined
As long as the price is under those levels, I remain firmly bearish.
📈 Trading Plan:
I already have a short position open, and I'm still waiting to add more, preferably on a push into higher resistance, ideally above $3345.
No need to force entries — I’d rather scale in on strength, not weakness.
Once the correction is complete, I’m targeting:
- $3280 as the first support
- $3250 as a realistic downside objective
Conclusion:
The rebound lacks power. The structure favors the bears.
Still watching for better entries to add short, with eyes on 3280 and 3250 as likely targets.
Let’s stay patient and let the setup come to us. 🎯
Disclosure: I am part of TradeNation's Influencer program and receive a monthly fee for using their TradingView charts in my analyses and educational articles.

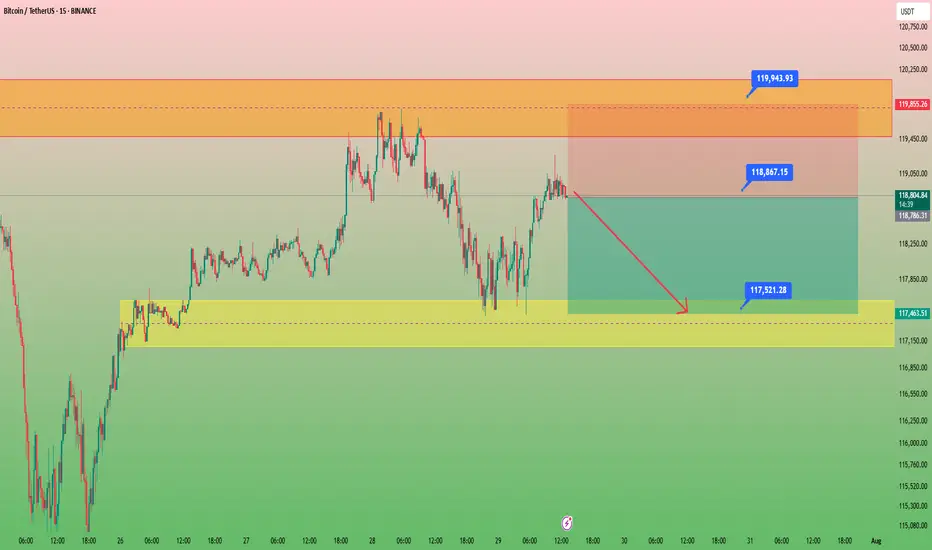
Bitcoin in 15minCaption important🛑🛑🛑
Hello to all traders. 😎😎
I hope all your deals will hit their targets. 🎉🎉
I’m opening a short position on Bitcoin from the current level, targeting $118,200 as the first take-profit, and $117,600 as the second target.
⚠️ This is a high-risk trade, so make sure to apply proper risk management.
What Do You Think?
Which scenario do you think is more likely to happen? **Share your thoughts!** ⬇️
Don't forget that this is just an analysis to give you an idea and trade with your own strategy. And don't forget the stop loss🛑🛑🛑
❤️❤️❤️The only friend you have in financial markets is your stop loss❤️❤️❤️
Please support me with your ✅' like'✅ and comments to motivate me to share more analysis with you and share your opinion about the possible trend of this chart with me 🙏😊
Be Happy , Ali Jamali
GRTUSDT Triangle Coil Tension Builds Bullish Breakout in FocusGRTUSDT is forming a clean symmetrical triangle with price rebounding from the lower trendline which brings an encouraging signal for potential continuation to the upside.
As long as the structure holds, we anticipate a breakout above the triangle, which could ignite strong bullish momentum. The external demand zone remains ideal for strategic accumulation, while the internal supply area should be monitored for signs of short-term rejection.
If buyers absorb pressure at that level, GRT could rally toward the crucial upper supply zone, which marks the next major area for distribution. Let’s see how this unfolds, feel free to share your perspective.

Bitcoin Passes Stress TestOn July 25, 2025, Galaxy Digital executed one of the largest Bitcoin sales ever recorded: 80,000 BTC, valued at approximately $9 billion , on behalf of a Satoshi-era investor.
Despite the size, the market absorbed the flow with minimal volatility—Bitcoin dipped from around $119,000 to $115,000, then rebounded above $119,000.
Liquidity Maturity in Motion
Analysts called the trade a significant demonstration of market maturity, noting that 80,000 BTC was absorbed in days with barely a market blip.
Crypto infrastructure has also evolved: algorithmic liquidity providers, institutional desks, and OTC channels handled the load without triggering cascading funding rate hikes or forced liquidations.
Ongoing Risks
Event-Driven Stress: During macro shocks or sharp sell-offs, liquidity may thin, and the same level of absorption might not persist.
OTC vs Exchange: This large sale was managed mostly off-exchange. A similar-sized on-exchange dump could still trigger stop-run cascades.
Retail Complacency Risk: The stability seen now can be deceptive, as retail may misinterpret low volatility as a safe leverage zone, only to be caught off-guard.
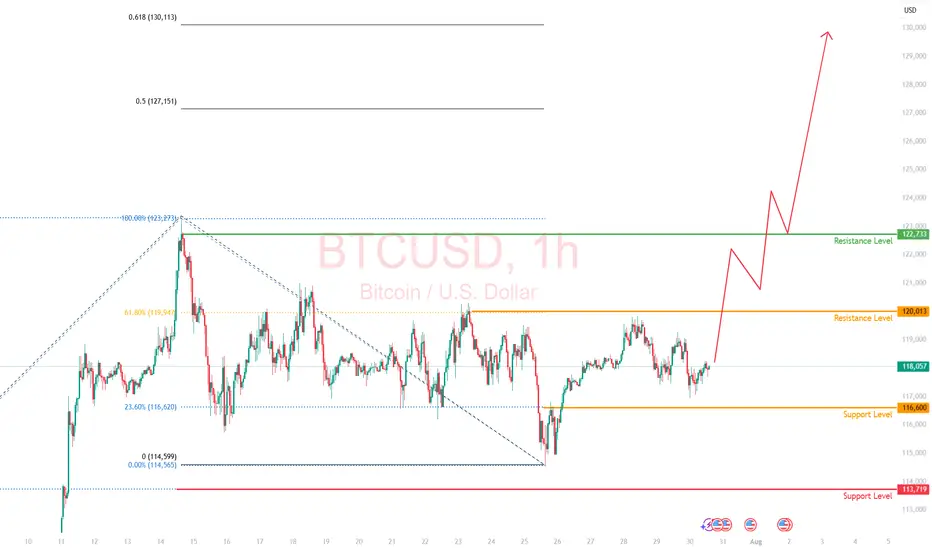
Projections:
Watching the 23.6% fib retracement level in line with the $116,600 price level. Anticipate the resistance level of $120,000 to be retested.
If price breaks above $120,000, we could see a significant move toward $130,000
The $9B BTC sale went through without materially impacting price is considered a milestone in crypto market evolution. It reflects institutional-grade liquidity and sentiment maturity.
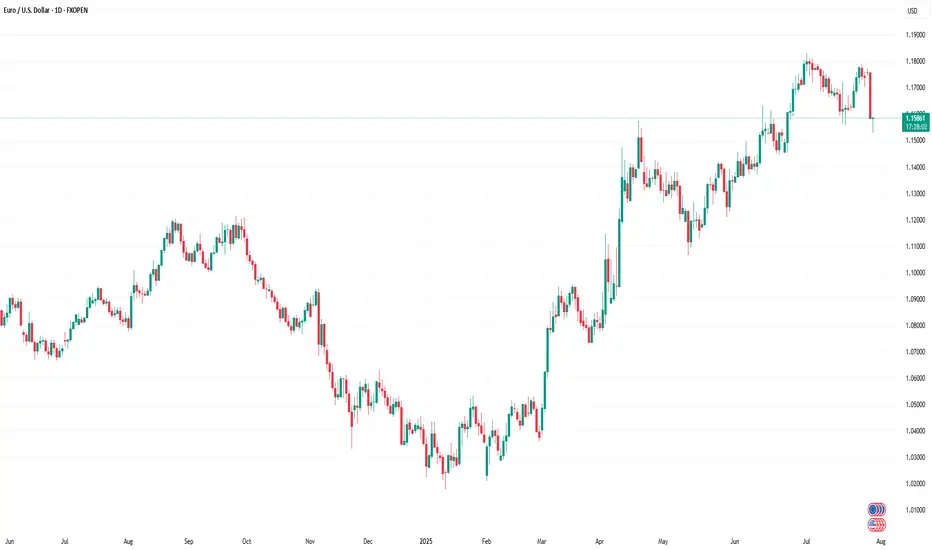
Major U.S. News Ahead—Will EURUSD Pivot?Good morning, my friends 👋
Here’s my EURUSD market analysis 📉
Currently, the pair is in a downtrend. I expect this downward move to end around 1.14899 or 1.14536, where a potential buying opportunity may emerge. I personally plan to enter a buy position once price reaches those zones 💼
Also, keep an eye on major U.S. economic reports being released today—they could trigger increased volatility 🔔
Every like you send is a huge source of motivation for me to keep sharing high-quality analysis 🙏 Thanks to everyone supporting the channel 💙

DAX: Local Bearish Bias! Short!
My dear friends,
Today we will analyse DAX together☺️
The in-trend continuation seems likely as the current long-term trend appears to be strong, and price is holding below a key level of 24,252.78 So a bearish continuation seems plausible, targeting the next low. We should enter on confirmation, and place a stop-loss beyond the recent swing level.
❤️Sending you lots of Love and Hugs❤️

NIFTY – Bearish Setup: Head & Shoulders🟢 Entry (Short): Around 24,800 – 24,900
🔴 Stop Loss: Above 25,000
🎯 Target : 24,000

Wave 3 Loading? FLOKI Prepares for Potential Upside ContinuationFLOKIUSDT is trading within an ascending channel, recently rejecting from the upper boundary near $0.00034416. Price has since entered a prolonged consolidation phase, forming a descending broadening wedge.
The current focus remains on the $0.00020188 region; a breakout from this level would validate a potential wave 3 extension. Overall structure still targets a revisit to the channel’s upper boundary, supported by the recent bounce from the lower channel trendline.
Key levels and targets are illustrated on the chart.

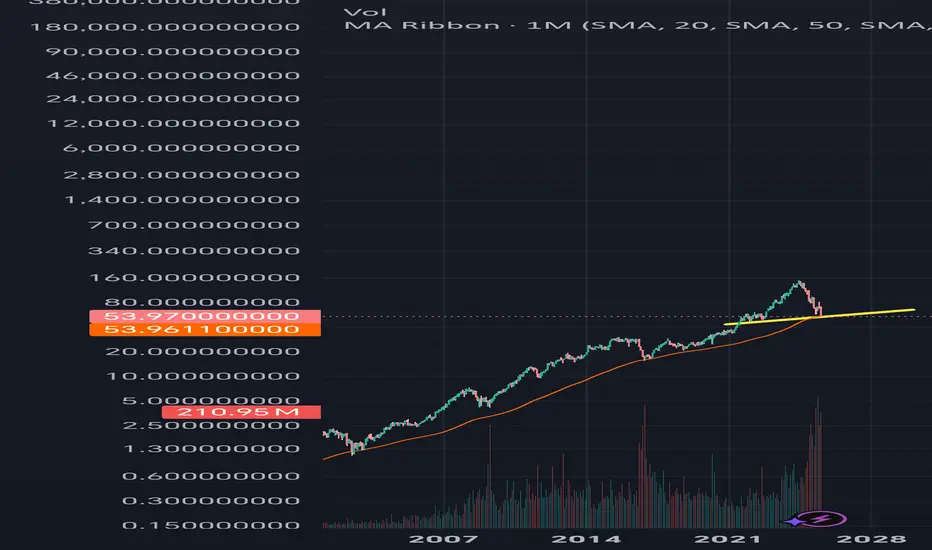
NVO-Bought more hereDoubled down right here,
Testing the all time support trendline 100 monthly SMA.
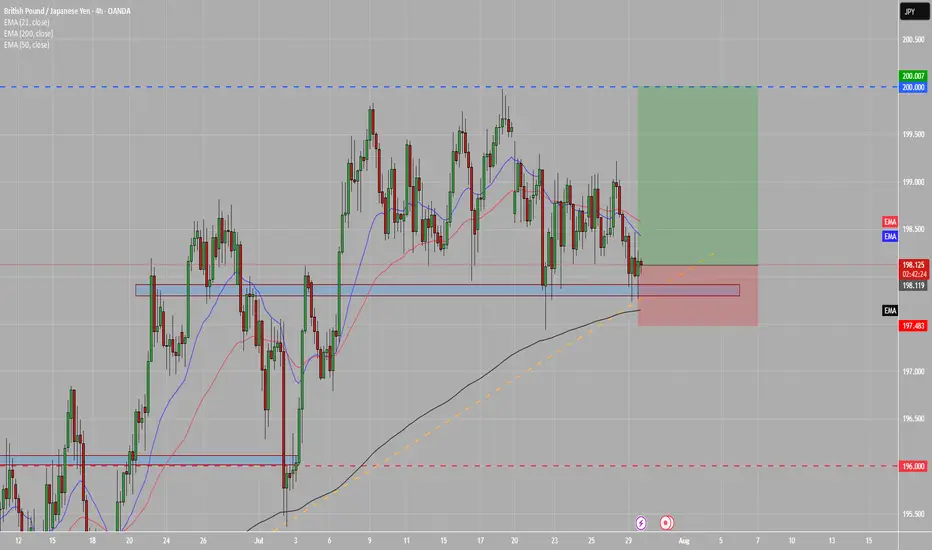
GJ BULLISH SET UPPlace a long on this one, price seems to be at strong support and TL has help price in previous touches.
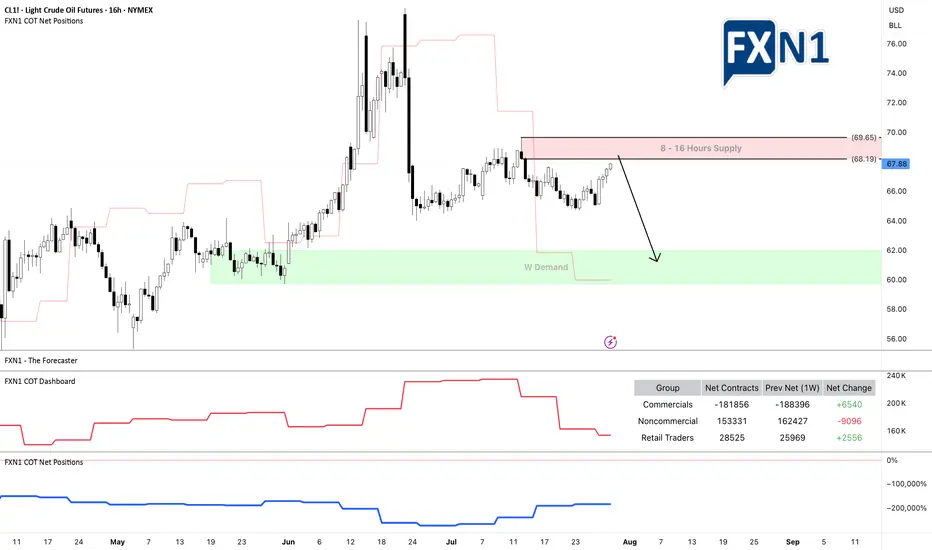
Oil Market Sentiment Shifts After Trump’s Urgent Warning, but...On June 23, 2025, at 9:35 AM, President Donald J. Trump issued a stark warning via social media:
"EVERYONE, KEEP OIL PRICES DOWN. I’M WATCHING! YOU’RE PLAYING RIGHT INTO THE HANDS OF THE ENEMY. DON’T DO IT!"
Since his post, oil prices experienced a notable bullish impulse. From both fundamental and technical perspectives, the market is now approaching a 16-hour supply zone, which could serve as a potential resistance area.
Additionally, I’ve observed a divergence in trader positioning: non-commercial traders increased their short positions significantly last week, while retail traders remain long. This divergence between price action and non-commercial positions suggests a possible shift in momentum, and I am currently eyeing a short setup.
As always, I encourage traders to conduct their own analysis. The trader featured below operates on the D1 timeframe and focuses on scalping, which can be useful for short-term entries.
Stay cautious and keep an eye on how the market reacts near the identified supply zone.
✅ Please share your thoughts about CL1! in the comments section below and HIT LIKE if you appreciate my analysis. Don't forget to FOLLOW ME; you will help us a lot with this small contribution.
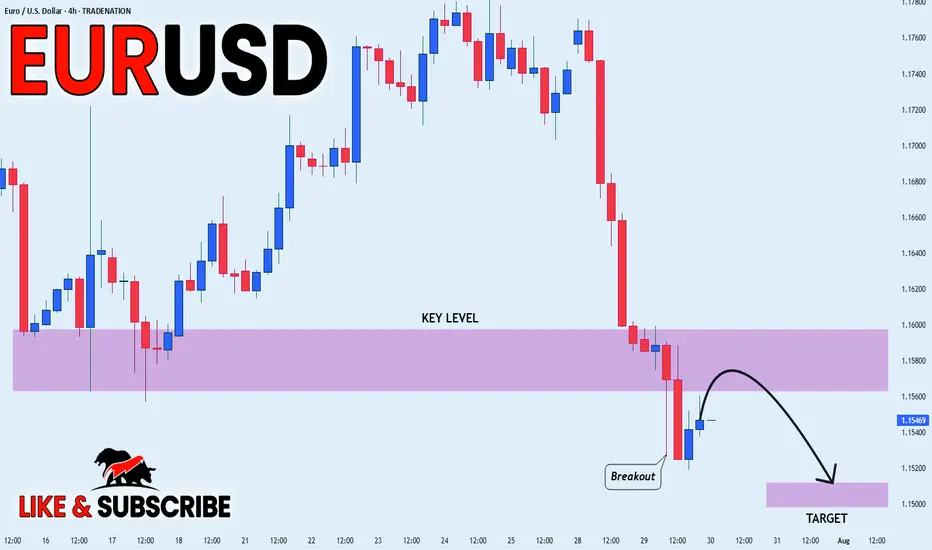
EUR_USD BEARISH BREAKOUT|SHORT|
✅EUR_USD broke the key
Structure level of 1.1580
While trading in an local downtrend
Which makes me bearish
And I think that after the retest of
The broken level is complete
A bearish continuation will follow
SHORT🔥
✅Like and subscribe to never miss a new idea!✅
Disclosure: I am part of Trade Nation's Influencer program and receive a monthly fee for using their TradingView charts in my analysis.
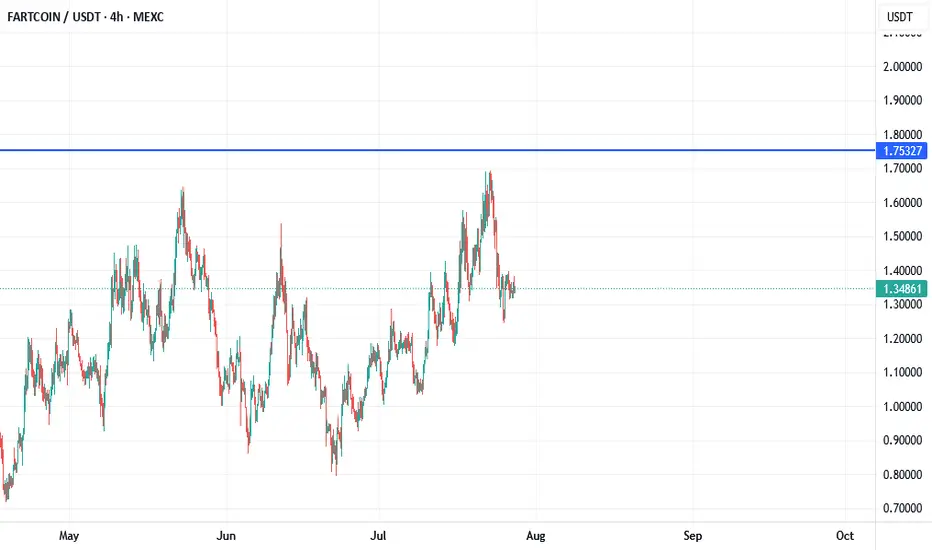
FartCoin $1.75 As soon as possibleHello,
FartCoin go to the $1.75 soon.
What is your opinion?
Thank you