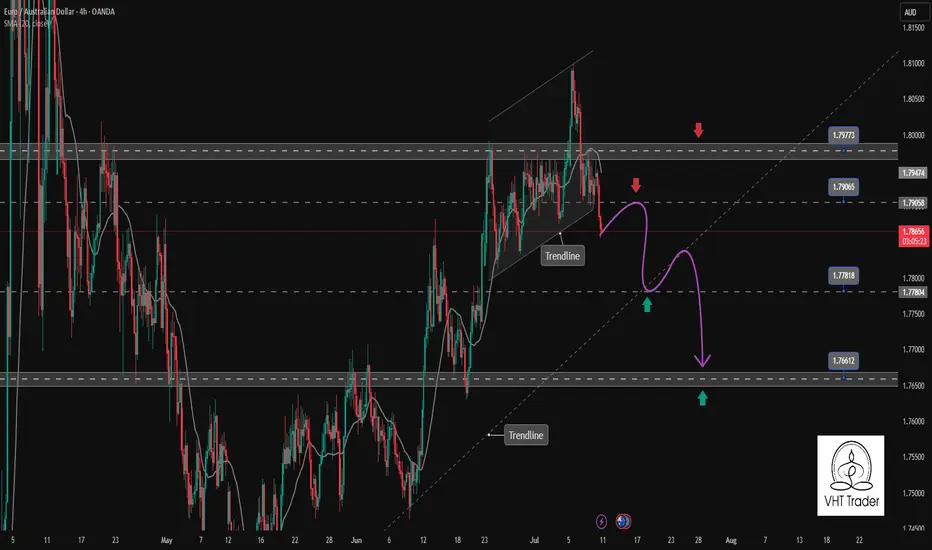
EURAUD confirms the continuation of the bearish correction trendEURAUD has just broken the rising channel to start a downtrend. The confirmation is there with the h4 candle closing completely below the support zone of the Price Channel. This corrective downtrend can now extend to the support of 1.766. The support zone is a Break point at the moment 1.778 is a positive DCA point with a SELL Entry above.
Support: 1.778-1.766
Resistance: 1.790-1.797
Sell now: Resistance zone 1.79000
Target: 1.778 Support zone, followed by 1.766 lower zone
Sell Trigger: Break below 1.778
BUY Trigger: rejection 1.778 Support zone
Leave your comments on the idea. I am happy to read your views.
PAIR
EUR/USD - Next leg up incoming?Since February, the EUR/USD currency pair has been in a strong and sustained uptrend, signaling a significant shift in market sentiment. What began as a recovery from the 1.02 level has quickly turned into a strong bullish movement, with the pair already reaching as high as 1.15 in just a matter of two months. This impressive rally marks a clear change in momentum, with price action showing classic bullish characteristics.
--------------------------------
What will we discuss
- Overall trend structure
- 4H Fair Value Gap
- Golden pocket fibonacci
- What to expect next?
--------------------------------
Overall trend structure
Over the past two months, the price action has maintained a clean and well-defined bullish structure. The consistent formation of higher highs and higher lows is a textbook sign of a strong uptrend. Each retracement has been shallow, with buyers stepping in above previous lows, and each rally has broken through key resistance zones, further confirming the prevailing bullish bias.
--------------------------------
4H Fair Value Gap (FVG)
During the latest move up to 1.15, EUR/USD formed a 4H FVG, just before a short-term rejection at the top. This unfilled imbalance now coincides with a key support area. Given this confluence, it’s highly likely that price could revisit this zone to partially or fully fill the gap. This would allow the market to rebalance, and potentially offer a strong foundation for another bullish leg.
--------------------------------
Golden pocket Fibonacci
Adding to the significance of this zone is the golden pocket Fibonacci retracement (0.618–0.65) from the latest upward swing, which lies between 1.14198–1.14274. This area happens to align perfectly with the midpoint of the 4H FVG, providing additional confluence and making it a major technical level to watch.
--------------------------------
What to expect next?
With both the 4H FVG and the golden pocket overlapping, the zone around 1.14198–1.14274 becomes a high-probability support area. Historically, the golden pocket is known to attract strong buying interest, and when coupled with the FVG, it strengthens the case for a bullish reaction. If price dips into this zone and finds support, it could mark the beginning of the next impulsive move higher, in line with the broader uptrend.
--------------------------------
Thanks for your support.
- Make sure to follow me so you don't miss out on the next analysis!
- Drop a like and leave a comment!

DXY Monthly Analysis: Key Support Holding, Bullish Move Ahead?📊 DXY Monthly Chart Analysis (March 27, 2025)
Key Observations:
Current Price Action:
The U.S. Dollar Index (DXY) is trading near 104.267, with notable resistance ahead.
Price is consolidating within a key demand zone (~102.5–104) after rejecting higher levels.
Technical Levels:
Support Zone: 100.2–104 (Highlighted in purple)
Resistance Zone: 112.5–114.7 (Highlighted in purple)
Major Resistance: 114.77 (Previous high, acting as a supply zone)
200-MA Support: Located below current price, offering a long-term bullish confluence.
Market Structure:
Price remains in a higher time-frame bullish trend but is experiencing a correction.
The "BOSS" level (Break of Structure) suggests a prior bullish breakout.
If the demand zone holds, a bullish continuation towards 112.5–114.7 is possible.
Projected Move:
A bounce from 102–104 could trigger a rally toward the upper resistance zone (~112.5).
A break below 100.2 could indicate a shift in trend and further downside.
Conclusion:
DXY is at a critical decision point. Holding the current support zone (~102–104) could fuel a bullish continuation toward 112–114, while a breakdown below 100.2 would weaken bullish momentum.

GBPUSD - Down We Go!Hello TradingView Family / Fellow Traders. This is Richard, also known as theSignalyst.
📈GBPUSD has been overall bullish, trading within the rising channel marked in red.
However, it is currently retesting the upper bound of the channel which lines up perfectly with the resistance zone marked in blue.
📉As per my trading style, as long as the resistance zone holds, I will be looking for sell setups on lower timeframes.
📚 Always follow your trading plan regarding entry, risk management, and trade management.
Good luck!
All Strategies Are Good; If Managed Properly!
~Rich
Disclosure: I am part of Trade Nation's Influencer program and receive a monthly fee for using their TradingView charts in my analysis.

How I identify the best forex pairs to trade: (2)Here is how I identify the best forex pairs to trade: (Publication #2 / Update)
In the top left panel, the indicator 'Compare Forex' displays the PERFORMANCE of each major currency.
The USD (red line) has been the strongest currency for the past 2 months on H6 charts.
By identifying the strongest currency, all that remains is to trade the USD against all the other currencies since they are weaker.
= Smooth stress-free charts.
I look at my trades 2-3 times a day to see if they are still blue or red. Takes a few minutes.
__
DEC 1st UPDATE: Last week, the JPY became the strongest performing currency. The JPY (yellow line) crossed above the USD (red line). When the performance of the USD became weaker than the JPY = The USDJPY PAIR turned down.

Potentially huge rally in $SEI brewingMy chart is a pair analysis, showing the ratio of SEIUSDT to TOTAL3 (multiplied by 10^15 to make scale visible). It shows that SEI is a "high beta", "momentum" coin relative to the rest of the market and trades very cleanly, respecting moving averages.
I see a potential for SEI to outperform the market by as much as 500% over the coming weeks/months. Could mean anything between 10x and 100x in absolute terms, assuming the market rallies as well. The trigger would be a break of moving average to the upside.

EURUSD: Daily ReviewHello traders,
First let's take a deeper look at daily chart!!
We are in a bullish leg of a bearish channel. I'm waiting for a reversal to enter around the zone!

TRADE BTC/TSLA Pair and Grow your bagsBeen working on something. trying to make swing trades and longer term holds more efficient by trading in a non correlated pair.
Such as BTC/TSLA
As I want to stay in the market I can move allocation to the horse with the best momentum. Over time this rolls into more shares of TSLA or More BTC when timed correctly.
I'm mainly using the yellow 21 EMA vs The Blue/Red Linear Regression Line and their position in relation to the 200 EMA.
Still dialing in and will track over next few months. I can almost churn the longterm with this method. but for now I'm just giving it some gas to cook with and see how it works for me.
Example today I purchased more TSLA since BTC's relation to TSLA is in a down swing as the 21 day (yellow) crossed down over the Linear regression line (blue/red) and now dipping below the 200 day ema.
today TSLA is up 2.19% and BTC is up .38%.
This combines both my TSLA holdings and BTC holdings into one big pool where I shift the bulk of the holdings to the Ticker with the best juice making profit on the margin between the 2 tickers while increasing total position size and still participate in capital appreciation.

Trade Recap: MEDP & LSCC - 24/4/24 to 25/4/24Market Context and Indicators (Closing of 23/4/24):
Directional Movement Index (DMI):
* DI+: 42.59
* DI-: 11.53
* ADX: 19.75 (indicating a weak trend)
Stochastic Oscillator:
* %K: 94.34
* %D: 98.11 (both in the overbought territory)
Correlation:
* MEDP & LSCC: 0.8852 (strong positive correlation)
Trade Information:
MEDP Position:
* Position: Short
* Entry Price: $415.00
* Exit Price: $406.00
* Duration: 24/4/24 morning to 25/4/24 mid-day
LSCC Position:
* Position: Long
* Entry Price: $70.39
* Exit Price: $72.35
* Duration: 24/4/24 morning to 25/4/24 mid-day
Analysis and Strategy:
Given the strong positive correlation of 0.8852 between MEDP and LSCC, paired with the overbought levels of %K and %D on the Stochastic Oscillator, we identified a potential reversal opportunity. The ADX at 19.75 suggested a weak trend, which further supported the hypothesis of an imminent price correction.
Trade Outcome:
* MEDP: Achieved a successful short trade with a profit of $9.00 per share.
* LSCC: Achieved a successful long trade with a profit of $1.96 per share.
These trades exemplify the effectiveness of leveraging correlation and technical indicators to capitalize on market movements.
Key Takeaways:
Utilize Correlation: Understanding the correlation between assets can provide insights into potential price movements.
Monitor Indicator Levels: Overbought and oversold conditions, combined with trend strength indicators, can highlight profitable trading opportunities.
Adapt to Market Conditions: Weak trends, as indicated by ADX, often present good reversal trading opportunities.
Stay tuned for more trading ideas and market insights!

Solana is set to outperform ETH during this cycleDo you see this massive Cup and Handle formation? SOL will probably flip ETH if this gets triggered!
I feel that HTX accident mangled Solana's chart, and in the absence of it, the blue line would probably held as support, which would still be incredibly bullish.

EURJPY - OB MitigationWaiting on a Mitigation on a 30m OB. We also have liquidity resting, that could lead price to rapidly move towards our Sell Limit

GOLD|Weekly roadmap and important areasHello guys, I hope you are doing well
Let's review what happened last week
You can see the gold chart in 1 hour.
As we expected, the resistance zone prevented the growth of the gold price.
We have a support level, we have to wait for this level to be broken, if we had a close candle below this level, we can enter sell positions in reversals.
There is a possibility that the demand zone (2004-2008) will be tested again.
In general, selling pressure is more on gold.
Look for more sales positions.
Important areas are drawn on the chart.
Look for confirmation to enter trading positions by using candlestick patterns and trend breakouts.
I mentioned the types of candlestick patterns in the previous post, be sure to read them. In this way we work, smart money, candlestick patterns are one of the trading tools.
There is a lot of strong news in the coming week, starting from the FOMC, FEC speech, which will obviously discuss the further situation with inflation and interest rate, and NonFarm Payrolls on Friday. This period is expected to be quite volatile, but only in its second half.
Pic:1h time frame important areas
support level:(2014)-(2004-2008)-(1992-1998)
resistance level:(2023-2025)-(2031-2036)

1 Earth Clear Volume Increase
Price action sure to follow
Bouncing well off of fib and excited to see whats next

GBPJPY end of the weekly pullbackI think its the end of the weekly pullback and continue the uptrend.
On the right chart u see my 30min timeframe for entry / tp /sl.
Left chart higher timeframes for important levels.
131 pips move

EURUSD - Video Top-Down Analysis!Hello TradingView Family / Fellow Traders. This is Richard, also known as theSignalyst.
Here is a detailed update top-down analysis for EURUSD.
Which scenario do you think is more likely to happen? and Why?
Always follow your trading plan regarding entry, risk management, and trade management.
Good Luck!.
All Strategies Are Good; If Managed Properly!
~Rich

The Journey of a Trader 🎓From Day 1 Until Profitable
On Day 1, a trader is just a passenger in a car that is controlled by others...
This journey is so common that when people realize others are doing the same thing, they don’t feel so alone. I have talked with thousands of traders through the years and the vast majority of them experience this journey just as I have.
Most start out so pissed off with life that something has to change. Most do not have college degrees. The ones that do have college degrees think they have an edge in trading… THEY DON’T but they can’t realize that yet.
Some people are smarter than others so they think trading will come easier to them. IT WONT. For some reason, trading comes easier to basic factory workers with no education and no one knows why.
Maybe it is just pure gut instinct. Maybe it is because they are used to following the rules. Whatever the case, trading is not, nor ever will be, easy.
Most traders give up before the journey ends. It has been said that 80-90% will give up in their first year but there are actually zero statistical studies to back this up.
One thing we do know, by looking at trading statistics from brokers is that only a small percentage are successful. By analyzing data from 3 of the largest forex brokers, we know that only 25-35% are successful in their trades and the others are losing.
This is a totally different number than all the "95% of trader lose" we see blasted all over the place. No one knows the REAL number.
Out of the small percentage that stick with it, success is born after a long and intense process. Successful traders go through a series of steps and it is kind of funny but we all go through the same steps, over and over.
Most traders I know have gone down this same path and I am going to lay it out for you here. While you are reading, this I want you to ask yourself where you are along this journey.
Ignorance Comes First
Then comes the «WOW» moment!
A WOW moment is when you find something that makes you take a double take, lose your breathe and say wow.
The second wow moment! 💥
A new spark of excitement and hope sets in…
Pure determination
At this point, you become unstoppable.
Others think you are crazy!
Everyone, at this point, thinks you have lost your damn mind!
Finally you can say, ” Heck Yeah, I made it!”
Freedom!
When you reach this point, you have given more effort than the overwhelming majority of so called traders out there. You have spent sleepless nights, sweaty day, cried, made yourself sick, mentally abused your mind, and just gave every dang ounce of energy you have to this profession. You have persevered and prevailed.
Hey traders, let me know what subject do you want to dive in in the next post?

✅AUD_NZD BROKE THE KEY LEVEL |SHORT🔥
✅AUD_NZD is likely to continue
Falling down because the pair
Is in the downtrend and it broke
A strong key level on Daily TF
So the bias is bearish and
The expectation is that
Of a continued price decline
SHORT🔥
✅Like and Subscribe like a BRO✅

CAD-JPY Broke The Rising Support! Sell!
Hello,Traders!
CAD-JPY will go down
Because the pair broke
The rising support line
So the uptrend is over
And the target is below
Sell!
Like, comment and subscribe to boost your trading!
See other ideas below too!

AUD-USD Will Keep Falling! Sell!
Hello,Traders!
AUD-USD is trading in a
Downtrend and the pair
Broke out of the bearish
Flag pattern so we are
Bearish biased and will be
Expecting a bearish
Continuation and the
Retest of the demand
Level below
Sell!
Like, comment and subscribe to boost your trading!
See other ideas below too!

How to Trade Like a Pro | Focus on One Instrument!
“TO TRADE, OR NOT TO TRADE A SINGLE CURRENCY PAIR. THAT IS THE QUESTION…”
🧿MULTIPLE CURRENCY PAIRS
Easier to recover from losses on a given currency pair
Less likely to experience not seeing any setups for a whole day/week
Better understanding of pair correlations required
Can be more distracting
🧿SINGLE CURRENCY PAIR
No risk of trading correlated pairs
Better ability to focus
Feeling of understanding the price movements more
Can be a struggle to stick to ONE pair
Feeling of missing out when big moves happen on other pairs
✅HOW TO TRADE SINGLE CURRENCY PAIR:
🔲Step 1: Pick Your Currency Pair
▪️Is the pair active when I intend to trade it?
Even though the Foreign Exchange market is open 24/5, some pairs may be less traded at some specific times. Refer to "When To Trade Forex To Maximize Your Lifestyle & Profit?"
▪️Do you understand the currency pair you want to trade?
If you trade a pair with your country's currency, your chances of understanding how the price of the pair fluctuates might be higher. You will know what's going on and might even be able to know where the currency is heading (we are talking of fundamental analysis here...).
▪️Is the pair too or not enough volatile for you?
Don't be surprised to see big swings in GBP/JPY or GBP/NZD because those pairs are considered more volatile. Some traders like it because the profits usually come quickly, but stopped out trades can be more frequent.On the other hand, a pair like USD/CNY will have some inactivity periods and that might be frustrating.
🔲Step 2: Plan Your Trading
Good strategies are abstract and should work on any currency pair, however, since you have decided to trade one pair only, you have the privilege of tailoring you strategy to the particular pair, taking into the account it’s volatility, average likelihood of fakeouts vs breakouts, how trending it is on average etc..
🔲Step 3: Stay Consistent
Stick to the plan for at least a month. You might start the month feeling excited. You might get discouraged because you've taken too many or too few trades two weeks in.No one cares. Stick to your decision.At the end of the month, two things will happen:
1. You'll have built more confidence in your ability to remain consistent.
2. You'll have performed an experiment and will be able to say what works vs. what doesn't.
Those are two great things for someone who's looking to grow as a Forex trader.
Thanks for reading bro, you are the best☺️
Like, comment and subscribe to boost your trading!
Hey traders, let me know what subject do you want to dive in in the next post?

🔲15 TRADING TOPICS YOU SHOULD LEARN🔲
Hey traders,
Here is the list of topics that you must study in trading to trade like a pro.
▪️Price Action
▪️Trading Psychology
▪️Trend Lines
▪️Fibonacci
▪️Breakout Trading
▪️Fundamentals
▪️Key Levels
▪️Supply & Demand Zones
▪️Risk Management
▪️Candle Patterns
▪️Chart Patterns
▪️Supply & Demand
▪️Fundamentals
▪️Risk to Reward Analysis
▪️Technical Indicators
🔲Spend at least a week on each topic. I guarantee you that your trading performance will dramatically improve once you learn all these concepts.
Thanks for reading bro, you are the best☺️
Like, comment and subscribe to boost your trading!
Dear followers, let me know, what topic interests you for new educational posts?

AUDCAD long BUYDown trendline breaked and retesting down trend
LONG entry entered
thin Stopn loss
higher Take Profit

easyMarkets GBPUSD Daily - Quick Technical OverviewFrom around the beginning of December 2022 GBPUSD is trading inside a range, roughly between the 1.1840 and 1.2440 levels. As long as the pair stays inside that pattern, the medium-term outlook remains neutral. We need to see a clear breakout through one of the sides of the range in order to consider the next medium-term directional move.
From a short-term perspective, GBPUSD is trading below a short-term tentative downside resistance line drawn from the high of February 2nd. To aim higher within the range, a break above that short-term trendline is needed. If that happens, the rate would also be placed above all the EMAs, which may attract a few extra buyers.
Disclaimer:
easyMarkets Account on TradingView allows you to combine easyMarkets industry leading conditions, regulated trading and tight fixed spreads with TradingView's powerful social network for traders, advanced charting and analytics. Access no slippage on limit orders, tight fixed spreads, negative balance protection, no hidden fees or commission, and seamless integration.
Any opinions, news, research, analyses, prices, other information, or links to third-party sites contained on this website are provided on an "as-is" basis, are intended only to be informative, is not an advice nor a recommendation, nor research, or a record of our trading prices, or an offer of, or solicitation for a transaction in any financial instrument and thus should not be treated as such. The information provided does not involve any specific investment objectives, financial situation and needs of any specific person who may receive it. Please be aware, that past performance is not a reliable indicator of future performance and/or results. Past Performance or Forward-looking scenarios based upon the reasonable beliefs of the third-party provider are not a guarantee of future performance. Actual results may differ materially from those anticipated in forward-looking or past performance statements. easyMarkets makes no representation or warranty and assumes no liability as to the accuracy or completeness of the information provided, nor any loss arising from any investment based on a recommendation, forecast or any information supplied by any third-party.
