1*BTC-250*LTCAs you can see in the daily chart, we are currently at the upper band. At a level which we have not seen since February 11. In addition, we have the RSI on the residual currently showing a negative divergence (see black lines). Historically, the combination of overbought/oversold on the Bollinger bands and a negative divergence have led to good entries.
In my opinion, trades pro LTC are to be favored over the bitcoin current environment.
Pairs

The last time this pattern broke ADA had an 83% return vs BTCADA has been on fire this year! ADA has recently broken out of a falling wedge pattern after consolidating for a short period of time vs. BTCUSD. This move will likely signal significant strength in the USD price like the last time this happened on February 18th. If resistance at 0.00003 is broken there isn't much in the way of reaching 0.00042 which is major resistance.


The Ethereum Dilemma.Prices trading near a horizontal level are always my favorite positions to discuss. Here, we can consider two great opportunities with good risk reward. Entering near a horizontal area ALWAYS gives great risk-reward, which is why you'll see me often talking about those.
The first and most obvious trade here is a long trade upon the breakout. However, we have already seen a breakout here with two wicks slightly above the resistance and the price did not manage to pull through.
The second trade idea would be a short trade on the reversal near the resistance, assuming it would hold. This would be a great idea too, yet risky as the price is in a clear uptrend and the entire market is in an uptrend right now.
That's why in this case I suggest waiting for confirmation before entering a position. If it clearly breaks out upwards go in with a long trade, if it clearly moves downards again go in with a short trade.
However, to make things complicated. I don't see the volume and volatility either to go all the way to the all time high right now or back to the $1000 level. That's I would suggest to keep this trade small for now and trade towards the smaller horizontal zones.
Follow me for consistent high quality updates, with clear explanations and charts.
Please like this post to support me.
- Trading Guru
--------------------------------------------------------------
Disclaimer!
This post does not provide financial advice. It is for educational purposes only!

LTC Getting Ready For a Breakout! Prepare Your EntriesIn this technical analysis I share my current views on LTC/USD. I tried to make the chart as self-explanatory as possible, but feel free to reach out or drop a comment if you have any questions.

Three Reasons to Buy BitcoinIn this technical analysis I will show you why this is a good moment to buy bitcoin. All the information can be found on the chart, but here is a small summary:
- Breakout through the resistance! A very bullish signal. We can expect this horizontal zone to turn into support later in case any downturn would happen. That's what makes this a relatively safe entry point.
- A 15% upwards potential. We see a big distance to the next horizontal zone while the stop loss directly underneath the support keeps us safe. This trade should give us a risk reward of about 2.5
- Overall bullish trend. Every trade should start with a positive bias since the likelihood of btc going up is just been so high recently given the massive uptrend.
Follow me for consistent high quality updates, with clear explanations and charts.
Please like this post to support me.
- Trading Guru
--------------------------------------------------------------
Disclaimer!
This post does not provide financial advice. It is for educational purposes only!

LINK/USD Wait For THIS To Happen Before You Enter a LONG Trade.All information can be found on the chart. I tried to make it as self-explanatory as possible. In case you still have any questions, free free to leave a comment or send me a personal message

LTC's Next Move After BreakoutAll information can be found on the chart. I tried to make it as self-explanatory as possible. In case you still have any questions, free free to leave a comment or send me a personal message.

The Price of BCH/USD Broke Through Resistance - What Is Next?All information can be found on the chart. I tried to make it as self-explanatory as possible. In case you still have any questions, free free to leave a comment or send me a personal message.

How to Prepare for Your Next Ethereum Trade, using PRICE ACTIONIn this technical analysis I attempted to make the chart as self-explanatory as possible, all information should be easily available and understandable. However, if you have any questions feel free to drop a comment down below or to send me a private message.

XRP/USD Hits Crucial Support Zone, On The Road To 30ct!All info can be found on the chat, feel free to send me a message on Tradingview if anything isn't clear.

Next Target for Bitcoin: $17,000 - By Trading-GuruIn this idea for Bitcoin I show how you could set-up a long position in the bullish scenario that the ascending channel holds.
We can see a very important confluence at the moment the ascending channel touches the support zone. This could be a great point to enter a long trade.
Then, for the take profit location I suggest the second important confluence, the moment where the price will touch a psychological resistance level of $17,000 exactly during the time it hits the resistance line of the ascending channel
Follow me for consistent high quality updates, with clear explanations and charts.
Please like this post to support me.
- Trading Guru
--------------------------------------------------------------
Disclaimer!
This post does not provide financial advice. It is for educational purposes only!


EURAUD Longshot!I feel like this price point will challenge at least 50% of the most recent high!
I entered this trade since the daily and the 4 hour were at the bottom of the stochastic and it seems like the current flag down is approaching its end.
Good Luck!
Tp's
1. 1.63405
2. 1.63869
3. 1.64382
4. 1.65188
5. 1.68292

NZDCAD Fire SaleLooks like we have a flag approaching!
Stochastic is at the top of the daily, 4hr, and 1 hour so why not right?
TP's:
1. 0.88342
2. 0.87996
3. 0.87548
4. 0.85776

US SUCKS......... in pictureU.S dollar index in a really important area, it may fall and makes the world happy GOLD, BITCOIN, METALS, and other currencies will meet new records

Check This Horizontal Level to Understand Cardano's Potential!All info can be found on the chart. DMs are open!

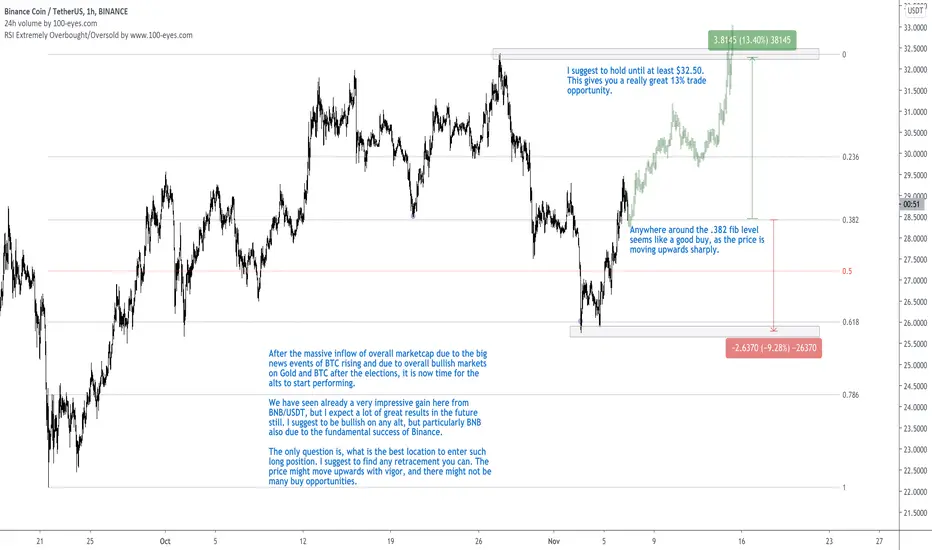
BNB With Fantastic 13% LONG Opportunity!After the massive inflow of overall marketcap due to the big news events of BTC rising and due to overall bullish markets on Gold and BTC after the elections, it is now time for the alts to start performing.
We have seen already a very impressive gain here from BNB/USDT, but I expect a lot of great results in the future still. I suggest to be bullish on any alt, but particularly BNB also due to the fundamental success of Binance.
The only question is, what is the best location to enter such long position. I suggest to find any retracement you can. The price might move upwards with vigor, and there might not be many buy opportunities.
Anywhere around the .382 fib level seems like a good buy already. I suggest to hold it until at least $32.5
Follow me for consistent high quality updates, with clear explanations and charts.
Please like this post to support me.
- Trading Guru
--------------------------------------------------------------
Disclaimer!
This post does not provide financial advice. It is for educational purposes only!

Sudden Run on BTC Can Lead to CRASHHi all, I wanted to share this quick analysis on the 1h with my followers. There is some interesting behavior on BTC that I've been looking at for the last hours that I want you to know about.
After every smooth run upwards, the price has dropped much much faster than the time it took to gain that price.
Now that we're in the consolidation phase as per my previous idea, I want to warn you. The price is relatively high again at ~13,600 and a crash might come soon.
Make sure you are not fully in long positions right now, and remember to buy low and sell high!
-Trading-Guru

[Educational Content] - How to trade RSI DivergencesIn this technical analysis I will go into depth on how to trade an RSI Divergence taking this beautiful textbook example here on NWC.
RSI Divergences help to mark reversal points. In this trade set-up I suggest a long position on NWC / BTC after we spotted an RSI Divergence and already have confirmed it at the horizontal level.
The horizontal level gets an insane confluence here after seeing three indicators align. First of all, the price is near the golden zone of the 0.618 fibonnaci retracement, second of all the price is near a strong horizontal zone and thirdly the price has seen a confirmed rsi bullish divergence.
*So, what are RSI Divergences*?
Regular divergences are reversal signals. When a regular divergence occurs, it indicates that the trend is strong but its momentum has weakened. It provides an early warning that a trend reversal (or at least a pull back) is likely to follow soon.
Regular divergences can be powerful and reliable entry triggers. In fact, as far as oscillators go (and technical indicators in general), regular divergences are considered the most reliable early signs of a local bottom or top.
Especially when confluence is present, regular divergences can provide “high probability” trading setups. Therefore, strategies involving divergences tend to be relatively forgiving when traded using a low Risk Reward Ratio.
For smaller marketcap coins it is also important to check fundamental principles. As you noticed over the last weeks I am a huge fan of NWC. As a trader myself, I am looking forward to the functionality that NWC will add. Interesting knowledge is that the roadmap of NWC is publicly available on their website, which means you can easily predict whenever major events are going to happen and trade accordingly. I found that in Q4 the mobile app is likely to be released, which adds to the bullish sentiment of NWC right now.
Follow me for consistent high quality updates, with clear explanations and charts.
Please like this post to support me.
- Trading Guru
--------------------------------------------------------------
Disclaimer!
This post does not provide financial advice. It is for educational purposes only!

New trades $CL $KMB $AIG $BKQuiet day in the markets, volatility down slightly, all sectors seem to be trading together in wait and see mode. No exits today, entered 2 new pairs trades. Will likely enter more trades tomorrow and Friday but don't plan on entering any new trades next week going into the election.
Jared

New trades today $EWG $EWD $CAR $URI $AMT $O$VIX inched higher to 29.2 and I expect it to hang around the 30 handle going into the election, no exits today, I put on 3 new pairs trades and plan on taking them off next week and most likely flattening my entire portfolio into cash going into election week.
Jared
