Silver/Gold ratio: Silver is stretched compared to GoldI love the setup in the Silver/Gold ratio here. Big upside with super low downside risk if you trade it as a pair, going long 1 lot of Silver futures vs 1 lot short in Gold futures. There was a 14 week down trend signal that expires today, which predicts a relief rally of 14 weeks could occur starting here. The daily chart has a bullish trend signal confirming today as well. See the stop loss recommendation on chart, it is a 2.1% downside risk in the ratio, so, size your trade accordingly.
Best of luck,
Cheers.
Ivan.
Pairtrading

Sell in May? A brief study on SEASONALITY (and stock picks)I am sure many have heard the saying “Sell in May and go away” in recent weeks. There is certainly a lot of evidence that May and the months that follow it do not have great track record of performance--
www.isabelnet.com
www.isabelnet.com
But does it mean BEAR MARKET? And are there any Seasonal Plays we could take advantage of? I think so. Some Sectors & Industries appear to generally do well (Gaming, Healthcare, IT/software) and others do poorly (Banking, Gold & Steel, Oil & Gas).
Criteria
Scanned Market Chameleon for Market Caps >$1 billion, Common stock types, with 7+ years of observations having good statistical success in May
(I made a quick indicator in Pine to highlight and help visualize the returns of a particular month over a span of time. It’s data may not line up with Market Chameleon’s Seasonality Screener results for a # of reasons, so I am giving them the final word and trusting their data over my script)
Market References
Market Indices ($SPY, $QQQ, $DIA, $IWM)
$VIX
-- The BEST Quadruplets of May --
Electronic Gaming & Multimedia ($EA, $TTWO, $ATVI, $ZNGA)
Good Sharpe ratios (0.92, 0.73, 0.49, 0.48)
Good Average and Median returns (median: 11.0%, 12.0%, 6.1%, 11.1%)
High % of Positive Occurrences (78%, 90%, 70%, 78%)
Aerospace & Defense ($HEI, $KTOS, $TDG, $WWD)
Good Sharpe ratios (0.98, 0.61, 0.56, 0.39)
Modest Average and Median returns (median: 4.6%, 13.0%, 5.2%, 2.9%)
High % of Positive Occurrences (89%, 70%, 60%, 70%)
Note: $HEI.A is actually technically a better performer than $HEI
Biotech ($REGN, $NBIX, $SRPT, $ALNY)
Overall Industry is strong in May
Great median and average returns
Note: This was a tough field as there are lots of good choices and ultimately comes down to the size of the standard deviation
Diagnostics & Research ($DGX, $ICLR, $ILMN, $EXAS)
Great Sharpe ratios (1.22, 1.19, 0.83, 0.72)
Great win rate
Low drawdowns
Honorable Mention: $CDNA scores great as well but does not have a ton of observations
Healthcare Plans ($UNH, $MOH, $CNC, $HUM)
Steady Eddy – low Standard Deviations, low drawdowns
Returns are nothing to write home about
Internet Content ($ZG, $IAC, $GOOGL, $NTES)
Pretty middle of the pack against other quads: good returns by median and average, good Sharpes, good % of positive returns
Packaged Goods ($STKL, $HAIN, $DAR, $BGS)
High win rate- 80%, 67%, 70%, 70%
Relatively speaking, drawdowns are not that bad to the Standard Deviation
Honorable Mention: $FRPT is a solid performer but not enough observations to be part of this group
Restaurants ($SHAK, $JACK, $TXRH, $CBRL)
Very high win rates- 100%, 90%, 80%, 70%
Modest returns, small draws
Chart is condensed because $SHAK hasn’t been listed for a long time (though there’s enough observations and its worth including into group) but here’s the chart w/o $SHAK--
Software Applications ($BMO, $WBK, $CS, $BBVA)
Incredible win rates- 100%, 88%, 75%, 88%
Worst returns/draws are TINY- 0.0%, -4.1%, -2.8%, -2.9%
Great Sharpe ratios
Not a ton of observations, smaller sample size
Software Infrastructure ($SPSC, $FIVN, $EVTC, $NEWR)
Great Sharpe ratios
Good Best returns vs Worst draws
Specialty Business Services ($CTAS, $UNF, $CPRT, $GPN)
Very high % of wins
Good Sharpe Ratios
Small Standard Deviations
-- The WORST Quadruplets of May --
Banks, Diversified ($BMO, $WBK, $CS, $BBVA)
High loss rates- 80%, 90%, 70%, 80%
The worst losses are, on average, about 3.2x greater than the best gains
High negative Sharpe ratios
Banks, Regional ($BBD, $ITUB, $BSBR, $FFBC
Great loss rates; average works out to a loss every May
The BEST gains are very small- +4.9%, +2.9%, +1.7%, +1.6% compared to the WORST draws- -23.0%, -20.5%, -17.4%, -13.6%
High negative Sharpe ratios
Farm & Heavy Construction ($OSK, $CNHI, $NAV, $CAT)
Small BEST gains compared to WORST draws- worst draws are about 3.44x greater than best gains
Mediocre negative Sharpes, modest negative averages/medians
Gold ($HMY, $GOLD, $NG, $BTG)
Industry as a whole seems seasonally depressed in May
High negative Sharpe ratios
Note: don’t confuse the TVC ticker for Gold (US$/oz) for the STOCK of the COMPANY $GOLD
Oil & Gas, E&P ($CPG, $MUR, $VET, $SM)
Oil & Gas industry in general is a terrible May performer
Industry in a general downtrend
High negative Sharpe ratios
Draw % isn’t terrific but the months that this industry gained are not strong
Oil & Gas, Equipment & Services ($FTI, $TS, $RES, $CLB)
Oil & Gas industry in general is a terrible May performer
High frequency of draws
High negative Sharpe ratio
Chart doesn’t do justice reflecting the WORST draws for May- averaging the worst comes out to -22.5%
Oil & Gas, Integrated ($E, $EC, $PBR, $SU)
Oil & Gas industry in general is a terrible May performer
Very high negative Sharpe ratio
Relatively low Standard Deviations
Specialty Industrial Materials ($FLS, $GE, $TRS, $XYL)
High draw % in May
Low Standard Deviations
Steel ($MT, $GGB, $SID, $CLF)
Very negative Sharpe ratios
Big Standard Deviations
High % draws in May- 80%, 90%, 70%, 80%
Tough field to select 4 from- industry in general does poorly in May
Telecom ($TEF, $VEON, $VIV, $TKC)
Good negative Sharpe ratios- -0.78, -0.65, -0.62, -0.58
Modest Standard Deviations
High % draws in May- 80%, 89%, 70%, 80%
Industry seems in a general long-term decline
Utilities - Diversified ($CIG, $OTTR, $AES, $ELP)
Good % draws in May- 78%, 70%, 70%, 70%
Despite general up-trend in Industry, does seem to do poorly in the month of May

BABA/BIDU, pair trading opportunity! Pair trading strategy: Both are Chinese Tech companies with positive correlation
Ratio has dropped to late 2018 level.
Long BABA
Short BIDU
I'm expecting ratio to go back to 1.5 or even higher!

MRNA long trade with a PPH hedgeI like MRNA long here and I feel it has closed a significant gap to the downside. The move today was quite bullish in terms of a reversal setting up and the Fib analysis shows that a potential retest of 135 zone may occur soon enough. This is in addition to some of the positive news that have been flowing on MRNA vs PFE vaccine usage as some states preferring MRNA due to low requirements on cold storage etc.
Nevertheless, I am not a fan of news driven trades and so I would like to pair this with a put hedge on PPH (figure below; courtesy @the_chart_life on Twitter). It is an interesting pair trade though PPH may not give me enough bang for the buck in case the market does turn and drag everything down with it. We shall see..

Streamr(DATA)/BTC - 2-5x Profit Incoming?Hello guys, We have been following a downtrend for a few weeks, and if you look into 1W TimeFrame, you can clearly see a Falling Wedge Pattern! As we are just about reaching the bottom, and if you realize what Falling Wedge means, you understand that there's lot of profit to take pretty soon! So my prediction is that between 28th December-11th January, we will be seeing ATLEAST 2x increase. Pretty excited to see how much further we can go!
Stay tuned guys!

Pair Trading - Mean Reversion on BTCUSDTPERP/ETHUSDTPERPPrice might be crossing under the fast MA (yellow) and revert towards the slow MA (purple), the mean. For this trade, you can do a 1.3-to-1 reward to risk setup - 3% target profit, 2.2% stop loss.
Pair Trading (from Wiki): A pairs trade or pair trading is a market neutral trading strategy enabling traders to profit from virtually any market conditions: uptrend, downtrend, or sideways movement. This strategy is categorized as a statistical arbitrage and convergence trading strategy.

Pair Trading - Mean Reversion on BCHUSDTPERP/LTCUSDTPERPPrice might be crossing over the fast MA (yellow) and revert towards the slow MA (purple), the mean. For this trade, you can do a 1.5-to-1 reward to risk setup - 9% target profit, 6% stop loss.
Pair Trading (from Wiki): A pairs trade or pair trading is a market neutral trading strategy enabling traders to profit from virtually any market conditions: uptrend, downtrend, or sideways movement. This strategy is categorized as a statistical arbitrage and convergence trading strategy.

Pair Trading - Quick Scalp on BCHUSDTPERP/LTCUSDTPERPSecond attempt for the price to cross the fast MA (yellow) and revert towards the slow MA (purple), the mean. For this trade, you can do a ~2.4% 1-to-1 reward to risk setup.
Pair Trading (from Wiki): A pairs trade or pair trading is a market neutral trading strategy enabling traders to profit from virtually any market conditions: uptrend, downtrend, or sideways movement. This strategy is categorized as a statistical arbitrage and convergence trading strategy.

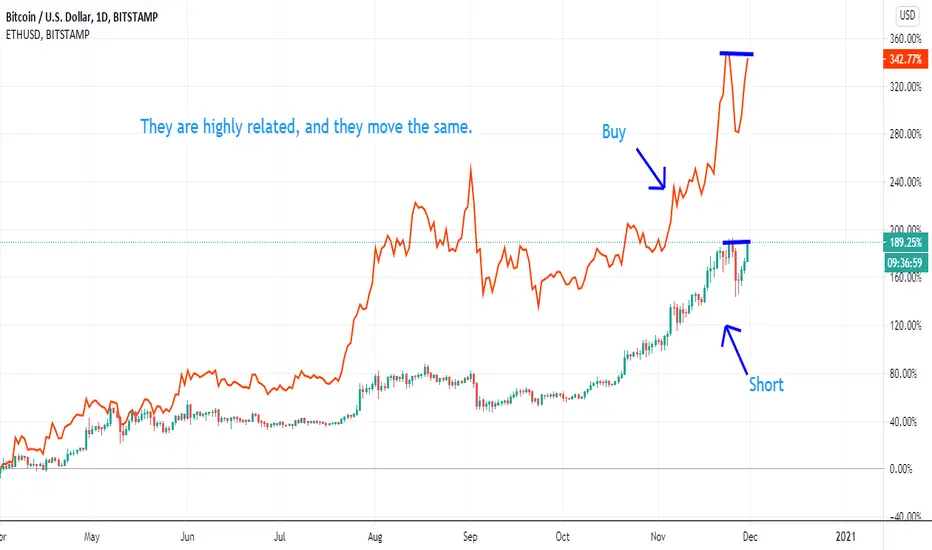
Crypto Pair TradeThis is a good pair trade where you buy one and short the other stock that is highly correlated. Ethereum and Bitcoin move similarly and are both at resistance. I think Ethereum has a better shot of breaking above it because it has a stronger Relative Strength Index. You can short Bitcoin and Buy Ethereum. This would be a good time to use this strategy. Thanks.
Pair trade: Long $TSLA, short $NIO$NIO is extremely over valued here, their competition in China is fierce, and $TSLA is leaps and bounds ahead of what they can achieve. Quarterly deliveries were like 1/10 of what $TSLA delivered in the last quarter that was announced...Sentiment is extreme and after complacency and euphoria we had a sharp down day at the top. There is a fund shorting it, and Ray Dalio bragging about his position in the stock recently. It's ripe for a short vs $TSLA, which is about to rally in the weekly timeframe. Valuation is wild compared to $TSLA, and competitive advantage goes to $TSLA here, considering all variables and the sales it has in China as well as their pricing for made in China cars.
You should short the same dollar amount of $NIO shares as you long $TSLA shares to get the pair trade going. I'd aim for a retest of 21.33 in this ratio at least, or could go into new highs as well. A 5-15% position would be fine here. Risk is roughly 3.06 to make 12.16, so a 3.97:1 reward to risk ratio.
Best of luck,
Ivan Labrie.

my hedged trade on FacebookHi everyone,
This is another trade taken today: Long Facebook vs Short JC DECAUX.
Facebook has lost about 20% from its august top.
Fundamentals are still strong (ROE, revenues, margin, cash flow), the management is strong as well.
I choose to hedge it with JC DECAUX, traditional advertising industry, with weakening fundamentals (debt and cash flow are bad), Moody's outlook is negative, and the management is not that good (actually they are the heirs of the founder, compare with Facebook that is run by its founder...).
This is implemented with barrier options maturing in 90 days.
Comments are welcome!


BIMAS/ISCTRBIMAS/ISCTR (W.LOG SCALE) Fena durmuyor. Kademeli strateji geliştirilebilir. Yukarıda formasyon hedefi 14 civarı ama buralar da teknik olarak sağlam direnç görünümünde. #pairtrade

GOLD to SILVER ratio pair trading WSSE20 time price levelsGann square 9 based time price levels for GOLD to SILVER ratio

PAIR TRADING EURUSD / USDJPYTHIS TUTORIAL IS ONLY FOR EDUCATION PURPOSE. TRADE AT YOUR OWN RISK. PAIR BUY AND SELL CONDITIONS
WAIT THE CORRELATION GRAPH TO COME BELOW ZERO. AND RSI SHOULD BE OVERSOLD AND OVER BOUGHT IN A SAME POINT.
BUY OVER SOLD PAIR AND SELL OVER BOUGHT PAIR AT THE SAME POINT. TARGET SHOULD BE AT THE INTERSECTION OF BOTH PAIR.

Recap 18.41 sunday 6 oct 2019Employing an ETF pairs strategy may be useful when there is a disconnect between assets that are usually highly correlated.
Sector, country, and index ETFs also provide opportunities for the pairs trader, usually involving going long on a strong ETF and short on a weaker one. It’s important to exit the trades when the assets realign or the trends of strong and weak assets reverse.
It would also be wise to set a loss limit on each trade, and realize that markets are dynamic; relationships that existed yesterday may not necessarily exist tomorrow.
Consider our S&P 500 and Dow Jones index example. These indexes are highly correlated and both are tradable via ETFs: the S&P 500 SPDR (SPY A) and the Dow Jones Industrial SPDR (DIA A-). When the two separate, they generally reconnect, although that can take days or months.

Potencial Venta +60 pipsObservamos un canal, cuyo recorrido paralelo es de aproximadamente de 150 a 160 pips. Desde el punto 135.457 se activa una venta hasta la próxima zona de liquidez.
Perseguimos un aproximado de +60 pips
TP1: 135.457
TP2: 135.324
TP3: 135.170


Divergence between ETH and BTC?Are you worried?
ETHUSD
Price action pros and cons
Bull Case:
Trading with in rising channel
Holding above 200sma
Holding above 50sma
Consolidating between $155 and $188\
Lack of strong selling pressure
Bear Case:
Difficulty staying above the 20sma
Lack of strong buying pressure
Stoch and AO still have room to move on the downside
Alt coins considerable weaker than Bitcoin
Correlations:
DATE BTC-LTC BTC-ETH ETH-LTC
1/16 ... 0.73 ... 0.26 ... 0.29
4/16 ... 0.94 ... -0.06 ... -0.06
7/16 ... 0.76 ... 0.06 ... -0.08
10/16 ... 0.67 ... 0.38 ... 0.22
1/17 .... 0.65 ... -0.01 ... -0.01
4/17 ... 0.20 ... 0.27 ... 0.1
7/17 ... 0.38 ... 0.19 ... 0.08
10/17 ... 0.64 ... 0.74 ... 0.65
1/18 ... 0.26 ... 0.13 ... 0.67
4/18 ... 0.77 ... 0.76 ... 0.74
7/18 ... 0.93 ... 0.92 ... 0.90
10/18 ... 0.83 ... 0.74 ... 0.87
1/19 ... 0.90 ... 0.88 ... 0.91
4/20 ... 0.86 ... 0.90 ... 0.82
Several articles have likened the recent lagging performance of altcoins to the situation they experience in Jan 2017. The articles have basically pointed out that traders will soon be selling there BTC to buy the cheaper altcoins, such as LTC and ETH. However, I would like to point out how the crypto environment has changed over the last couple of years. Before 1/17 there was often a negative correlation between BTC and the altcoins, but since 4/18 the correlation between the coins has been greater than 0.75. As a quick reminder: altcoins that approach 1 are closely correlated with Bitcoin, altcoins around 0 are not correlated with Bitcoin, and altcoins that approach -1 are inversely correlated with Bitcoin. This measurement is known as Spearman’s rank correlation coefficient. Thus, in this current highly correlated environment we as traders would be wise to keep our eyes on the leaders to predict future price action.
Comment and Feedback Welcomed!

XLF/KRE pair tradind idea paid out!Soem days ago I highlighted an interesting chart pattern related to the pair XLF/KRE, mentioning that AMEX:XLF could soon outperform AMEX:KRE . Well it turned out very well.
Follow me to get fresh pair trading ideas!

Pair Trading Idea DUK/XELDUK and XEL have a 84,3% correlation over 60 market days.
Applying some of the most popular indicators on the pair DUK/XEL shows an interesting pattern. While XEL has been clearly outperforming DUK since several weeks, a trend reversal seems to occur. DUK might catch up in the coming days and weeks. The daily and the weekly RSI (1st indicator at the top "Ultimate RSI Multi Timeframe"), the Wave Trend Oscillator (2nd one) and the ultimate MACD oscillator (3rd one from the top) reversed recently from their lower ranges. The Squeeze Momentum Indicator (at the bottom) shows a nice divergence, which is also observable on the RSI .
The setup is worth being given a shot: Short XEL, Long DUK . The strategy is market-neutral and is profitable when DUK starts to outperform XEL.
Follow me to get regular pair trading ideas!

Pair Trading Idea JPM/PRUApplying some of the most popular indicators on the pair JPM/PRU shows an interesting pattern. While PRU NYSE:PRU has been clearly outperforming JPM JPM since several weeks, a trend reversal seems to occur. JPM might catch up in the coming days and weeks. The daily and the weekly RSI (1st indicator at the top "Ultimate RSI Multi Timeframe"), the Wave Trend Oscillator (2nd one) and the ultimate MACD oscillator (3rd one from the top) reversed recently from their lower ranges. The Squeeze Momentum Indicator (at the bottom) shows a nice divergence, which is also observable on the RSI.
The price action confirmed the reversal in the last days. The setup is worth being given a shot: Short PRU, Long JPM. The strategy is market-neutral and is profitable when JPM starts to outperform PRU.
Follow me to get regular pair trading ideas!

Pair Trading Idea XBI/IBBApplying some of the most popular indicators on the pair XBI/IBB shows an interesting pattern. While XBI has been clearly outperforming IBB since several weeks, a trend reversal seems to occur. IBB might catch up in the coming days and weeks.
