PLTR BULLISH LONGIf PLTR graph break occurs, BULLISH
Entry here is risky. Waiting for the chart break to buy the stock reduces the risk. Those who want to take risks can enter here and earn high profits.
Palantir

PLTR Trade Update Updates on our existing PLTR Leaps from 2020. PLTR remains strong making new highs. Our Leaps from 2020 has moved deep ITM, look to book partial profits and move stops to break even if PLTR reaches wave 5 upside.

PLTR to $60 End Of MarchPalantir is continuing it's climb to $60, with massive catalysts and interest in this stock, i can see it getting close to this price by the end of March or sooner.

PLTR Earnings ProjectionsBasing some projections on recent cycle trends. I wouldn't be surprised to see some minor pullback to the $30 level again before we get a nice push to the $40 level (78.8% level) and potentially to the $45 level before seeing some downside by the end of the month to early March.

Palantir c-update 2.1Slowly finished the expected cup.
After the formation of the shape, if the exchange rate successfully erupts from it, an increase of the same volume as the height of the cup can be expected.
Bull on the springboard. (:
Good luck to everyone.
(A little correction: I corrected the yellow line because it shifted from what I had previously communicated and wanted to keep the credibility of the previous estimate.)

Palantir c-update 2.0Slowly finished the expected cup.
After the formation of the shape, if the exchange rate successfully erupts from it, an increase of the same volume as the height of the cup can be expected.
Bull on the springboard. (:
Good luck to everyone.

$PLTR IBM New Support a Rebound? Earnings soon!Video breakdown on $PLTR going into Earnings. Major putflow incoming but IBM news could change that.

PLTR Trade Update (wave 5 upside)PLTR bullish triangle breakout confirmed now looking to scale out with profits at wave 5


PLTR falling wedge patternIn my chart you can dee very nice patter `FALLING WEDGE`, that means that the stock will go up. Also the fib is dhowing the same sing - we have a strong support now. Hit like if you ar eholding with me!
Palantir - BUY The price was still rejected at the support of 31 usd. I believe it is time to buy, especially for the following reasons: Palantir Announces that results for its fourth quarter and fiscal year ended December 31, 2020 will be released on Tuesday, February 16, 2021, prior to the U.S. Open. markets. The Company will host a conference call to discuss its results at 6:00 am MT / 8:00 am ET.
This news correlates with the previous news: Palantir Reports Revenue Growth of 52% in the Third Quarter, Raises Full-Year 2020 Guidance, Full-year 2020 revenue guidance raised to a range of $ 1.070 billion to $ 1.072 billion, up 44% year-over year
I think that on March 16 the price will increase.

PLTR: Correction drop, but will be breakout again!PLTR: Considering some analysis to Palantir we can see that this company has a good standing, and also they are getting a lot of contracts. By technical view we can see that the stock is correcting itself now, after many traders were in, and it was expected a drop in price. But in the meantime if we see also with Fibonacci we can see a increase later on this stock. It was increased up to 40% in the begining, and now is stalling, but it will breakout on the days ahead.
In my opinion PLNTR is a worth investment. It is a bull stock!
NYSE:PLTR

Palantir BoomPalantir has broken out of its bullish continuation pattern and is now on the rise. Target of this move biased on the pennant is the mid $38 range, from that point shares will either test support at $33.60 or keep moving to resistance at the $44 level.
Good luck on your trades!
-Robbby

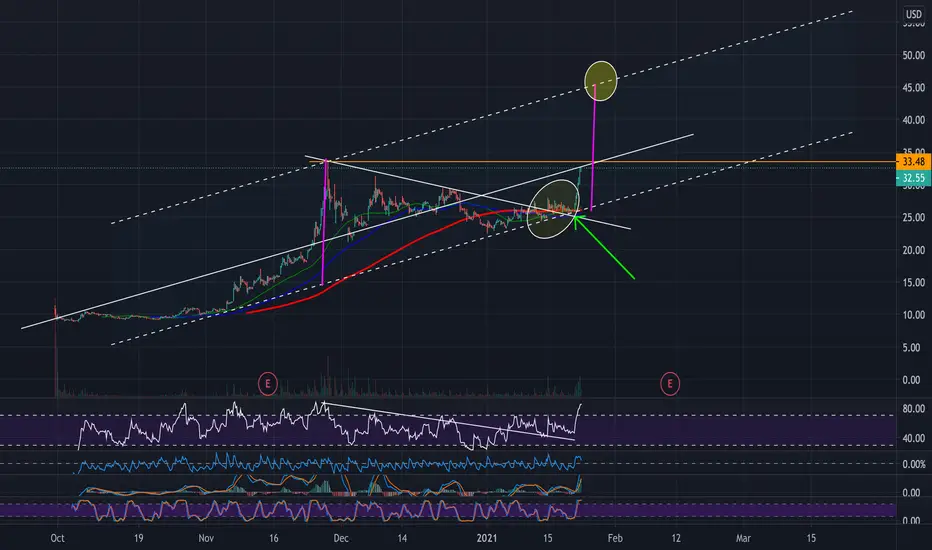
PLTR clean ABC complete. Off we go.Chart shows the fib extensions for clean ABC and subdivision of C. I have us going up a 3rd wave of the 3rd wave with the 1.618 extension of 1 to 2 at $58. The biggest hurdle will be breaking out of this channel. If we can't break out of the channel, looking for IPO range prices (think BTC 2018 correction pattern for a triangle).

PALANTIR Technical Analysis.PALANTIR recently broke that triangle and make new all time high. Overall PLTR still bullish but right now it ready for doing some correction towards our previous resistance (30$) consolidate their and continue it up trend.
See my previous analysis.
If you agree then like and support me.
Mention your thought in comments :)

PALANTIR Technical Analysis.PALANTIR recently broke that triangle and make new high of this year. If you look at the volume it increase instantly & last time when it happen the stock sell increase and price down rapidly. But this time I don't think it go that down because of the demo day & PLTR recently got some big contract too, So lets see what it do fall or takeoff.
See my previous analysis.
If you agree then like and support me.
Mention your thought in comments :)

US Stock In Play: $PLTR (Palantir Technologies Inc)$PLTR further reinforced its technical strength, with a rally of +11.20%, closing at an all time high level of $36.23 that was previously highlighted two days ago. The intraday trading range of $PLTR exceeded 35%, marking it as the most volatile session for $PLTR since its IPO. This is coupled with 191.35 millions worth of shares traded during the session, exceeding 165% of its average.
Price volatility for $PLTR continue to uptick towards its peak of $3.00/day, giving substantial traction to break $40 round number resistance ahead of its inaugural Demo Day today at 4.30pm US ET.

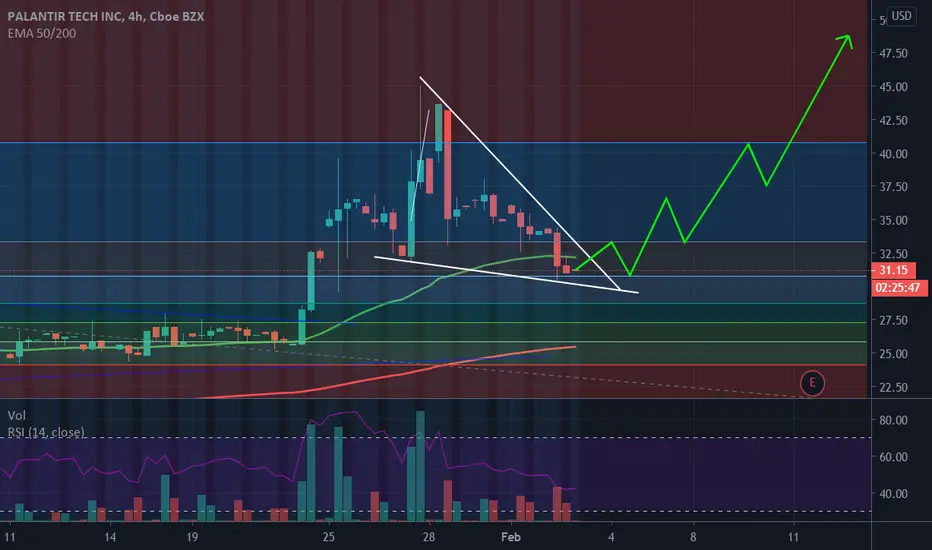
Palantir Update - $45 targetWe might see consolidation but eventually this set up looks extremely bullish. Breakout of a symmetrical triangle, retest and a power move up. Expect the next leg to be equal to the height of the symmetrical triangle we just broke out of. Any dip should be bought.
Palantir Tech Inc Stock Analysis - Palantir CONTINUATION PATTERN - SYMMETRICAL TRIANGLE UPTREND
The Idea is to go long for a long term investment
NYSE:PLTR

