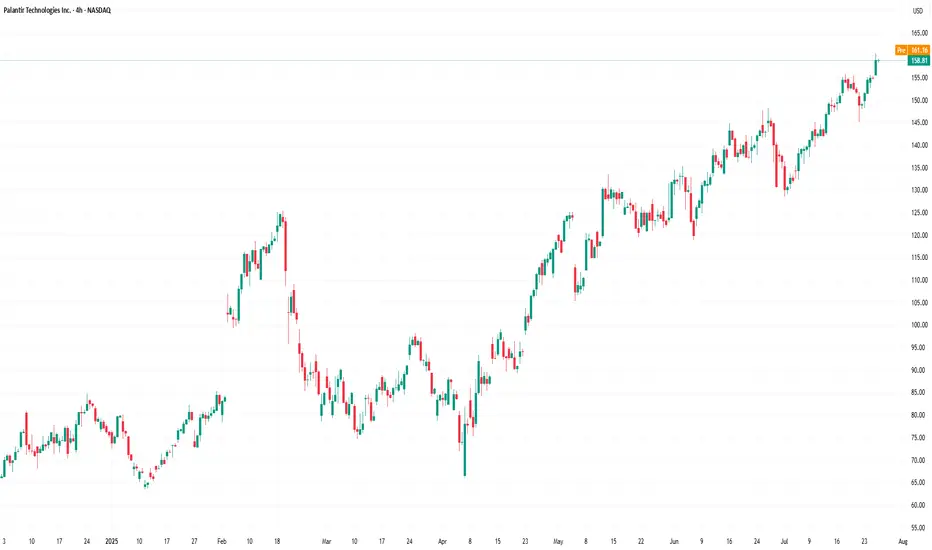
Palantir Technologies (PLTR) Shares Surpass $160Palantir Technologies (PLTR) Shares Surpass $160 for the First Time
Shares of Palantir Technologies (PLTR), a company specialising in big data analytics software, have continued their impressive performance. Following an extraordinary rally of approximately 340% in 2024, the stock remains among the top performers in the equity market:
→ since the beginning of 2025, the share price has climbed by approximately 113%;
→ on Friday, PLTR set another all-time high, with the share price exceeding $160 for the first time.
What Is Driving Palantir Technologies (PLTR) Higher?
The bullish sentiment is underpinned by the following factors:
→ Major partnerships. Among the contracts are an agreement with the US Army to develop a command system, collaboration with Accenture Federal Services, and many others.
→ Positive analyst outlooks , highlighting Palantir’s unique growth model and high margins. Analysts at Piper Sandler have set a price target of $170 for PLTR, while Wedbush recently raised their target to $160.
In addition, investors are looking ahead with optimism to the upcoming quarterly report scheduled for 4 August, which is expected to reinforce Palantir’s leadership position in a market increasingly driven by AI technologies.
Technical Analysis of Palantir Technologies (PLTR) Chart
Price action has formed an ascending channel (shown in blue), with a notable bullish pattern: each pullback (marked with arrows) has been followed by:
→ a lack of further downside momentum;
→ a rebound above the level where the decline began.
From a sentiment perspective, it is reasonable to infer that price dips are perceived not as warning signs, but as opportunities to accumulate a high-performing stock at a relative discount.
Given these factors, we expect that the upcoming earnings report could propel PLTR shares towards the upper boundary of the blue channel.
This article represents the opinion of the Companies operating under the FXOpen brand only. It is not to be construed as an offer, solicitation, or recommendation with respect to products and services provided by the Companies operating under the FXOpen brand, nor is it to be considered financial advice.
Palantirtrading
PALANTIR: Bullish breakout to $260 imminent.Palantir is on a strong bullish 1D technical outlook (RSI = 62.809, MACD = 6.320, ADX = 29.658) as it maintaines a Channel Up pattern that is supported by the 1D MA50. The starting point was of course the April 7th 2025 bottom and it looks very similar to the previous major bottom on the 1D MA200 on August 5th 2024. Expect the same total rise (+299%) before the next 1D MA50 test. TP = 260.
See how our prior idea has worked out:
## If you like our free content follow our profile to get more daily ideas. ##
## Comments and likes are greatly appreciated. ##

PALANTIR: It's a buy but don't expect a rally any time soon.Palantir is bearish on its 1D technical outlook (RSI = 41.509, MACD = -1.570, ADX = 35.869) as it's trading under the 1D MA50. The long term pattern is a Channel Up that gives a strong buy signal every time it hits its 1D MA100. As a matter of fact, the February 19th High has been a HH for the pattern and last time the price hit that top (July 31st 2023), it entered a lengthy Accumulation period. As in today, the 1D RSI was again on a similar Bearish Divergence. Consequently we believe that every 1D MA100 test is a buy opportunity, but the breakout rally will probably take another 4-5 months to happen. Aim for the 1.786 Fibonacci extension (TP = 200.00).
See how our prior idea has worked out:
## If you like our free content follow our profile to get more daily ideas. ##
## Comments and likes are greatly appreciated. ##

PALANTIR: 1st test of the 1D MA50 since August. Is it a BUY?Palantir has turned bearish on its 1D technical outlook (RSI = 42.953, MACD = 2.150, ADX = 40.007) as it almost touched the 1D MA50 today for the first time in 5 months. The last time it was under it was on the August 5th low (which was supported by the 1D MA200) and is practically the trendline that helped the stock go parabolic inside the curved channel you see on the chart. Even if the 1D MA50 marginally breaks, the trend will stay bullish as long as the RSI S1 Zone supports. Until it breaks, we will stay bullish on PLTR, expecting the parabolic channel to make at least one more bullish wave, aiming for a standard +60% rise (TP = 100.00).
## If you like our free content follow our profile to get more daily ideas. ##
## Comments and likes are greatly appreciated. ##

Palantir (PLTR): Is $79 the Key to Big Moves?Morning Trading Family
Palantir is at a crossroads, and $79 is the level to watch. Whether it holds or breaks will tell us a lot about what’s coming next. Let’s keep it simple and dive in.
If PLTR Breaks Above $79
The bulls might take charge, and here’s where we could be headed:
$82: The first stop. We’ll see if the bulls have enough strength to push through this.
$93: If $82 gets taken out, this could be the next big move.
If PLTR Stays Below $79
it could get a little rough. Here’s what to watch:
$64–$66: This is the median line and a possible landing zone if the selling continues.
What’s the Game Plan?
Keep it simple:
-Watch $79—it’s the key.
-Be ready for both the bullish and bearish moves.
-Stay disciplined and manage your risk.
If you like this breakdown, give it a follow or a like. Got questions about Palantir or struggling with another chart? Send me a DM—I’d love to chat!
Feeling stressed, burnt out, or finding it hard to stay consistent as a trader? You’re not alone. Reach out—I’m here to help you trade smarter and stay balanced. Let’s crush it together!
Kris/ Mindbloome Exchange
Trade What You See

PALANTIR: Extremely overbought. High probability sell to $40.Palantir is vastly overbought on its 1D technical outlook (RSI = 79.771, MACD = 3.330, ADX = 33.075), even the 1W RSI is on extreme levels (80.789) and that alone would be a good enough reason to sell. The picture gets even clearer on the 1W timeframe where the price has almost reached the top of the 2 year Channel Up, having completed a +241.84% rise from the January 2nd 2024 bottom and almost +172.53% rise from the August 5th bottom. Those are the symmetrical rally levels from the December 27th 2022 and May 1st 2023 Lows respectively. The result on that HH rejection was a test of the 0.382 Fibonacci level. That is our target (TP = 40.00).
See how our prior idea has worked out:
## If you like our free content follow our profile to get more daily ideas. ##
## Comments and likes are greatly appreciated. ##

PALANTIR: Best buy opportunity since January.PLTR is bearish on its 1D technical outlook (RSI = 33.299, MACD = -0.640, ADX = 35.931) as it trades under its 1D MA50 and today reached the 1D MA100 for the first time since February 5th. Even though the 1 year Channel Up still has some downside to bottom on its 1D MA200, this is technically the best buy opportunity since the January 31st low as the 1D RSI entered the 1 year Support Zone. This is the 3rd correction inside this Channel and each leg is -4% shorter, so the current -25% correction from the top is a fair Low to buy. The accumulation at the bottom of those corrective waves has been between 4-6 weeks so the market may take its time to accumulate towards the end of May and then rally aggressively. Fair target, the 1.236 Fibonacci extension (TP = 29.00).
See how our prior idea has worked out:
## If you like our free content follow our profile to get more daily ideas. ##
## Comments and likes are greatly appreciated. ##
