The June CPI, South Africa, And Another Trial In Precious MetalsGold was sitting around the $1825 on Friday, July 16. Silver was over $26, platinum was near the $1140 level, and palladium was around $2700 per ounce. All four of the precious metals that trade on the COMEX and NYMEX divisions of the Chicago Mercantile Exchange have been trending higher over the past years. Gold and palladium reached all-time highs over the past year.
The June CPI comes in on fire
The inflation data is not a validation of “transitory”
Passing a bullish baton from one sector to the next
South Africa is on fire- Precious metals supplies could decline- Another trial begins this week
The next leg up for gold, silver, platinum, palladium and other PGMs could be on the horizon
Precious metals tend to rise in inflationary environments as the economic condition erodes money’s purchasing power. The tidal wave of central bank liquidity and tsunami of government stimulus has increased the money supply exponentially over the past year. Rising money supply weighs on fiat currency values. While all four of the precious metals are below their highs for 2021 and over the past years, the path of least resistance for prices on a long-term basis remains higher.
When it comes to gold, every substantial price dip has been a buying opportunity over the past two decades. The current environment suggests that it will continue. Moreover, the recent events in South Africa, a leading gold and platinum group metals producer, could put additional upward pressure on prices.
The June CPI comes in on fire
The June Consumer Price Index rose for the third consecutive month posting a 5.4% increase in June. Excluding food and energy, it was 4.5% higher, the most substantial gain since September 1991. While the Fed and other analysts blamed one-third of the rise on used car and truck prices, any consumer knows prices are rapidly rising. The Fed continues to view the data as “transitory.”
The market’s reaction continues to be another indication that the central bank will roll out plans to taper quantitative easing and schedule liftoff from the zero percent short-term Fed Funds rate. However, one factor may make any move by the central bank moot.
The inflation data is not a validation of “transitory”
The Fed Chairman and the Secretary of the Treasury believe that inflationary pressures are “transitory,” blaming the data on pandemic-inspired bottlenecks in the supply chain. However, with Congress discussing another $3.5 trillion in spending, even if the Fed tightens credit, the government’s stimulus tsunami continues to flood the financial system.
The CPI data and rising retail prices are the price tag for the stimulus and tidal wave of central bank liquidity that began over one year ago.
Passing a bullish baton from one sector to the next
We have seen inflationary pressures rise in markets across all asset classes. The economic condition erodes money’s purchasing power. The stock market has risen to all-time highs. We witnessed parabolic moves in cryptocurrencies earlier this year. While Bitcoin, Ethereum, and many other cryptos halved in value from the April and May highs, they remain far higher than at the end of 2020 and many times the price levels at the 2020 lows. In commodities, gold rose to a record high in August 2020. While the yellow metal corrected, it continues to consolidate at above the $1800 per ounce level at the end of last week. Silver rose to its highest level since 2013 when it probed above the $30 level in February before correcting. Platinum rose to its highest price since 2014 before moving lower. In May, palladium, along with lumber and copper, reached all-time highs. Rhodium, a platinum group metal that only trades in the physical market, reached almost $30,000 per ounce this year.
Grain prices rose to eight-year highs earlier this year. Sugar and coffee reached multi-year peaks. The latest sector to move to the highest level in years was energy as the nearby NYMEX crude oil futures contract traded at $76.98 per barrel on July 6, the highest price since 2014. Natural gas moved to $3.822 per MMBtu on July 6, the highest price since late 2018, with ethanol at an over seven-year high and coal prices at the highest price in a decade.
The raw materials asset class has been passing the bullish baton from sector to sector in an inflationary relay race over the past year. Bull markets rarely move in a straight line, but the trends remain bullish, reflecting the rising inflationary pressures.
South Africa is on fire- Precious metals supplies could decline- Another trial begins this week
After another attempt at a rally, precious metals sold off at the end of last week. The prospects for higher interest rates push the US dollar higher, which tends to be bearish for the precious metals. However, gold remained above $1800 per ounce, silver is over the $25.50 level, platinum was at $1100, palladium was around $2.640, and rhodium was at a midpoint of $19,100.
At the March 2020 lows, gold found a bottom at $1450.90, silver fell to $11.74, platinum reached $562, and palladium fell to $1449.90 per ounce. Rhodium declined to $2000 per ounce.
South Africa remains a leading producer of platinum group metals. 72% of annual platinum supplies come from South Africa, along with 36% of palladium, 82% of rhodium, 81% of ruthenium, and 87% of iridium. Ruthenium and iridium are other platinum group metals that trade in the physical market. While South African gold production has declined over the past year, the country still produced around 99.2 metric tons of gold in 2020.
South Africa is currently facing the worst political violence since apartheid ended 27 years ago. Violent riots and looting in the aftermath of the jailing of former President Jacob Zuma are gripping the country. Persistent poverty and the global pandemic’s toll have only exacerbated political violence and upheaval. As South Africa faces the potential for a civil war, precious metals production could suffer over the coming months and perhaps years, creating the PGM shortages and limiting gold output from the mineral-rich nation.
Meanwhile, the greener path for energy policy only supports the demand for platinum group metals. As supplies from South Africa may decline, the demand will continue to grow, putting upward pressure on prices. Rising inflation and the South African political landscape support all precious metals prices.
Meanwhile, this week, two traders accused of felony-level crimes in the precious metal markets go on trial in Chicago. Federal District Court Judge John Z. Lee will preside over the trial of John Pacillo and Edward Bases. The pair last traded for Bank of America Merrill Lynch. Mr. Bases had traded precious metals for Morgan Stanley, Deutsche Bank, Bear Stearns, and Merrill Lynch since the 1990s, while Mr. Pacillo has an equally long resume. A jury at the most recent Chicago trials of two Deutsche Bank traders, John Vorley and Cedric Chanu, returned guilty verdicts. Both were sentenced to one year in prison. Bases and Pacillo pleaded not guilty to the charges. A jury of their peers will decide their fate this week. More traders, including three from JP Morgan Chase, await their days in court.
While the trials and sentences will not impact precious metals prices, trader’s behavior will change as a prison cell, and lifelong branding as a felon is a far cry from the comforts of a trading room. I ran one of the leading precious metals dealing desks in the 1980s and 1990s and know some of those charged, including Mr. Bases. I will save any comments for after the accused have their days in court.
The next leg up for gold, silver, platinum, palladium, and other PGMs could be on the horizon
Platinum group metals suffer from illiquidity on the futures exchange. The lack of visible stockpiles and the supply versus demand equations in the PGMs does not allow for robust futures or forward markets. Less liquid commodities tend to experience far higher volatility levels. Lumber is one of the least liquid futures markets. The price of wood from the $251.50 level in April 2020 to $1711.20 one year later in May 2021. At the end of last week, the price was below $550. Traders call markets like lumber roach motels as market participants can get into long or short risk positions but getting out when the market moves in the opposite directions can be more than a challenge. Platinum and palladium futures quality as roach motels.
Meanwhile, increasing demand for PGMs because of the rise of environmentally friendly energy policy supports their prices. The upheaval in South Africa may only exacerbate upside price action if supplies decline. When it comes to gold, every dip over the past two decades has been a buying opportunity.
The quarterly chart highlights the bullish price action in gold and the pattern of higher lows and higher highs that began in 1999 at $252.50 per ounce. Gold may have corrected from the August 2020 $2063 high, but the price action remains in bullish mode from a long-term perspective.
Silver is a highly speculative metal that attracts herd behavior when the price begins to trend. In 2020, silver traded in an $18.175 range from low to high. So far in 2021, the trading band has been only $6.61, with silver making a marginally higher high and higher low. When precious metals embark on the next leg to the upside, silver is likely to have a magnetic pull for a herd of buyers.
Rising inflation and the political landscape in South Africa are bullish for precious metals. While the US Federal Reserve may pivot to a more hawkish monetary policy stance, government stimulus shows no sign of slowing. It may only be a matter of time before the precious metals sector takes the bullish baton in the inflationary relay race that has been underway since the 2020 bottoms.
Use the links below to sign up for free early access to new posts and register for the free Monday Night Strategy Call.
Trading advice given in this communication, if any, is based on information taken from trades and statistical services and other sources that we believe are reliable. The author does not guarantee that such information is accurate or complete and it should not be relied upon as such. Trading advice reflects the author’s good faith judgment at a specific time and is subject to change without notice. There is no guarantee that the advice the author provides will result in profitable trades. There is risk of loss in all futures and options trading. Any investment involves substantial risks, including, but not limited to, pricing volatility, inadequate liquidity, and the potential complete loss of principal. This article does not in any way constitute an offer or solicitation of an offer to buy or sell any investment, security, or commodity discussed herein, or any security in any jurisdiction in which such an offer would be unlawful under the securities laws of such jurisdiction.
Palladium

PALLADIUM - Wait For The Trigger!Hello everyone, if you like the idea, do not forget to support with a like and follow.
PA1! is sitting around the round number 2900 so we will be looking for sell setups on lower timeframes.
on M30: PA1! formed a valid trendline in red but it is not ready to go yet.
Before we sell, we want the sellers to prove that they are taking over again.
You don't want to sell a bullish market right?
Trigger => Waiting for a momentum candle close below the last swing low (in gray) to sell.
Until the sell is activated, PA1! would be overall bullish and can still trade higher till the 3000
and of course, as it approaches the lower green support 2500, we will be looking for trend-following buy setups.
Good luck!
All Strategies Are Good; If Managed Properly!
~Rich

Palladium Hits Strong Resistance! What Next?Since our last post, palladium has made good progress, moving up $90 to meet the resistance
from February 2020. Price is at an interesting point, because a clean break above and we
should see price move towards the all-time high at $3017.
The weekly 50 simple moving average has aided this gradual upwards move. The first break of
$2875 was short-lived as price came tumbling down and reentered consolidation in April/May.
Price is still in consolidation, and the longer it does so, the bigger the move we can expect
in the direction of the breakout.
So should we see a breakout to the upside, which is the bias as the prior trend was bullish,
we can expect a solid long-term uptrend to unfold.
This is why we want to position ourselves to take advantage of any breakouts that may occur.
It will require some patience while price sets itself up, but the reward will more than make
up for the time sitting on the sidelines.
We will continue to follow the journey of this commodity.
See below for more information on our trading techniques.
As always, keep it simple, keep it Sublime.


Palladium Ready For A Breakout?Palladium looks set to make another attempt at breaking out of the 16 month period
of consolidation, which began in February 2020.
A break above the consolidation high at $2875 was made in April this year, but that
was short-lived as price returned back into the consolidation zone after being forced
down by the $300 round number psychological resistance level.
During the sideways market movement, price has still respected the 50 simple moving
average, which has acted as support, helping price create higher lows.
Last week we had a reversal just around the 50 simple moving average, which was shown
in a recent post, and this week price is gaining momentum and heading towards
resistance at $2875.
If this level is broken then we still have the $3000 round number and the all-time high
at $3017 in the way.
The long-term movement has been bullish prior to the consolidation period, so the bias
is for a break out to the upside.
Should we finally have a breakout, then we should see a linear trend unfold as this
commodity has trended really well in the past.
See below for more information on our trading techniques.
As always, keep it simple, keep it Sublime.

PALLADIUM Excellent long-term buy opportunityPattern: Channel Up on 1D.
Signal: Buy as the price is rebounding after hitting the 1D MA200 (orange trend-line) and the 1 year RSI Support. You can wait for the MACD Bullish Cross to confirm that.
Target: 2950 (top/ Higher High of the Channel Up) and 3300 in extension (1.5 Fibonacci extension as with previous Highs).
** Please support this idea with your likes and comments, it is the best way to keep it relevant and support me. **
--------------------------------------------------------------------------------------------------------
!! Donations via TradingView coins also help me a great deal at posting more free trading content and signals here !!
🎉 👍 Shout-out to TradingShot's 💰 top TradingView Coin donor 💰 this week ==> StockSwinger
--------------------------------------------------------------------------------------------------------

Palladium Bounces After Free FallFollowing the free fall we witnessed in Palladium last week, price has appeared to have
found some form of support just above the 50 simple moving average.
Price does tend to hit the 50 simple moving average, so if we see further declines, we may
see price tag this indicator before seeing a continuation to the upside.
In April this year, price had finally broken out of the 14 month-long period of consolidation
but then struggled to remain above the consolidation resistance level at $2875.
With price back inside the consolidation zone, we need to see another breakout but this
time above the new all-time high at $3017. This would also mean a breakout above the
$3000 round number.
Overall, price is creating higher lows, but as price is still in the consolidation zone, its
behaviour may be unpredictable, which is why we wait for breakouts to confirm trend continuations.
See below for more information on our trading techniques.
As always, keep it simple, keep it Sublime.

South Africa (EZA) a good Precious Metals playPrecious metals (PM) have really struggled this week, with the following weekly movement in USD:
Gold TVC:GOLD -5.65%
Silver TVC:SILVER -7.17%
Platinum TVC:PLATINUM -7.2%
Palladium TVC:PALLADIUM -8.23%
All these PM’s seems to be heavily oversold over the shorter-term, which could see a bit of a recovery over the next week or two. Why is this important? Currently 24% of EZA consists of PM’s, which was the main reason for the recent pullback in the ETF. EZA finds itself at a strong support level and very close to EXTREME OVERSOLD levels according to its 14-day RSI. Should $48.50 not hold up, my stop loss would be at the 200-day Moving Average (EMA). This currently is $46.86. Should we see a bounce off the current levels, could see EZA test the 50-day EMA at 51.29 resistance, with a break and close above these levels, most probably bringing back new 12-month highs. I am somewhat worried about the negative recent momentum and will monitor closely

Commodities - Palladium watch for ShortIdea for Palladium:
- 2 Potential short swing trades coming up with good R/R.
- Currently bullish Trend, bearish Trade.
- Can make Trend Ascending Triangle and breakout, or Rising Wedge reversal with a local Head and Shoulders.
- I am looking to short the re-test of the breakout to the downside.
GLHF
- DPT

Palladium Down 9%Palladium is currently taking a dive, and something similar is happening with Gold and
Silver right now. The news is likely fueling this and the decline could be short-lived.
In April of this year, price had broken out and created a new record high at $3017, hitting
the $3000 round number. This psychological level of resistance created an obstacle for
price and forced price down.
This week, we see a strong bearish move with the next level of support based on this
timeframe being the 50 simple moving average.
Price has used this indicator as support several times in this stock’s history, so this is the
obvious level that price may gravitate towards.
Palladium has been making good progress since the 47% decline during the 2020 global
pandemic, and this is just another bump in the road that price will need to navigate around.
Patience for now as we wait to see how far price will drop and what price will decide
to do once it finds support.
See below for more information on our trading techniques.
As always, keep it simple, keep it Sublime.

Gold, metals and oil are definitely back and looking very strongGold was falling as real yields were going up, but now that that trend has reversed gold is looking better. Gold has successfully broken and retested many key levels + several important moving averages and pivots. In the past I thought 1680 would break even just in the short term and it is still a possibility, but looks less likely at the moment.
Currently Gold is at a bit of resistance and could pull back a little bit. The key level is 1980 where it could have a major trap and then a decent correction before going higher. Yes there are some issue with gold too, especially as it is still below its 2011 ATH, but once it starts closing above it again things could change rapidly. Metals overall seem really strong, with Silver gearing for a big breakout although there is still a chance of failure at the resistance above. Palladium still going hard and seems relentless. Copper at its 2011 ATHs still looking decent although it might pullback a little bit. Oil although not a metal, is very important and it also looks extremely explosive. The upside for oil at this point almost seems unlimited. The bear market for oil ended with that insane capitulation where prices went negative on the front month contract. For many reasons the production of oil has taken a big hit and now that demand is coming back, and coming back strong especially due to money printing. So from here Oil could easily hit 100$/barrel by EOY.
Point is that inflation is rising, commodities are rising and will potentially keep on rising mostly due to supply shortages, but also due to excess speculation and money printing. Gold might not be the best bet in this situation, but it is definitely an asset to own as insurance. Maybe the downturn in cryptocurrencies also had to do with people switching back to Gold and other assets. Maybe Gold is a signal that something bad is coming and that thing might be high inflation or even bad deflation that could bring issues to the system. Either way dips are for buying in these assets.

Platinum cant hold support levelsSeveral support levels has failed in Platinum, now testing a declining triangle. Commodity futures should be up because of the pressured fed rates and shortages in supply. However hit in the car manufacturing industry is pressuring platinum levels as well. Platinum prices were above gold and palladium before pandemic and is expected to catch up at some point. However we need to see a definitive price turnaround for that.


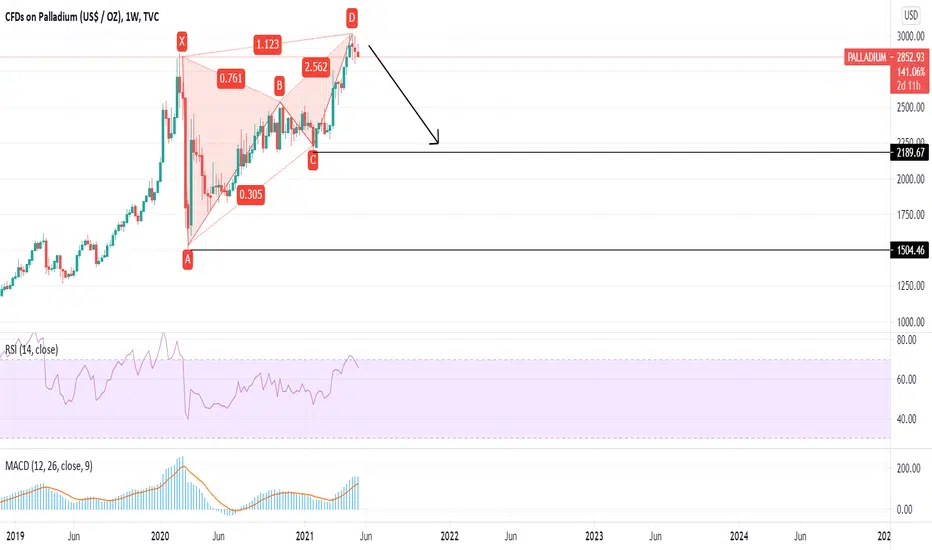
Pallidum -Bearish Butterfly Harmonic PatternIt seems the bearish butterfly harmonic pattern is formed and can put palladium under pressure with increasing in sell positions. So It can touch the targets in .
PALLADIUM Trade based on the 4H MA200 and the 1D MA200Pattern: Channel Up on 1D.
Signal: As long as the 4H MA200 (yellow trend-line) supports, buy the dips. If it breaks potential prolonged sideways action until the 1D MA200 (orange trend-line) approaches.
Target: Trade within the patterns that will be formed.
** Please support this idea with your likes and comments, it is the best way to keep it relevant and support me. **
--------------------------------------------------------------------------------------------------------
!! Donations via TradingView coins also help me a great deal at posting more free trading content and signals here !!
🎉 👍 Shout-out to TradingShot's 💰 top TradingView Coin donor 💰 this week ==> xBTala
--------------------------------------------------------------------------------------------------------

Palladium Setting Up To Go LongPalladium had a nice run between 2018 and 2020 with a rise of 245% during this period
before the Covid-19 pandemic hit price.
From that point, price created an all-time high at the time of £2875, then there was
a sharp decline to near the $1500 round number.
The round number and the 50 simple moving average cushioned the fall and gave price
enough support to find its footing.
Price has slowly been climbing back up, using the 50 simple moving average as support
along the way, and went on to create new all-time highs last month at $3017.
The previous all-time high is below price and has acted as support already and may be
the base price needs to help it to continue creating record highs.
If price can break and close above the recent high, this would also take price above
the $3000 round number and allow us to look for a position in this commodity.
See below for more information on our trading techniques.
As always, keep it simple, keep it Sublime.

GRDM -- Massive Copper & Palladium intercept!Grid Metals Intersects 37.6 g/t Palladium and 21.3% Copper in Massive Sulfide Vein at East Bull Lake; Parisien Lake Zone Continues to Expand
TORONTO, ON / ACCESSWIRE / May 5, 2021 / Grid Metals Corp. (the "Company") (TSXV:GRDM)(OTCQB:MSMGF) is pleased to report new results from three additional drill holes from the Central Parisien Lake Zone at its East Bull Lake palladium property (the "Property") located near Sudbury, Ontario. Drilling hit multiple zones of palladium-dominant mineralization including a footwall copper sulfide vein containing 1.2 ounces per tonne palladium. Drilling results received over the last ten months combined with geophysical data confirm the presence of a persistently mineralized layer along the base of the East Bull Lake intrusion having the potential to host multiple, near surface palladium-rich copper-nickel sulfide deposits.
Highlights
Drillhole EBL 21-09 intersected three discrete zones of palladium-rich sulfide mineralization including a footwall copper sulfide vein which grades 37.6 g/t Pd (1.2 oz/tonne Pd), 6.68 g/t Pt and 21.3% Cu over 0.54 metres within a two metre mineralized interval averaging 10.7 g/t Pd and 5.87% Cu. Similar grades are present in footwall copper sulfide veins in major magmatic systems, globally - including both the Sudbury and Noril'sk mining camps. An offhole conductor adjacent to this vein was subsequently detected by borehole geophysics.
Drill hole EBL21-07, drilled 70 metres southeast from EBL21-09, also intersected wide zones of palladium mineralization having local higher-grade sections including 1.0 metres of 11.5 g/t Pd from 6.0 metres depth.
EBL21-08, the most northerly and westerly hole drilled in the target area, is a 350 metre step out from the main area of drilling. It intersected a narrow, higher-grade section in the Basal Layer (0.75 metres with 4.64 g/t Pd and 1.19 Pt).
The area between hole EBL21-08 in the west and holes EBL21-07 and 09 in the east is over 200 metres wide and is centered on a potential north-striking feeder fault that remains to be drilled.
Palladium mineralization continues to be associated with an extensive, inclusion-rich gabbro layer that blankets the base of the East Bull Lake intrusion, herein referred to as the "Basal Layer." The Company is now confident in its ability to predict the position of the Basal Layer to depths exceeding several hundred metres across the entire >20 km strike length of the property using a combination of resistivity, conductivity and magnetic survey data.

PLG: BULL FLAG BREAKOUTPLG :
Nice bull flag breakout. Price heading to 1st resistance of 5.68 - 6 zone.
If we break the 6 zone, the flag target is around 9-10, which matches with past support-resistance zone.
Trade safe.

Short Palladium @ 2,882; TP @ 2,550 & SL your choiceShort Palladium @ 2,882; TP @ 2,550 & SL your choice


Palladium 23 Points To Breakout!Palladium should not be ignored even if there are strong moves happening in other markets because this
commodity has the potential to trend well long-term.
The trend between January 2016 and February 2020 saw a 542% move to the upside allowing for the
accumulation of simple profits during that period.
As expected, price went into consolidation following such a strong move but within this consolidation
period, price has slowly been climbing its way back up.
On the weekly chart shown, we can clearly see that price has been using the 50 simple moving average
as support to assist it in climbing higher.
This week price came close to breaking out above the all-time high at $2875 by just 23 points, so there
is good progress since our last post.
If price eventually breaks out, we anticipate a strong trend in the direction of the breakout. We will
also need to wait for a break and close above the $3000 round number which is a psychological level of
support/resistance. Patience for now as we await that breakout.
See below for more information on our trading techniques.
As always, keep it simple, keep it Sublime.

XPDUSD WAVE 5XPDUSD Broke out of a channel that was the for a loing term, retested the level and looks like it will continue trending upwards to make the 5th wave
Share thoughts in comments
Like the work and follow for more trade ideas and education
