Chalice Golde Mines Major Breakout $CHNChalice Golde Mines Major Breakout of 10 year base. The bigger the base the higher in space. Three district scale exploration properties in the best and most prolific areas in Australia. Tier one assets. Exploring near some of the most profitable mines in the world including the Fosterville Gold Mine owned by Kirkland Lake Gold (NYSE / TSX: KL | ASX: KLA) and 22Moz @ 15g/t Au Bendigo Goldfield.
Palladium

Precious Metals Continue to ShineFirstly, please support our work by clicking like button or following! These really assist us to reach more investors & traders like you!
The fundamentals for precious metals have not yet changed from previous week. Kindly check the previous week's analysis.


Palladium Short OportunityWait for the breakout
H1 CS Breakout confirmation would be better
Good Luck
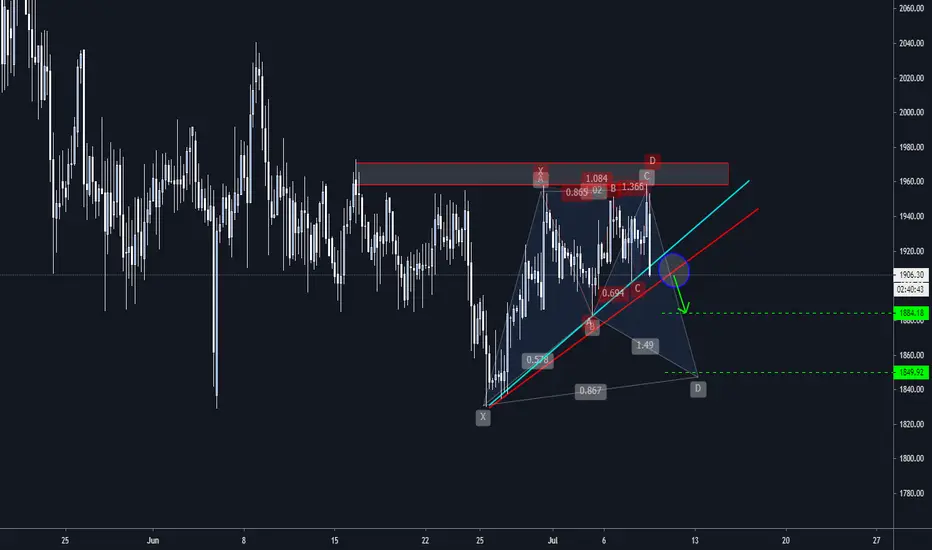
Long PalladiumIn 4H chart it's propably invertet head and shoulders. in daily chart we see break out from descending triangle.

3p / 3.69p resistance 6p big target / strong catalystsJangada is a great top invesment:
BoD aligned with shareholders holding most of the float
6p warrants due to expiry in October 2020
Have 26% of Volare Metals valued at around $5.5m for Jangada Mines
Valore Metals also own Pedra Branca PGE (great asset) & drilling over summer.
Jangada catalysts:
7 holes assay results to come back soon
JORC estimated resource
PEA


"FED-PIG" PLAY - Metal Strangle - Long Palladium, Silver HedgePalladium is one of the most interesting niche long ideas that I've been following for some time. This rare metal has appreciated 3-4x in a very short period of time. That is pretty wild, given that it is a commodity that has always existed on Earth. While there are certainly gov't related supply controls, demand is skyrocketing due to its extremely limited availability and its rare chemical properties used to manufacture vehicles in the aerospace/automobile industries.
In fact, there seems to be some slight correlation between Tesla's share price and palladium's p/oz. Might just be a coincidence though.
In any case, the FED is likely to drop rates in order to keep in line with their efforts to push the market higher. Any sort of dovishness will be bad for everyone, unless you are somehow still holding a short position from 3 months ago. Otherwise, I think these FED minutes will serve as another catalyst and that it actually has not been fully priced in to the equities markets.
However, one way to play this is to strangle commodities to account for an ambiguous reaction to interest rate guidance. All else equal, silver is the obvious pick to short and gold, long. However, I think palladium can benefit more than gold from decreased rates because it is overlooked. Gold may have already priced the best case scenario in already, which is a fair assumption given recent institutional interest.
Thus, one creative play before 2 pm is to long Palladium forward contracts for next month and buy offsetting puts on silver miner ETFs.
Will be a fully fed pig by end of day, that I am sure of.
TVC:PALLADIUM TVC:GOLD TVC:SILVER

Trading plan for Palladium- Move Up - Long Strategy- PA1The market goes up but a major resistance could limit the rise.
And don ‘t forget to take your profits…

Trading plan for PALLADIUM - Short Strategy – PA1The market goes back down but a major resistance could limit the fall.
And don ‘t forget to take your profits…

Trading plan for Palladium - Short Strategy – PA1Zone Sell : 1912.2
Target : 1895
And don't forget to take your profits...

ridethepig | Palladium Market Commentary 2020.06.15Here the consolidation is condemned to break for the common good, as a diversionary sacrifice. Covid cases will act as the catalyst undoubtedly. The question is only and above all when?
For those tracking the breakout momentum is much more on the buyers side, clearly defined jurisdictions are on both sides of the map... As a quick cheatsheet: Strong Support (1635) <=> Soft Support (1750) <=> Soft Resistance (2300) <=> Strong Resistance (2800).

neutral on palladium palladium is ranging, no bull order power no sharp down spike , so no trade yet

Top 2 Biggest Industrial Contraction Ever? Methinks YesJust an idea, haven't shorted it. If there's a fundamental reason you think Palladium should be higher, please let me know.

PALLLADIUM is ready to popPrice is coiling inside the asymmetrical triangle. Historically, this pattern is prone to volatility once price reaches the apex. The next two daily candles will put price outside the pattern. If there is continued risk taking and positive market sentiment across all financial markets, then there is increased probability that Palladium will develop a new bullish trend. However, it worth noting that the S&P 500 has traded higher over the last several days/weeks while Palladium has been stuck in a no trend scenario. Pay attention to risk and potential fake outs.

SBSW & PLG breakout coming Two platinum/palladium miners that are set to catch up with the broader market rally.
SBSW: Above its VWAP from recent peak, VWAP from February peak and VWAP from March low. Also consolidates above 50 EMA which found support at the 200 EMA and is now pushing price higher. I have removed the 5 and 20 EMA in order to see the VWAPs but please add them to your own chart and you will see they are in a very bullish position.
PLG: Still has some work to do consolidating below the 200 EMA and VWAP from recent peak, while above the 50 EMA and VWAP from Feb peak/March low. I have picked the $1.70 level as the final resistance level. I am going to watch SBSW as it is technically closer to a breakout, and if the breakout occurs, PLG has a very high probability to move higher.


Palladium Undervalued To Gold & Volaility ExtremePalladium on the weekly is undervalued compared to gold. Volatility is also at extreme point & declining. Expecting a move to upside.

DXY (COT Analysis)Okay, here is the DXY or the Dollar Index. Part 1...
This post is going to be quite long as it is going to serve as the post that introduces something im gonna try and update weekly. the COT Report. Now, i had no idea what the COT report was until i watched and looked at a very popular, here on TrdingView, trader's charts and saw his very useful indicator! I did my own research and thanks to another popular trader, again here on tradingview, who helped tremendously with providing some very useful resources i was able to learn about the COT.
Now Here is going to be a trial, mainly for my own reference, to track which pairs too look out for. So without further wait:
the USD Bias- Undecided
Commercials - current== (16 438) and the previous == (18 407)
Non-Commercials- Current== 14 799 and the previous== 17 297
Open Interest - current == 28 298 and the previous == 31 477
What does this mean? This means the Dollar is stalling right now. The open interest went down which suggests that both sides closed out positions without opening up new ones. the non commerciasl are still selling and the non-commercials are still buying which is giving us the slight rise in PA. However on the COT Index the Gap is closing between the Commercials and Non-Commercials., nd both sides are nearing the Zero Line. the last time this happened the Dollar fell to 86-87. This might be just a profit taking session to give the DXY a slight rest as the 30 year bond rate on the COT index the Commercial failed to take out their previous buying high set in april, so we could see bond rates go lower while the interest gets a bit higher attracting more investors into the American economy!
The Euro Bias- Moderate Buy!
Commercials- Current== (-106 256) previous ==(-102 594) change == (-3 662)
Non-Com- Current== 75 222 previous== 72 562 change ==2 660
Open interest- current== 556 749 previous== 547 206 change== 9 543
What this tells us is that the Commercials are still selling to the Non-Commercials and this is deduced from the increase of the Open Intrest. The euro makes up ike 56% of the DXY and this currency is a moderate buy! now what i want to see is another increase in long orders so the COT index exceedes the current Buy level. Its no Seceret that Germany is the Back Bone of the Euro providing 20% to the Union Budget followed by France and the UK at 15%. Now Germany's main Export are cars and other electronics and Platinum and Palladium are main metals for those as they provide for conduction in the electronic compntes and for emission parts on cars. Both metals took a hit in price and Commercial and Non-Commercials have relieved both sides during COVID-19 making both metals cheaper. now when the economy opens back up i would not be shocked if the main compaines that make these pieces of equipment and cars to buy a surplus to Hedge their physical position causing a slight dip initially in their profit share only to expand in the long run causing the Euro to grow stronger as Germany offers more to the Union Budget.
To Be Continued...

Break Triangle on palladium.Palladium break triangle. Next stop about 1500-1600 USD, in high level support?


Palladium's missile is ready for deployment to tag all-time highThis is a hot trading opportunity as price could retest the all time high.
+45% from the current level

Switch assets:Dow Index versus Gold, Silver, Platinum, PalladiumThis shows the Quotient of the Dow Index versus Ounces of Precious Metals
Gold, Silver, Platin, Palladium
Ir shows whether metals are cheap or expensive compared to the Dow Index.
Low values mean: buy that metal, since it is cheap compared to
High values mean: sell that metal, since it is expensive compared to stocks
This is the game that the rich and wealthy play - switch between classes.
