Palladium fibonacci-break-outPalladium broke out of its downward channel, gapping, and landing coincidentally, at the 38.2% fibonacci retracement level.
$220 which is the 61.8% retracement level, is the next tested resistance.
A break above it, which good intraday volume, could potentially take the price to all time highs.
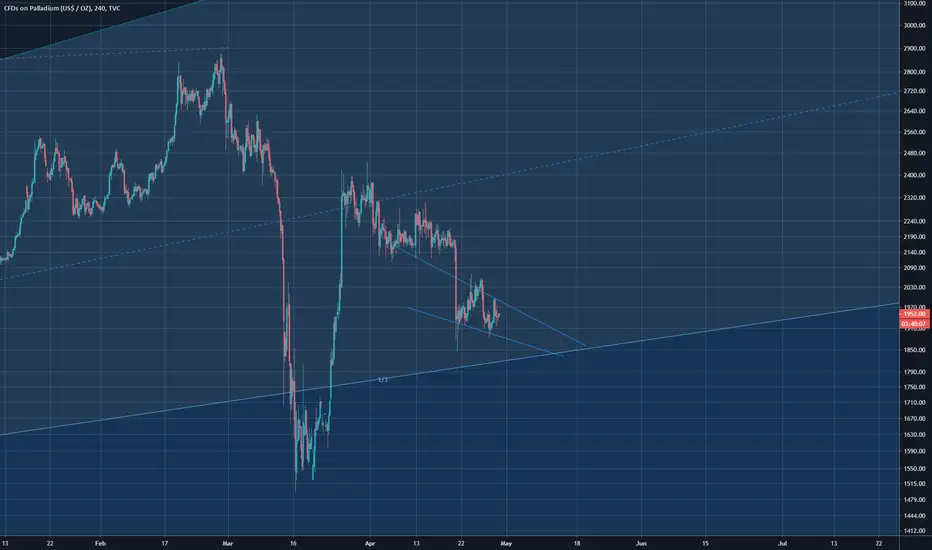
Palladium

Palladium LongWir haben eine sehr starke Unterstützungslinie seit 2018, ausserdem ein großes Dreieck im Tageschart.
Edelmetalle sind in der Corona Krise gefallen, nun hat sich ein Ausbrechen nach oben auch in anderen Edelmetallen (wie zum Beispiel Silber diese Woche) bestätigt.
Der Commitment of Traders Report von gestern sagt aus, dass die großen Firmen, die mit dem Edelmetall arbeiten, alle groß investiert sind. Das ist geschenktes Insiderwissen - bestätigt auch das Ausbrechen nach unten. Bei Edelmetallen kann uns auch nicht die FED oder EZB einen Strich durch die Rechnung machen. Ich sehe hier alles bullish.
Ich setze den Stop Loss bei knapp unter allen Unterstützungen bei 1760 - Happy Trading!

PALLADIUM Falling Wedge IdeaPossible falling wedge on XPDUSD
Included a critical point which is adjacent to Fibonacci spiral
Buy on breakout of wedge at critical point or earlier.

Sell opportunity arises - PalladiumNot a lot specific believe or view behind this post, apart from technicals.
Over the last few weeks we were trading inside a triangle, mostly shaped by a huge collapse early in march and recovering afterwards. We broke out of the triangle last week. Palladium tends to trade down in a weakening economy, which is where we are heading given all the recent news.
We had lower highs, higher lows, then breakout of the triangle, trading down and setting now low, retesting upside now and we have some EMA's hanging, together with the falling trendline .
Wait till Palladium enter's the red zone, and sell with your own prefered SL/TP.
Trading is not about copying but about forming your own opinion.

Sell opportunity arises - PalladiumNot a lot specific believe or view behind this post, apart from technicals.
Over the last few weeks we were trading inside a triangle, mostly shaped by a huge collapse early in march and recovering afterwards. We broke out of the triangle last week. Palladium tends to trade down in a weakening economy, which is where we are heading given all the recent news.
We had lower highs, higher lows, then breakout of the triangle, trading down and setting now low, retesting upside now and we have some EMA's hanging, together with the falling trendline.
Wait till Palladium enter's the red zone, and sell with your own prefered SL/TP.
Trading is not about copying but about forming your own opinion.


Palladium demand destructionThanks for viewing,
Some view platinum and palladium not as investment petals for various reasons, others disagree. I prefer (in rank) 1. gold (bullish), 2, silver (neutral), platinum (bearish). Platinum makes the list because I can purchase it in small increments - while palladium was only available in a minimum of 1oz coins (which had high premiums - as coins in general do). That said, I expect platinum to also show future weakness - potentially going sub $350ish - which is okay as it is a strategic metal that is relevant to defence applications among other things. The reasons I expect weakness in demand for Platinum (currently oversupplied) are the same as for Palladium (under-supply);
Palladium has had a huge run since 2008 - peaking at 16.5x and now at 10.5x over that time period. The major driver was a supply demand mis-match caused from strong demand from auto-catalysts for petrol vehicles. All that has changed dramatically in a short period. Demand has been destroyed for new motor vehicles. Light vehicle sales were down 34.6% in March www.marklines.com and that drop will be over-shadowed by the April drop. Hopefully, these drops are short-term and will bounce back shortly - like vehicle demand in China did - although estimates vary on the time-frame. I suspect we will see near-term demand reduced from 2019 levels for all of 2020.
Medium and long term factors are both negative for those expecting internal combustion light vehicles production levels to bounce bank to new highs. The most major impact will come from an unfolding de-leveraging. For those that blame the health crisis for 100% of the economic woes, please cast your eye a few months back when we had;
- an inverted yield curve,
- downgrades of global and regional GDP growth announced by the IMF, World Bank, BOJ, ECB, Fed etc etc,
- Cautions on the level of sovereign, corporate, and household debt levels,
- Interest rates in the US repo market spiking to over 11%,
- The Fed started QE4, or what they called "definitely not QE4",
- Large investment banks were announcing they were advising their clients to sell US equities because they saw limited upside remaining,
- The US continued on its longest and weakest economic expansion in history.
My general view is that this health crisis with its associated economic contraction brought forward (and exacerbated) what was already just around the corner - a recession.
Any deleveraging event was always going to have to be more significant than 2008-9 simply because debt levels are so much greater now - while incomes have stayed flat. So this will necessarily impact on discretionary consumer demand (and availability of consumer credit) for some time.
Price targets; 1300 should provide some support, stronger support at the $1140, and $1100 levels. 1:1 extension of the recent steep drop at $1060. This level may cause a strong bounce in 6 - 12 months (depending on industrial demand pick-up) - but after that who knows. The trajectory now seems to be away from diesel vehicles, especially since the VW scandal (which hasn't yet fully unfolded to reveal just how wide-spread the massaging of emissions results among the industry as a whole). Medium to long-term, there is every possibility that Palladium's new home will be below $1100.
Protect those funds everyone

PALLADIUM Will most likely form WedgeWedge structure in the making
Looks good for buy along the Gann line
Palladium distribution zone shortTVC:PALLADIUM
#Palladium is making a distribution pattern on daily. Let's see if this trade is possible.

Bubble collapse pattern plays outAs shown in the previous idea below, palladium has enetered a multi year bear market in suit with almost all other securities and equities. Beware longs.
Current bear targets at 1200 and 800$.

PALLADIUM 1D DESCENDING TRIANGLEDescending Triangles are repeatable trading chart patterns.
Descending chart patterns will have a directional bias depending on the previous incoming trend.
Each chart pattern will have defining trendlines of the support/resistance levels creating the pattern.
Whatever time frame you are trading this chart pattern, wait for a candle close outside of the trendline in the direction of the breakout candle. (Our time frame preference is the Daily chart).
Add volume indicator - Volume is the amount of $ that went into a particular candle or in Forex the # of trades that took place.
Add ATR indicator - Volatility is the amount of price movement that occurred. Use the ATR to measure the price movement.
When you see descending Volume bars and descending ATR line (which indicates volatility) this shows
a dis-interest in traders to invest in this pair creating consolidation which creates the chart pattern.
Trade Management after there is a breakout candle close.
1 - Position size (compare volume bar to volume ma line).
a - Breakout candle must be 100% of the average volume for a full position size.
b - If 75% of average volume then ½ position size. (To find 75% of Volume
look at the charts volume settings – divide smaller # into larger # = 75%+)
2 - Enter two trades.
3 - SL for both trades will be 1.5 x ATR.
4 - 1st trade TP will be 1 x ATR.
5 - No TP on 2nd trade – letting profit run and adjusting SL to follow price.
6 - When 1st TP hit – move 2nd trade SL to breakeven.
7 - Adjust the 2nd trade SL to follow price.
*8 – After Breakout candle – if price closes back into chart pattern close trade
*9 - When breakout candle is more than 1 ATR from breakout candle open.
a - Enter 1st trade at candle close with ½ position size.
b - Enter 2nd trade with a pending limit order that is 1 ATR of breakout candle open.
c – Price should pullback to that pending limit order for 2nd trade.
d – If Price returns back into chart pattern close trade before SL is hit.

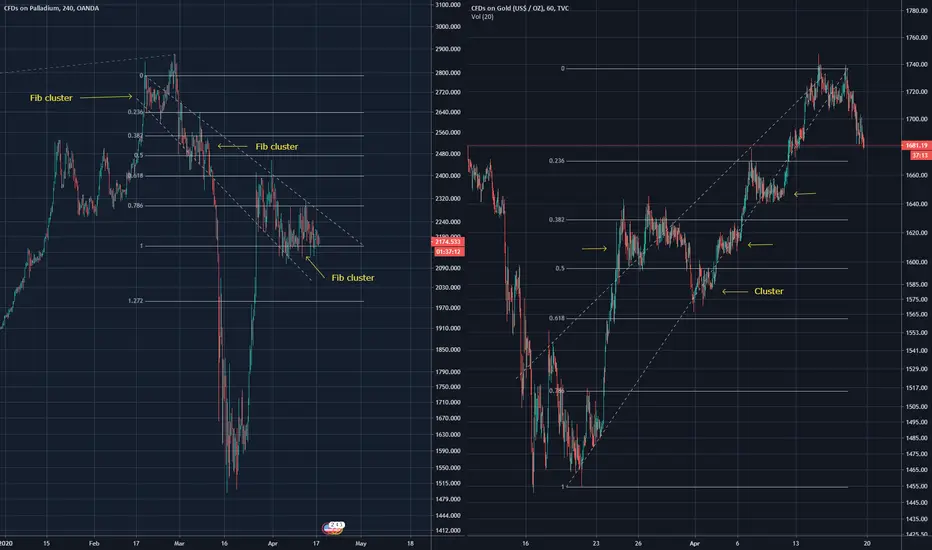
Fib clustersClusters can be seen to be forming within fib ranges
Areas of heavy accumulation
Palladium can be seen to form tighter clusters while gold is more spread due to the fib trend line being older

Gold May Be Finding Support!Gold has experienced a lot of volatility recently and mainly due to the current health pandemic
but price appears to be gaining some order now.
Since May 2019, price has risen 37% but hasn’t formed the neatest of trends.
There have been periods of pullbacks such as the period from the 4th September 2019 to the
6th January 2020.
The sharp decline, which was a result of the pandemic, began on the 9th March 2020 and fell
by 14% from the high at $1,703.
Price quickly found bullish momentum and has since broken and closed above the previous high
and is currently testing it as support.
If the support level holds then the buyers should gain more momentum and push price even higher.
We now have to wait and see how price reacts going forward and get ready to take long positions
at the right time.
See below for more information on our trading techniques.
As always, keep it simple, keep it Sublime.


Palladium (XPDUSD): The end of its parabolic rise.Palladium has been rising non-stop for 4 years (since January 2016), a rise that after 2019 turned parabolic. This parabola has broken down this March as the pull back exceeded the 0.382 Fibonacci level that has been holding in the previous two cyclical pull backs (August 2018 and May 2019).
The 1W chart is on a neutral state (RSI = 53.141, MACD = 105.160, ADX = 39.528) as it has recovered 50% of the March sell-off, however the danger is far from over. Until the 2,900 High breaks, Palladium (XPDUSD) will most likely remain under selling pressure and the Higher Low trend line (red line) which has been supporting the 4 year uptrend may be tested. This test involves the 1W MA200 (orange line) both of which (HL trend line and MA200) can 'meet' on the 0.618 Fibonacci retracement (of the whole 4 year move). This (0.618 Fib) is at 1,390. If that breaks to then the next Support and potential sell target will be on the 0.786 Fib at 980 where Palladium can again start looking like a strong investment.
Keep in mind that we have been strong Palladium supporters for quite some time:
** If you like our free content follow our profile (www.tradingview.com) to get more daily ideas. **
Comments and likes are greatly appreciated.

PALLADIUM PointersTrading in middle of 1 - 1/2 Gann structure, a bullish scythe can be observed however it doesn't look that strong, do divergences continue through price lines? just curious. Clear fractal can be observed with these bearish divergences. Best to go long in this scenario, major precious metals will see large increases with global uncertainty rising.

XPDUSD | More DownsidePlease support this idea with LIKE if you find it useful.
Price was rejected by Resistance Node (50 MA, Ichi Cloud and the Resistance Trendline of the Descending Channel). It's more likely to continue the decline and retest the 200 MA
Thank you for reading this idea! Hope it's been useful to you and some of us will turn it into profitable.
Remember this analysis is not 100% accurate. No single analysis is. To make a decision follow your own thoughts.
The information given is not a Financial Advice.

Palladium Rests Before It Makes Its Next MovePalladium trended really well from May 2019 to February 2020 and was set to reach the $3,000
round number but the current pandemic had other plans for the economy.
We soon saw a sharp decline in price, falling 47% in under 3 weeks, wiping out 6 months of gains
in a fraction of the time.
We are now seeing a different kind of behaviour in this commodity and price has become
unpredictable. This may be due to the fact that price may be entering consolidation following
the strong bullish trend.
During the trend, price used the 50sma as support to help it gain momentum to the upside, but now
the 50sma has turned to resistance which may help to force price down.
If we continue to see weakness then the next area of support is the $2,000 round number followed
by the 200sma.
Because we are seeing uncertainty in Palladium, the safest option is to wait for a break and close
above the current all-time high at $2,875 followed by the $3,000 round number.
While this commodity sets up for its next trend, which may take a while, we are focusing our attention
on forex pairs that are trending and we are also potentially looking for shorting opportunities in the stock market.
We will be looking at some shorting opportunities in our free Facebook group and we also cover this in our
4-Part series from the link below.
See below for more information on our trading techniques.
As always, keep it simple, keep it Sublime.

Platinum Breakout & Palladium Blow-off TopPlatinum at current levels presents tremendous value. The precious metals take turns outperforming and underperforming. In the late 90s palladium went into a bubble while gold, silver, and platinum bottomed out. Then throughout the 00's palladium moved sideways while platinum, silver, and gold all outperformed.
I believe we are nearing a similar setup where US stocks will enter a blow off top and palladium will follow. Following this blow-off top platinum and silver will begin to drastically outperform.
Additionally, the more expensive palladium gets, the more likely industry will find ways to substitute towards platinum. This is especially the case since most of palladium demand comes from China.
Be keeping an eye on these metals, along with gold and silver.

PALLADIUM FUTURES (PA1!) DailyDates in the future with the greatest probability for a rice high or price low
