Palladium Showing WeaknessLast post: June 25th 2019. See chart .
Review: Price was moving towards resistance.
Update: Price has now started to pull back and is approaching the support level.
Conclusion: If price comes down to support and that level holds, then we may see another move to the upside.
Any comments or questions, do not hesitate to leave them below. Give us the thumbs up if you share our sentiments!
Sublime Trading
Palladium

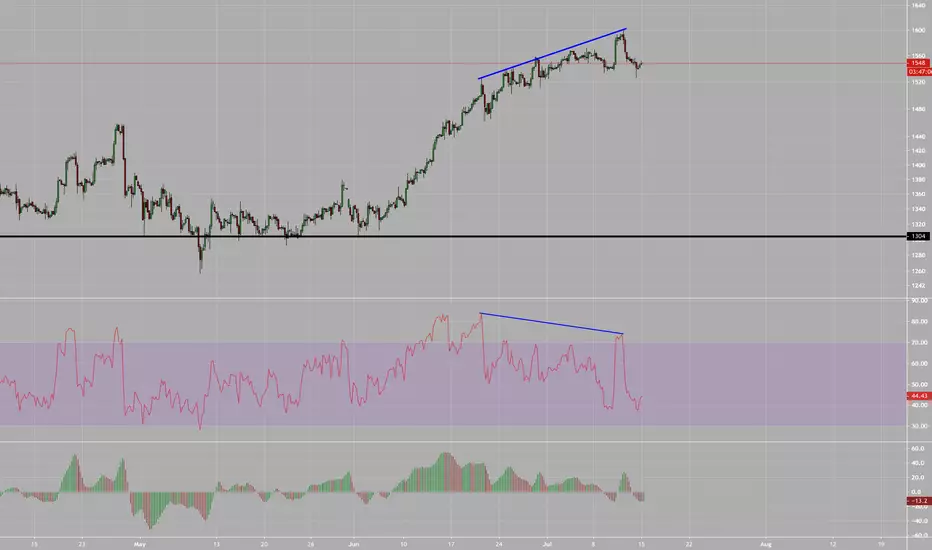
Palladium Ripe for A Fall..Once $1500 on the September futures breaks, I expect a quick and decisive fall to $1300. Additional things I see which makes this a high conviction trade:
1.) Seasonal pattern for XPDUSD is usually weak in mid-July until mid-August/early-September
2.) $1500 was a major breaking point in March as well. Once prices broke that level, the selling came in swiftly.
3.) The NYMEX futures CoT shows the commercials (smart money) is short around the same number of contracts just prior to the March crash as well.
4.) There was a marginal, new swing high in the futures but not in the cash market this month. Prices have since reversed back down off of the $1600 level quite rapidly. This tells me there are ready and willing commercial sellers at those higher levels thus capping prices further (for the time being).
5.) The contract margins for PA on NYMEX are over $12,000 for a 100oz. contract. This is reminiscent of Silver Futures in May 2011 just before the price peaked and promptly crashed..
There seems to be some intermediate support right around the $1300-$1275 level so I would look to cover there...
Thanks to @thunderpips for the 6H/4C chart idea..

XPD USD SELL (PALLADIUM - US DOLLAR)Hi there. Price is moving impulsively as expected. Wait for the price to complete the continuation pattern that its forming and watch strong price action for sell.

Palladium sell signalsPalladium (PA), Weekly chart: Resistance zone + Pin bar/Shooting Star candle pattern + Extended divergence on RSI(14) + On Daily chart: Overbought + Divergence on RSI(14)

Palladium before 43% rise... Gold, bitcoin, palladium. What is common in them? The parabolic motion track. These three instruments were the first to pick up the parabolic track. A highly respected analyst, Captain Walker, pointed out earlier that some exchange rates are beginning to take up this type of movement. These movement paths are characterized by very high target prices, but also panic-like corrections resulting from increased volatility. Therefore, I can most likely say that there will be high rises in these three products, but also big falls.


XPD USD SELL (PALLADIUM - US DOLLAR)Hi there. Price is forming a reversal pattern to change its direction. Wait for the price to test the previous high and watch strong price action for sell.

XPD/USD Palladium 1578.418 VS 1311.485 Trade Setups Hello Traders, XPD/USD Palladium 1578.418 VS 1311.485
Blue: Developing a Bigger Corrective / Consolidation / Continuation Pattern
for further upside movement breaking all time high's 1578.418 / 1311.485 VS 1827.393 / 1705.807.
Yellow: Looking for smaller continuation / corrective pattern for current impulse to break 1578.418.
Red: Red: Consolidation / Correction / Continuation For more downside Breaking 1311.485 VS 1174.297 / 1057.763

GOLD vs PLATINUMHi everyone,
Just to share some thoughts.
The World Platinum Investment Council has reduced its surplus supply forecast by close to 50% for 2019 due to investment demand. Bear in mind that it is still in surplus, so I don't imagine that the bottom is in yet.
Platinum outperforms gold in good times and bad. Since 2003 Platinum significantly out-performed gold (smaller market than gold) but was more heavily impacted by forecast reductions in industrial demand. So I think looking forward it would be safe to say that Platinum is primarily driven by industrial demand while gold is primarily investment driven. So platinum reached its ATH (higher than gold ATH) in 2008 vs gold in 2011. It has out-performed gold on the downside too.
I am starting to be quite interested in Platinum, however, think that there is lower to go because:
- Industrial demand hasn't picked up (but seems to actually be dropping),
- US PMI is way down,
- global economic outlook has been reduced by the IMF (outlooks are generally gloomy - we have seen how Platinum reacts in a recession. If 2020 is a recession like a lot of people are pointing to, it would be very difficult to be bullish on Platinum),
- Global outlook for motor vehicle sales is down - Platinum is commonly used as a catalytic converter of pollutants in car exhausts.
- It hasn't yet met made a 1:1 extension of wave (A) or normal extension of wave C down (I think wave C is about 75% complete with a possible dip to sub-$500),
- Any break below $760 territory would point to further correction of Platinum,
- Supply is likely to be increased if the price picks up either by processing mining stockpiles, expansion of operations, or by increasing recycling as the prices pick up (presently recycling is down - likely waiting for higher prices),
- Given recent US politicians' seemingly anti-environmental stance - the requirement for Catalytic converters could foreseeably be repealed by imperial decree (like the need of coal mines not to dump tailings into waterways) - this could cause a significant reduction in demand for Rhodium, Platinum, and Palladium. This said, presently 90% of cars produced globally have a catalytic converter fitted and the rest of the world would be expected to retain or strengthen limits on exhaust emissions so it would erode export demand for US vehicles,
- There is far more interest in electrical, or alternative fuel vehicles which points to long-term pressure on automotive industrial demand.
So is it all doom and gloom? An important sign to watch for is for any progress in research on Platinum as a catalyst for the refining and conversion of exhaust of gasoline / petrol.
Also, if gold continues its bullish sentiment, this will likely cause upward momentum on Platinum from first investors, and later, from industrial sources (that have to buy).
So is there and easy way to buy physical Platinum or is an ETF easier? I would buy physical platinum via bullionstar.com (I am not an affiliate) in Singapore rather than an ETF. The premiums and spreads can be quite low: its Bullion Savings Program Platinum offering (today) presently 3.64% over spot price and 3.51% over buy-back price and vault storage fees are low and the physical metal can be withdrawn or just purchased in their shop.
My concern with ETFs (the way most people invest in metals) is that ETFs sell far more "shares" in physical metal than they hold and if the price spikes significantly they will likely be closed and neither be able to pay you back or to send you physical metal. When the price spikes it is very difficult to actually get your hands on the physical metal.
Long story short, I will likely be a buyer around $550 and below.
Thanks for viewing

Short Palladium @ 1,532; TP @ 1,400, SL your choiceShort Palladium @ 1,532; TP @ 1,400, SL your choice

Palladium Soaring Higher!Last post: June 17th 2019. See chart .
Review: Price broke through the first resistance level.
Update: Price is now approaching the next resistance level.
Conclusion: If price breaks through resistance then we should see a resumption of the bull trend and plenty of trading opportunities.
Any comments or questions, do not hesitate to leave them below. Give us the thumbs up if you share our sentiments!
Sublime Trading

XPD/USD Possible Downtrend Continuation Palladium started its Downtrend after reaching the top of its Uptrend on June 20 @ 05:00. Now we are at our second lowest High peak of the descending channel with signs of continuous falling.
Downtrend continuation will be confirmed when price falls below 1499.712 then solidifying the move once price falls below 1495.030. Both MACD and RSI show potential upside move, therefore
having our two price levels around busy consolidation areas will give both indicators time to reset for the new move.
-LNP Investments.

Short Palladium @ 1,500; TP @ 1,400, SL your choiceShort Palladium @ 1,500; TP @ 1,400, SL your choice

Palladium Fighting ResistanceLast post: June 12th 2019. See chart .
Review: Price bounced off support and found momentum to the upside.
Update: Price is currently at resistance but struggling to get through so far.
Conclusion: If price makes it through resistance then we should see further moves to the upside.
Any comments or questions, do not hesitate to leave them below. Give us the thumbs up if you share our sentiments!
Sublime Trading

Long Platinum June 17 2019Looks like a stage 1 base is forming in platinum. Looking for a big move to the upside.
Will be trading PPLT

Palladium On The Up AgainLast post: April 30th 2019. See chart .
Review: Price was stuck in the consolidation zone.
Update: Price has found support and showing strength to the upside.
Conclusion: As price is approaching resistance we may see a breakout followed by further bullish moves.
Any comments or questions, do not hesitate to leave them below. Give us the thumbs up if you share our sentiments!
Sublime Trading

IVANHOE MINES LTD - TSX: $IVN Builds Its Right-SideSince recapturing its 200DMA back in February, IVANHOE MINES LTD - TSX:IVN has been trending sideways and in the process, building-out a massive base as we can observe from the Daily chart above.
Additionally, IVN continues to trade above all of its important moving averages 20/50/200 and remains in fine technical shape.
Furthermore, if one were to zoom-out to both the Weekly and Monthly time-frames, you can see that IVN is in the process of building-out a potential inverted H&S pattern that should such pattern materialize and complete, would suggest a measured move to the $5 - $5.25 zone.
Thus, both investors/traders may want to pay close attention to the action in the days/weeks ahead for if IVN can clear the $3.65 hurdle, such development would likely trigger its next meaningful advance into northern territory.

GOLD 4-HOUR TIMEFRAME SHORTGold continues in it's downtrend, as it currently completes a corrective structure towards the 1290 resistance level. I will be looking to short gold around the 1290 area if price action suggests so. Therefore, be on the lookout for bearish engulfing candles or any type of heavy selling close to the dynamic resistance (trendline). A possible target is the 1270 zone. May the bears be will you!!!


XPD USD BUY (PALLADIUM - US DOLLAR)Hi there. Price is forming a continuation pattern to the upside. Wait for the price to hit the bottom of the pattern and watch strong price action for buy.

Holding 50ma - Bullish trend - 1p-1.50p target - Golden cross!Golden cross incoming.
Amazing results & increase of revenue.
Outlook very promising
BoD massive skin in the game
Palladium, Platinum & Gold mining operation.
1p-1.5p 1st target (Expect more in time as company ramps production)
50ma holding very well
Just to become... the largest alluvial platinum globally (from RNS)! Nobody says that lightly!

interested in buying palladium. but lets seepalladium possible bottom? it had a great run and now its correcting. maybe its found a bottom and gonna go up a bit. Who knows.
