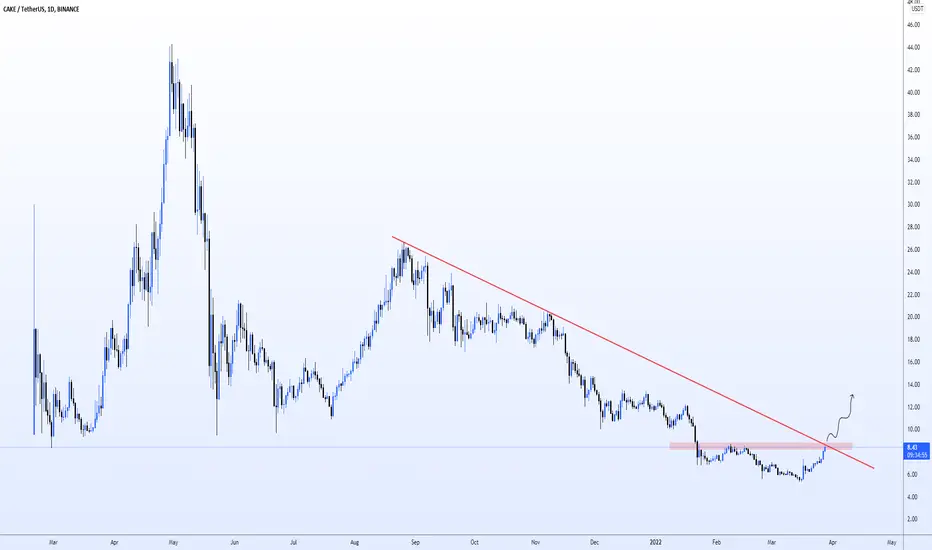
#pancakeswap BULLISH IF BREAKS OUTif the confluence of the resistance around $10 and the downtrend resistance line is broken, we can set a nice order targeting a HUGE 25% circa profit, entering around 10.6 and targeting 13
ONLY BUY IF A 1D CANDLE CLOSES ABOVE THE RESISTANCES
let me know if you enjoyed this analysis and feel free to ask for other pairs to analyze in the comments or feel free to message me if you have any questions or ideas to share!
Pancakeswap

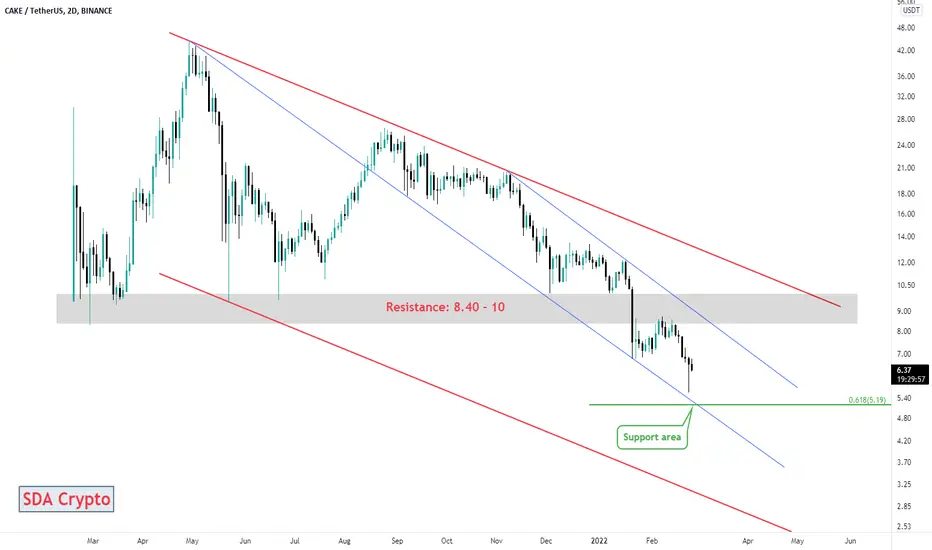
#CAKE / USDT Trend Reversal? #Signal @everyone**CAKE/USDT**
Possible trend reversal underway, following falling wedge breakout with large volume
Ideal entries now would be around $7
After that we would be looking for price to move past $10 - $12
Short term targets > +30%
Mid term targets > +60%
Long term targets > +140%
Use small % capital we'd use 2-3% max

PancakeSwap longPancakeSwap is bouncing off the support area which is also matching with the Fibonacci 0.382 retracement level. Bullish trend is expected to continue up to 11.0.

PancakeSwap CAKE Price Targets and Stop LossCAKE/USDT
Entry Range: $7.30 - 8.80
Price Target 1: $10.90
Price Target 2: $13.50
Price Target 3: $16.80
Stop Loss: $6.60
Previews chart

ADAM & EVE Pattern , Daily, CakeUSDT in Daily Timeframe made an double bottom "ADAM & EVE"pattern and broke the resistance line now is retesting the line.
This makes it Extra-bullish!
Cake has great potentials to jump from here.

CAKEUSDT up trend channel ! As the recent correction end it made higher low Pivot and now put the price in an uptrend channel !
hope see Moon Cake !

Whatever happened to CAKE?Whatever happened to $CAKE? it seems to have lost it's icing. Been in a constant downtrend since August 2021, current daily candle could close as an inverted hammer depending on what happens with BTC, which is quite bearish and get a rejection from the resistance. Reclaiming the area where the order block is at and flipping it would signal a bullish reversal, adding an alert on this one would love to see what happens to it.

CAKE : Long ideaCAKE is testing the downtrend line and the red resistance box in the Daily timeframe. If price fixes above the downtrend line and the red box, We may see a good uptrend in #Cake
CAKEUSDT This route can be happenHello everyone
Cake is one of the most powerful token of defi exchange that can be have a campaign with Dydx in future
According to the chart and to the trend of market , you can see the market is moving to have some correction and need to recovery itself then its ready to continue the route as the trend wanna go .
This route that we can drwan on chart it can be the movement of the price to re-test again the support zone in the bottom (Blue box) and until the price is not broken the second key point level the trend is moving in downward and when this key point is broken the trend can be change to the upward.
If you wanna take position and buy or sell, check the chart with your own analysis and use your own strategy
Previous analysis :
Good Luck
Abtin

cakeusdt long positionPancake Swap has come to this day due to its stupid policies because this amount of tokens with this high profit of steak tanks has really increased the $ 40 currency to $ 6, but it seems that it is reforming its policy and reducing the profit of steak tanks. Has created the futures trading section inside an exchange office and it also burns tokens on a monthly basis. This can be a good entry point.

CAKE is bullish$CAKE is experiencing the retracement after the explosive movement to the upside. Fibonacci 0.5 level stopped the connection and now bullish movement is expected to continue and reach the resistance level at 7,4$

Pancake Swap (CAKEUSDT) TA: 22.2.27It has lost significant support and is declining in the downtrend channel. If the support is broken, $ 5 can fall to the bottom of the channel.
⚠️ This Analysis will be updated ...
👤 Sadegh Ahmadi: @SDQ_Crypto
📅 27.Feb.22
⚠️(DYOR)
❤️ If you apperciate my work , Please like and comment , It Keeps me motivated to do better
CAKEUSDT (PancakeSwap CAKE) 18-2-22 to 17-3-22 Midhigher RangeCake/usdt midhigher timeframe range, This range is fairly new and it formed a new bottom than backed up. as the range is new with a new bottom price can be pushed from these zones to a retrace point but that depends if market see's money coming into alts and peoples shows their to their ol cake. their are no logical profitable intraday setup showed up yet until march 16 2022. but this range did provided 2 swing positions.

PancakeSwap CAKE Price Targets and Stop LossCAKE/USDT
Entry Range: $5.44 - 6.51
Price Target 1: $7.25
Price Target 2: $8.85
Price Target 3: $10.50
Stop Loss: $5.40

CAKE is bullish$CAKE is testing a strong support level. After the bounce off the level, bullish movement to the resistance level at 7$ is likely to happen.

Bulls are consolidating CAKE price in preparation for a rebound The CAKE token has a vital support level of $5.50, and the current price of crypto is struggling to close the daily price candle above $6.7 level, then the neckline of double top formation ($4.6-level) may act as an immediate resistance level.
Stoch RSI is still in the bullish territory; will it affect the current trend?
The CAKE token price has been moving downwards in the RedZone of super trend indicator as well as the price is below the EMA Ribbon in terms of the daily price chart. The bulls need a robust bounce-back move. Moreover, the 200-line is far above the current price.
The Stoch RSI is expanding towards the overbought territory over the daily price chart, where the k-line is at 81 and D-line is at the 66-mark.
Conclusion
The PancakeSwap investors have to keep patients for a good return on investment. The crypto price may generate excellent returns above the $9.0 level.
Support level- $5.6 and $5.0
Resistance level- $7.5 and $8.5

CAKEUSDT: SHORT OPPORTUNITY AHEAD, BEARISH BIAS STILL PREVAILS?Hello CryptoTrading Enthusiast! Help the Channel Growth by smashing the FOLLOW and LIKES Button, then Share your opinion on the Comment Section below :)
CAKEUSDT retested the trendline and created an impulsive rejection. The stochastic pointed down in the neutral area that could be an indication of bearish bias for Pancake Swap ahead.
*Now We put all the explaination on the chart* Enjoy!
*DISCLAIMER:
This isn't a recommendation to buy or sell cryptocurrency, only an Outlook from technical perspective.
*FOLLOW FOR MORE CONTENTS AND UPDATES*

$CAKE is in Phase B of the Wyckoff Distribution Pattern | MoonYou can learn about this method on Google to know it in detail
My chart says it all, right now this is the best entry point for $CAKE
$CAKE is a defi platform whose homepage is pancakeswap.finance
The benefit of owning $CAKE is that you can deposit it in stake to earn profits until $CAKE reaches ATH
Profit up to 5% / 1 month. Pancakeswap is the largest DEX on Binance Smart Chain, you can rest assured about it

CAKE going to break the triangle soonPancakeswap is taking its time to consolidate as well as DOGE ( I did an analysis for that too ) and it's a matter of days that it's going to break the triangle.
The volume is growing so it's enough signal to me that we are going to break up rather than down.
Doge is time to waking up! Target for me in the long terms (6-8 months) will be 0.8 cents.

CAKE likely to go up Looking at the CAKE/USDT trend, it is obviously a downtrend, from my analysis, Cake has reached its ATL and likely to buy/ go long, but if it’s breaks lower than the ATL that should be my SL.

CAKE/USDT BULLISHCAKE has been in a downtrend since ATH, the bottom could be in. The price is also at an all-time low currently.
Boilinger Bands indicator show a breakout at 7,50ish. If price movement could break through 9,00 resistance, we will see an uptrend. Combination of breakout on Boilinger Bands and resistance level could be huge.
Fundamentals: Pancakeswap (CAKE) is the market leader for BSC DEX´s. Pancakeswap holds the most number of coins, pairs, visits and also has the highest market share on BSC (Binance Smart Chain).
Entry: 7 - 10 USD
Target: 40 USD (300 - 400% gain)
Not financial advice.

Cake LongCoin: Cake
Type of signal : Spot
Entry Price : 6$-8$
Price now : 7$
Goals:
Tp1 9$
Tp2 12$
Tp3 17.69$
Tp4 23.5$
Tp5 27.9$
Long-Term
40$-50$
SL Hold

Cake is down the trendCake is down the trend price is looking good for buying but scary at the same time.
