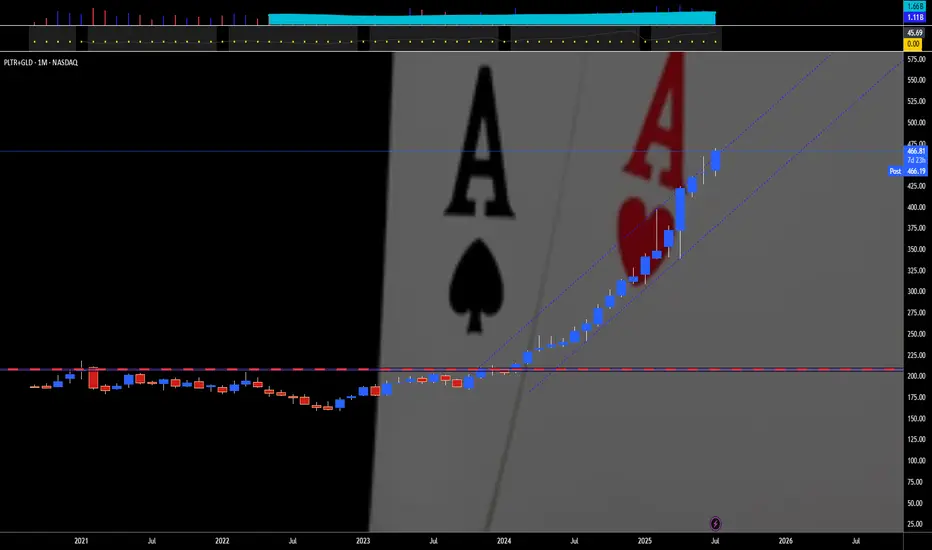
PALANTIR PLUS GOLD — TWO IS A PAIR"Two is a pair" means that the number two represents a set of two identical or closely related items that are used together or considered a unit. For example, a pair of socks, a pair of shoes, or a pair of gloves. It can also refer to two people, animals, or things that are grouped together.
Here's a more detailed breakdown:
Definition:
A pair is a set of two things that are alike, matched, or intended to be used together.
Examples:
"A pair of socks" - two socks designed to be worn on the feet.
"A pair of scissors" - two blades joined together.
"A pair of lovers" - two people romantically involved.
Singular/Plural:
The word "pair" can be singular or plural, depending on how it's used. For example: "This pair is comfortable" (singular) and "These two pairs are comfortable" (plural).
Relationship:
While "pair" often implies a strong connection or matching nature, it can also be used for things that are simply grouped together.
For example, like Palantir NASDAQ:PLTR & Gold AMEX:GLD that match each other, for 18 straight months in a row. 💖
--
Best wishes,
@PandorraResearch Team
Pandorraresearch
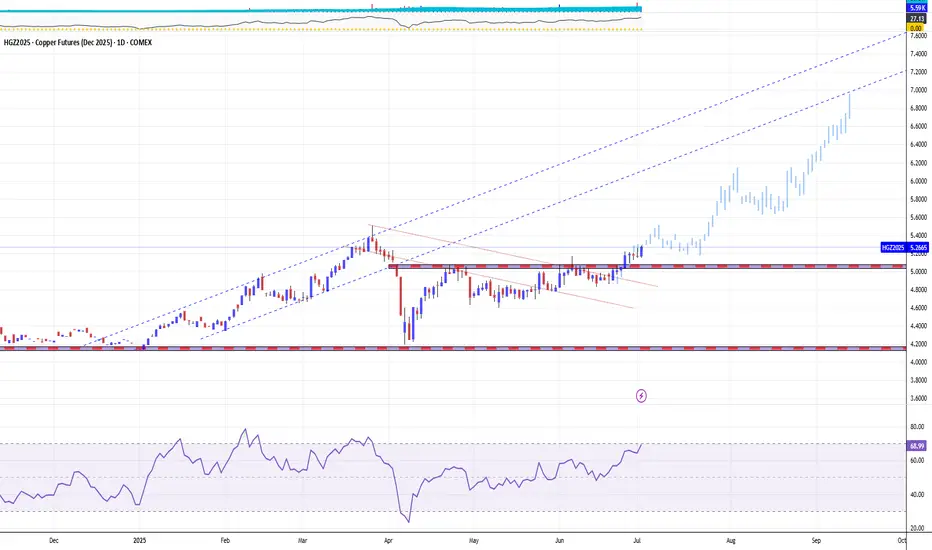
MR. COPPER GOES FUN. WITH DONALD TRUMP — IT IS A BULL RUNCopper prices in 2025 are up about 27 percent year-to-date, driven by a complex interplay of technical and fundamental factors, with geopolitical events such as the Trump administration's tariff policies and the escalation of geopolitical tensions in the Middle East having a significant impact.
Fundamental Outlook:
The main driver of copper prices in 2025 is the ongoing global surge in demand driven by the transition to clean energy. Copper is essential for electric vehicles (EVs), renewable energy infrastructure, and grid upgrades, all of which require extensive use of copper due to its superior electrical conductivity.
For example, EVs use about 2-4 times more copper than traditional vehicles, and renewable installations such as wind turbines contain several tons of copper each. This structural growth in demand underpins the optimistic outlook for copper in the medium to long term.
On the supply side, however, copper production is growing. The International Copper Study Group (ICSG) forecasts a global copper surplus of 289,000 tonnes in 2025, more than double the 2024 surplus. This surplus is driven by rising production, particularly from new or expanded operations in the Democratic Republic of Congo, Mongolia, Russia and elsewhere.
Capacity increases in these regions, coupled with smelter growth, could contribute to a supply glut despite strong demand.
Conversely, geopolitical tensions in the Middle East could disrupt bauxite and alumina supply chains, a region that is a strategically important supplier of raw materials.
Impact of Trump Tariffs:
The Trump administration’s threats and actions to impose tariffs on U.S. copper imports have added volatility and complexity to the market. The tariff announcement triggered a sharp sell-off in early April 2025 as concerns about the impact on US manufactured demand and global trade flows grew. London Metal Exchange (LME) copper prices fell to one-month lows following China’s retaliatory tariffs, before partially recovering after some tariff exemptions and reductions were announced.
The tariffs also distorted physical supply chains. Traders rushed to deliver copper to the US ahead of the tariffs, reducing copper availability in other regions such as China. This arbitrage resulted in a significant widening of the price differential between US CME copper contracts and LME copper prices, with US prices trading at a premium of over 10% to London. This premium reflects the tariff risk embedded in the US copper price and expectations of temporary domestic market tensions.
Technical Outlook:
Technically, copper prices have shown resilience despite the tariff shocks. Copper prices sold off after peaking in late March 2025 before the tariffs were announced, but have since begun to recover.
Long-term trendlines and moving averages remain supportive, with the 100-week and 200-week moving averages trending higher and forming a bullish crossover earlier in the year.
Long-term copper prices are once again attacking the 18-year resistance around $4.50/lb ($10/kg) that capped the upside in 2008 and again in the 2010s and first half of the 2020s, with a 1.5x rally in the next 1 to 3 years.
The technical main chart of the COMEX December 2025 copper futures contract COMEX:HGZ2025
points to the possibility of an upside move, all the way to the $7 mark (around $15/kg) as early as H2 2025.
Conclusion
Going forward, copper prices are expected to remain volatile but supported by long-term structural demand growth, with the impact of tariffs likely to cause episodic disruptions rather than a sustained suppression of increasingly hot prices.
--
Best wishes,
@PandorraResearch Team😎
ELON MUSK SAYS: BYE-BYE 300-ish, FOR TESLA INVESTORSTesla's stock has recently suffered a sharp decline, dropping nearly 7% in a single day to about $294, marking a significant fall from its December peak of over $488—a plunge of roughly 40% since then. This downturn is largely attributed to growing investor concerns over CEO Elon Musk's increasing political distractions, particularly his announcement to launch a new U.S. political party, the "America Party," which has intensified his public conflict with former President Donald Trump.
Investors fear Musk's political ambitions could divert his focus from Tesla's core business at a critical time when the company is already grappling with challenges. Tesla recently reported its second consecutive quarterly decline in vehicle deliveries, with a 14% drop year-over-year, and sales slumping amid intensifying competition and production issues. Musk's political entanglements have also alienated key consumer bases, especially in Europe and China, where Tesla's sales have sharply fallen while competitors like BYD have surged.
The stock's technical outlook is bleak, with Tesla's price well below its 50-day and 200-day moving averages, signaling sustained bearish momentum. The combination of disappointing sales, a distracted CEO, and deteriorating investor confidence has made Tesla the worst-performing major growth stock this year, eroding over $80 billion in market value in recent sessions.
In previous posts we have already considered short position scenarios (see related ideas), and in Q3-Q4 2025 we are looking at new Elon Louboutins.
The technical main chart reflects the dynamics of the July Call option on Tesla shares -
OPRA:TSLA250718C275.0 TSLA 18 Jul 2025 Call 275, losing the $30 level, which indicates a continuing loss of the 300 level in Tesla shares.
--
Best Labuten wishes,
@PandorraResearch Team 😎

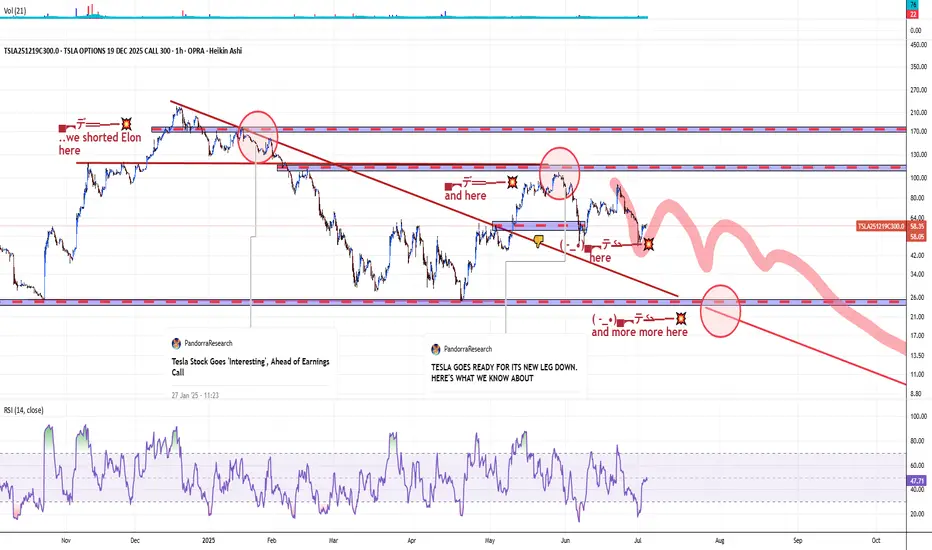
ELON LABUTENES — BEAR SKETCHES. JUNE 2025 AND HALF A YEAR UPSHOTTesla results in June 2025 draw an alarming picture of the future company. In the second quarter, car supplies were sharply reduced by 14% compared to last year, decreasing to 384,122 units from 443,956 earlier - a clear sign of a decrease in demand and increased competition in the electric car market (EM).
Despite the short-term growth of shares after the results, this happened only because the numbers turned out to be less catastrophic than the most pessimistic forecasts, and not because of any real improvement in fundamental indicators.
Fundamentally key problems include:
The obsolescence of the product line: Tesla cars are increasingly considered as outdated, with minimal innovations in the main models. Widely advertised Cybertruck and Robotaxi programs could not provide a significant volume or excitement, and Model S/X updates could not turn back the drop in sales.
Damage to the brand: the polarizing political participation of the Elon Musk pushed a significant part of the client base, which led to the negative perception of the brand and even the loss of incentives in some regions.
Institutional outflow: Large institutional investors reduce their shares, and the share of ownership falls below 50%, which indicates a lack of trust from “smart money”.
The risks of profitability: due to the fall in sales and reduction of prices undermining the margin, the profitability of Tesla is in jeopardy. Analysts warn of compressing margin and potential negative free cash flow if the trends are preserved.
Technical aspects
In the technical plan, Tesla’s shares completed June 2025 on a low note, among looser components of the S&P 500 index, with a demonstrative decrease in the price of the 1st trading session of July without any obvious V-shope recovery in the following two trading sessions.
In previous publications, we have already examined the scenarios of short positions (see related ideas), and in the III - IV quarters of 2025 we look closely at the new Elon lututs.
The technical main schedule reflects the dynamics of the December Call option for Tesla stocks - OPRA:TSLA251219C300.0 TSLA 19 Dec 2025 Call 300
Resume
Looking ahead, Tesla is faced with a difficult situation, with the further risk of a deterioration in the situation, if it cannot revive demand or restore the image of the brand.
--
With the best Labuten wishes,
@PandorraResearch Team 😎
Oil Went Back to 'Pre-conflict' Level on Israel-Iran Ceasefire The Israel-Iran ceasefire has triggered a sharp reversal in global oil markets, sending prices tumbling back to levels seen before the recent conflict. Brent crude ICEEUR:BRN1! fell below $70 per barrel and West Texas Intermediate NYMEX:CL1! dropped to around $65, erasing the risk premium that had built up during nearly two weeks of hostilities. This rapid decline—nearly 17% from the conflict’s peak—reflects investor relief that the threat of major supply disruptions, especially through the vital Strait of Hormuz, has receded for now.
However, the outlook remains uncertain. While the ceasefire has calmed immediate fears, the truce is fragile, with both sides accusing each other of violations within hours of its announcement. Shipping activity through the Strait of Hormuz is still subdued, insurance costs for tankers remain elevated, and some shipowners are steering clear of the region, indicating persistent caution in energy logistics.
If the ceasefire holds, markets may stabilize further, supporting global economic recovery and easing inflationary pressures.
But any renewed escalation or disruption in the Strait of Hormuz could quickly reverse these gains, keeping energy markets on alert for further geopolitical shocks.
The main technical graph for Dec'25 WTI Futures NYMEX:CLZ2025 indicates on 'cup and handle' technical structure with the nearest support around $62 per bll, and further 'double top' price action in upcoming development.
--
Best wishes,
@PandorraResearch Team 😎

PALANTIR vs S&P500 INDEX. WILL AI UPBEAT TYCOON BUFFETT ITSELFFar far ago, somewhere in another Galaxy, in late December, 2024 (yet before The Second Coming of Trump), @TradingView asked at it awesome Giveaway: Happy Holidays & Merry Christmas.
1️⃣ What was your best trade this year?
2️⃣ What is your trading goal for 2025?
Here's what we answered:
1️⃣ What was your best trade this year?
- Surely Palantir NASDAQ:PLTR 💖
I followed Palantir all the year since January, 2024, from $16 per share, watch here .
Current result is 5X, to $80 per share.
Also I added more Palantir after SP500 Index inclusion in September 2024 watch here .
Current result is 2.6X, from $30 to $80 per share.
2️⃣ What is your trading goal for 2025?
- Once again, surely Palantir NASDAQ:PLTR 💖
It's gone 6 months or so... (Duh..? Ahaha.. 6 months already, really? 😸😸😸)
Let see what's happened next at the main graph PLTR/SPX
First of all, let me explain in a few words what does this graph mean.
Rising (Blue) candle means Palantir PLTR monthly return is better vs SPX
Falling (Red) candle means Palantir PLTR monthly return is worse vs SPX
Conclusion
Palantir. The stock that outperformed S&P 500 Index, 12 consecutive months in a row.
Palantir. The stock that printed 12x since inception. 5.5x over the past twelve month and 1.8x in the year 2025 (one the best results so far over the all S&P 500 Index components).
Palantir. The stock that goes to UPBEAT Tycoon Buffett record, that has been achieved in early 1990s (in 1992-93 Berkshire Hathway outperformed S&P 500 Index for straight TWELVE MONTHS).
Palantir. The stock that goes to repeat Microsoft NASDAQ:MSFT record, that has been achieved in 1990s (in 1996-97 Microsoft outperformed S&P 500 Index for straight THIRTEEN MONTHS).
Palantir. Were we right with this stock on contest and won it? Exactly! Even though our prize has been toadly strangled. 🤭
//P.S. We did not find any biggest series then 13-month straight gain. Microsoft 13 straght months superiority over S&P500 index is the biggest ever series in history we found.
//P.P.S. Just one day left (June 30, 2025) to a very potential and a very historical event.
--
Best wishes,
Your Beloved @PandorraResearch Team 😎

GOLD GOES 'PREPARING FOR SCORCHING-HOT JULY'. UPSHOT OF 1H 2025Gold market shines bright in first half of 2025, with nearly 25 percent year-to-date gain, which becomes one of the best start of the year in history ever following 1H 2016 (became a launching pad for Gold to more than Triple in price over next decade) and 1H 1973 (where Gold bugs sharply skyrocketed to infinity and beyond, printed more than 10x over next decade).
The gold spot market in July 2025 is shaped by both fundamental and technical factors supporting a cautiously bullish outlook.
Fundamental perspectives
Were you ready or not, Gold prices have surged significantly in 2025, driven by persistent global uncertainties including geopolitical conflicts (e.g., Middle East tensions), trade disputes, and inflation concerns.
Central banks, notably the Federal Reserve, are expected to cut interest rates later in 2025, reducing the opportunity cost of holding gold, a non-yielding asset. This monetary easing alongside continued inflation worries and safe-haven demand underpins strong gold fundamentals.
Major financial institutions like J.P. Morgan and UBS forecast gold prices averaging around $3,500–$3,675 per ounce in late 2025, with potential to reach $4,000/oz by mid-2026.
Central bank gold purchases and diversification away from US dollar assets also support demand.
Technical perspectives
Technically, gold has experienced volatile but mostly sideways trading in a roughly $300 range around $3,200–$3,500 since mid-2025, reflecting consolidation after a strong rally earlier in the year.
Key support lies near $3,000 and $3,200 levels (125-Day, or 6-Month SMA), with resistance around $3,500 to $3,800. Indicators such as moving averages and RSI suggest an upward trend with possible short-term corrections.
A breakout above $3,500 could trigger further gains toward $3,800, while a drop below $3,200 may lead to testing $3,000 support.
Overall, July is expected to see continued range-bound trading amid new external uncertainties, with bullish momentum intact.
In summary, gold’s fundamentals remain robust due to macroeconomic and geopolitical drivers, while technicals point to consolidation with potential for renewed upward moves in the July 2025 spot market.
--
Best #GODL wishes,
@PandorraResearch Team 😎

Strategy H2 2025. BTC Airless Plot Near $100'000 Choking PointOver the past 6 months, Bitcoin (BTC) has demonstrated a very mixed up/down performance, marked by significant price fluctuations, appreciation and volatility.
From late December 2024 to June 2025, BTC's price rose from approximately $92,000 to around $108,000, representing a gain of about 17.26% over this period.
On the other hand. the price fluctuated between last price in 2024 $92,000 and BTC' low near $74,491 achieved in early April 2025, posting the similar, nearly 20 percent year-to-date decline.
Bitcoin's price trajectory during this time was influenced by several factors. Early in 2025, BTC reached a new all-time high near $109,000 but faced a pullback triggered by profit-taking and macroeconomic uncertainties, dropping nearly 30% to about $74,000 by April. This decline was short-lived, as Bitcoin quickly rebounded by roughly 24%, climbing back to mid-$90,000 levels and eventually surpassing $100,000 again by June, signaling wide range fluctuations are getting for longer.
The technical setup suggests that Bitcoin is poised for further swings around $100'000 choking point.
In summary, Bitcoin’s performance over the last six months has been characterized by sharp correction, mixed technical buy and sell signals, with no any solid fundamental support from institutional investors.
These factors collectively indicate a mixed outlook for BTC, with further price fluctuations in wide range, as a mid-term pricе action perspective for H2 2025 and for longer.
Similar like a year ago 52-week SMA could be considered as major support level.
--
Best wishes,
@PandorraResearch Team 😎

GOLD Regains Above 3'300, since US stocks "Relief Rally" is OverGold prices recently surged above $3,300 per ounce due to a confluence of geopolitical, economic, and monetary factors driving strong safe-haven demand:
Heightened geopolitical tensions, particularly the Israel-Hamas conflict and ongoing US-China trade disputes, have increased uncertainty, prompting investors to seek Gold as a secure store of value amid instability.
The US dollar's weakness, nearing a three-year low, has further boosted gold's appeal for holders of other currencies, making Gold relatively cheaper and more attractive globally.
What is most important also, U.S. stock rally has overed recently its tedious 10-Day winning strike (fortunately which finished not at all the history peaks). That's why investors may be turning back to tried-and-true assets like Gold.
Central banks, notably China’s, have been consistently buying gold to diversify reserves away from the US dollar, supporting prices significantly. China increased its Gold reserves for the 17th consecutive month, signaling sustained institutional demand.
Additionally, gold-backed exchange-traded funds (ETFs) have seen record inflows, reflecting growing investor interest beyond traditional buyers.
Market expectations of Federal Reserve interest rate cuts later in 2025 have also played a key role. Lower interest rates reduce the opportunity cost of holding non-yielding gold, enhancing its investment appeal amid inflation concerns and economic growth uncertainties.
This combination of geopolitical risk, a weaker dollar, central bank purchases, and anticipated monetary easing has propelled gold prices to historic highs, with forecasts suggesting further gains toward $3,500 per ounce.
--
Best #GODL wishes,
@PandorraResearch Team 😎

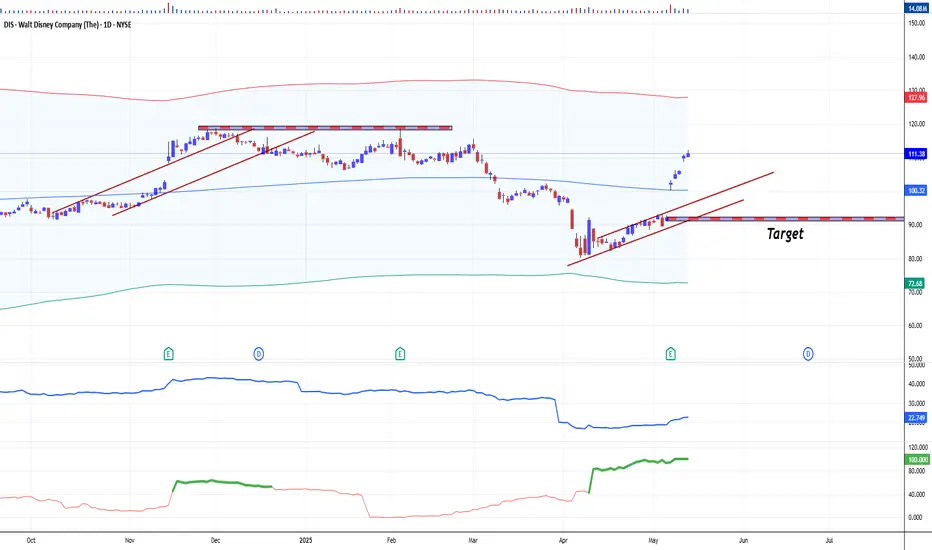
The Walt Disney Stock Future Goes 'Shining Bright as Never'The Walt Disney Company’s stock (DIS) has demonstrated robust performance following its Q2 2025 earnings release a week ago, with both fundamental and technical indicators reflecting positive momentum.
Here’s a detailed analysis:
Fundamental Perspective
Disney’s Q2 2025 results exceeded expectations, driven by strong execution across its entertainment, streaming, and experiences segments. Key financial highlights include:
Revenue Growth. Revenues rose 7% year-over-year (YoY) to $23.6 billion, surpassing estimates of $23.14 billion.
Profitability Surge. Adjusted EPS jumped 20% YoY to $1.45, beating forecasts of $1.20. Net income swung to $3.3 billion from a $20 million loss in Q2 2024.
Streaming Strength. Disney+ added 1.4 million subscribers (reaching 126 million globally), defying expectations of a decline. Combined Disney+ and Hulu streaming operations generated $336 million in profit, a sevenfold increase from $47 million YoY.
Guidance Upgrade. Disney raised its fiscal 2025 adjusted EPS forecast to $5.75 (up 16% YoY), citing confidence in double-digit operating income growth for entertainment and sports, and 6%-8% growth for experiences.
Growth Drivers:
Entertainment. Segment operating income rose $0.5 billion YoY to $1.3 billion, fueled by streaming profitability and box office success (e.g., Moana 2).
Experiences. Theme parks and consumer products saw higher attendance, guest spending, and cruise demand, though international parks faced headwinds in Shanghai and Hong Kong.
Strategic Initiatives. The upcoming Abu Dhabi theme park and ESPN’s direct-to-consumer launch are expected to drive long-term growth.
Technical Perspective
Disney’s stock firstly reacted positive to the earnings beat, reflecting renewed investor confidence:
Price Action. Shares surged 10-12% post-earnings, hitting an intraday high of $103.31. Over the past month, DIS gained 31%, including a 20% rally in five days.
Valuation. The stock trades at 18.4x forward earnings and 2.1x sales, a premium to industry averages but below its historical norms.
Analyst Sentiment. The average price target stands at $126.50 (14% upside), with a Street-high target of $148 (33% upside).
Technical Indicators:
Momentum. The breakout above key resistance levels (e.g., $100) signals bullish sentiment, supported by high trading volume.
Volatility. Beta of 1.01 aligns with market volatility, while short interest remains low at 1.24% of float.
Risks and Considerations
Macroeconomic Uncertainty. Disney acknowledged potential impacts from tariffs and global economic conditions.
Valuation Premium. While growth prospects justify some premium, prolonged macroeconomic stress could pressure multiples.
Investors challenge
Disney’s Q2 2025 results underscore its ability to execute on streaming monetization, theme park innovation, and content-driven growth.
Fundamentally, raised guidance and streaming profitability signal a turnaround, while technically, the stock’s breakout suggests locally bullish momentum.
Following historical patterns we are Bearishly tuned at this time, with targets to fill the gap at $92.17 per share (left after Earnings report), and drilling all the way below.
--
Best wishes,
@PandorraResearch Team
Apparatchik Trump Says 'No.. More Pain' Ahead of Amazon EarningsPresident Trump's new tariffs have had a significant negative impact on Amazon's stock performance, revenue, and earnings, primarily due to increased costs and supply chain disruptions.
Here below is a detailed analysis of these effects.
Impact on Amazon's Stock Performance
Amazon's stock has seen substantial declines following the announcement of Trump's tariff plan. The company's shares dropped nearly 7% within two days of the announcement and are down nearly 21% year-to-date. These tariffs have exacerbated existing challenges for Amazon, which was already struggling in early 2025 with a 13% decline in stock value during the first quarter. The broader market also suffered, with technology stocks experiencing sharp declines as investors reacted to fears of higher costs and inflation.
Revenue Challenges
Amazon's reliance on Chinese suppliers for merchandise has made it particularly vulnerable to the newly imposed tariffs. Over 50% of Amazon's top third-party sellers are based in China, and many of their products are subject to hefty import taxes, including a 34% tariff on Chinese goods. These tariffs increase landed costs for a significant portion of Amazon's inventory, forcing sellers to either absorb the additional expenses or pass them on to consumers through higher prices. This could lead to reduced consumer demand, as higher prices may deter shoppers from purchasing goods on Amazon's platform.
Additionally, the elimination of duty exemptions on minor imports—previously advantageous for discount platforms such as Temu and Shein—has disrupted Amazon's competitive pricing strategy. While this change may level the playing field among e-commerce platforms, it also raises operational costs for Amazon's marketplace vendors who had relied on these exemptions.
Earnings Pressure
The tariffs are projected to slash Amazon's annual operating profits by $5 billion to $10 billion due to increased merchandise costs. Goldman Sachs estimates that these costs could rise by 15% to 20%, further straining profitability. While Amazon has historically maintained lower prices compared to competitors, absorbing these increased expenses without raising prices significantly may be unsustainable in the long term.
Moreover, fears of inflation resurgence due to Trump's trade policies could further dampen consumer purchasing power. This would likely lead to lower sales volumes and additional pressure on profit margins across Amazon's retail operations.
Potential Mitigation Strategies
To counteract these challenges, Amazon may implement several measures:
Vendor Negotiations. The company could negotiate with suppliers to share the burden of increased input costs rather than bearing them entirely.
Price Adjustments. Selective price increases on certain products may help offset rising costs without alienating customers entirely.
Supply Chain Diversification. Shifting sourcing away from heavily tariffed regions like China or focusing more on domestic suppliers could reduce exposure to trade disruptions.
Focus on Services. Amazon’s cloud division, AWS, contributes significantly to its operating income (58% in Q4 2024) and remains largely unaffected by tariffs. Increased emphasis on AWS could help mitigate losses from retail operations.
Technical challenge
The main technical graph indicates on Bearish market in development, with nearly 30% potential to further decline, down to major 10-year average support.
Conclusion
Trump’s tariffs have created substantial headwinds for Amazon by driving up costs and disrupting its supply chain. These challenges have led to stock declines, reduced revenue potential, and significant earnings pressure. While Amazon is exploring mitigation strategies such as vendor negotiations and diversification, the long-term impact will depend on how effectively the company adapts its operations amidst ongoing trade tensions.
--
Best 'Apparatchik' wishes,
PandorraResearch Team 😎

GOLD Bouncing Higher, Following 200-hour SMA Major Support Gold prices have experienced significant volatility over the last days, with conflicting reports on the current trend. According to some sources, gold prices have increased, with spot gold reaching nearly $3,050, new all the history high on Thursday, March 20, 2025.
The $3,000 milestone has sparked increased interest from investors and market analysts, meaning that Gold spot doubled in price over the past 5 years, 3rd time in history ever.
Despite the short-term volatility, gold has shown a strong performance since the beginning of 2025, with an increase of approximately 14-15% year-to-date. Market analysts remain bullish on gold, with some forecasting prices to reach $3,100-$3,200 per ounce in the near term.
The main 1-hour Gold spot OANDA:XAUUSD graph indicates on 200-hours SMA technical support, with further upside opportunity due to mentioned on the chart descending triangle (flat bottom/ descending top) breakthrow.
--
Best #GODL wishes,
@PandorraResearch Team

ARK Innovation. Granny Wood is Back — What She's Brewing..?!Hooray! Granny Wood 👵 is roaring back!
Well, here we are, The @PandorraResearch Team, to discuss what Ma'am Wood is brewing, since the epic things are almost there!
In a nutshell, Cathie Wood is an American investor and founder, chief executive officer (CEO), and chief investment officer (CIO) of Ark Invest, an investment management firm.
Her flagship ARK Innovation exchange-traded fund - AMEX:ARKK ETF has received accolades for its performance in 2017, 2020 and 2023, but is also considered by Morningstar to be the third highest "wealth destroyer" investment fund from 2014–2023, losing US$7.1 billion of shareholder value in ten years.
Overview of the ARK Innovation ETF AMEX:ARKK
The ARK Innovation ETF (ARKK), managed by ARK Investment Management and led by Cathie Wood, focuses on investing in companies that are at the forefront of "disruptive innovation." This term encompasses technologies that have the potential to significantly alter industries and consumer behaviors. The fund primarily targets sectors such as genomics, automation, AI, and energy, aiming for long-term capital appreciation.
Current Performance Metrics
As of January 31, 2025, ARKK is priced at approximately $64.50, reflecting a 1.53% increase on that day.
Over January 2025 ARKK has demonstrated a bold return of about 13.60%, following a volatile period marked by significant fluctuations in value. Notably, that ARKK's performance over January 2025 shows a stark contrast with U.S. stock market benchmarks (just compare - S&P500 Index SP:SPX demonstrates nearly +4% return so far in 2025 while Nasdaq Composite Index NASDAQ:IXIC has added just around 3% in first month of 2025).
ARKK Fundamental Analysis
Investment Strategy. ARKK employs an actively managed approach, focusing on companies that are leaders or enablers of innovation. The fund's strategy combines both top-down and bottom-up research to identify high-potential stocks across various sectors.
Sector Exposure. The ETF is heavily weighted towards technology and healthcare sectors, with significant investments in companies involved in AI and biotechnology. For instance, Tesla is often highlighted as a major holding due to its advancements in autonomous driving technology.
Technical Outlook
The technical outlook for ARKK shows signs of recovery and epic 200-week SMA Bullish breakthrough after a challenging period from late 2021 through much of 2023. The ETF has rebounded from lows around $36.85 in August 2024 to recent highs near $64.50 in January 2025, indicating a potential bullish trend if momentum continues.
Support and Resistance Levels
Support Level. Approximately $60.00 (recent low that corresponds to current 200-week SMA value)
Resistance Level. Approximately $71.50 (3-years high)
These levels will be critical for traders watching for potential supports or reversals.
Market Sentiment
Investor sentiment surrounding ARKK remains mixed due to its historical volatility and speculative nature. While some investors view it as an opportunity to capitalize on innovation-driven growth, others express caution due to its past performance dips and high-risk profile associated with its concentrated holdings.
Conclusion
The ARK Innovation ETF presents a compelling case for investors interested in disruptive technologies and long-term growth potential. However, its inherent volatility and the concentrated nature of its holdings necessitate careful consideration before investing. As the market continues to evolve with advancements in AI and other technologies, ARKK may offer significant upside momentum now, but also comes with considerable potential risk.
