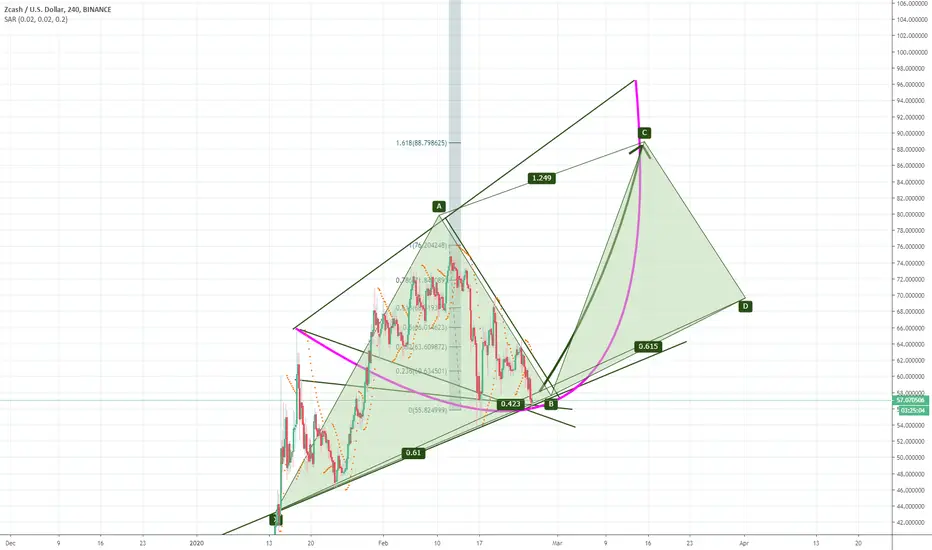
XMRUSDT is testing the ascending scallop 🦐XMRUSDT is testing the ascending scallop.
If the price will break the parabola and break the daily support According to Plancton's strategy, we can set a nice order
–––––
Follow the Shrimp 🦐
Keep in mind.
🟣 Purple structure -> Monthly structure.
🔴 Red structure -> Weekly structure.
🔵 Blue structure -> Daily structure.
🟡 Yellow structure -> 4h structure.
⚫️ Black structure -> >4h structure.
Here is the Plancton0618 technical analysis, please comment below if you have any question.
The ENTRY in the market will be taken only if the condition of the Plancton0618 strategy will trigger.
Parabola

BITCOIN - THE LAST BULL STANDINGDear Traders and Hopeaholics alike,
as the self-proclaimed President and Founder of HOPEAHOLICS ANONYMOUS (or HA for short) I gave you this chart...
Right now AGAIN they are going to be reading this post and shouting HA HA HA HA HA everywhere I go. But as the President and Founder of HOPEAHOLICS ANONYMOUS, don't let me be the one to have the last laugh...again... ALL THE WAY TO THE CRYPTO BANK!!!
If you are in the industry (Crypto one that is) like me, you know that CRYPTO BITCOIN offers HOPE, it offers the possibility of a more secure and transparent future of money, one that is fully traceable, one that allows you to hold and secure it yourself without relying on a third party that may or may not be there in the future. IT ENABLES FULL CONTROL OF YOUR MONEY!
THE TECHNICAL STUFF
PARABOLIC CURVE - STEP-LIKE FORMATION
At the end of the 'X' symbol, as shown on the chart, bitcoin could double in price in the shortest period of time.
In ELLIOTT WAVE THEORY - we are currently in WAVE 2 - heading into WAVE 3.
Wave 3: In Elliott Wave Theory, wave three is usually the largest and most powerful wave in a trend (although some research suggests that in commodity (not crypto) markets, wave five is the largest). The news is now positive and fundamental analysts start to raise earnings estimates. Prices rise quickly, corrections are short-lived and shallow. Anyone looking to “get in on a pullback” will likely miss the boat. As wave three starts, the news is probably still bearish, and most market players remain negative; but by wave three’s midpoint, “the crowd” will often join the new bullish trend. Wave three often extends wave one by a ratio of 1.618:1
Wave 3 rally picks up steam and takes the top of Wave 1. As soon as the Wave 1 high is exceeded, the stops are taken out. Depending on the number of stops, gaps are left open. Gaps are a good indication of a Wave 3 in progress. After taking the stops out, the Wave 3 rally has caught the attention of traders.
**********************************************
NOW ASK YOURSELF THIS - IS THIS SATIRE OR ENTIRELY POSSIBLE?
I'll let you make that decision for yourself, as you are pushing the buttons. BUT let me tell you this... at HOPEAHOLICS ANONYMOUS and in my world... ANYTHING IS POSSIBLE!!!
SHOOT FOR THE MOON - EVEN IF YOU MISS YOU'LL LAND AMONG THE STARS!
**********************************************
If you are unsure of direction or feel you are over trading I have a moto. IF IN DOUBT SIT IT OUT! There is no shame in not being in a trade. Stick to your game plan, wait for a set up to be confirmed, and ONLY take a trade if it all aligns.
So please I welcome your comments and CONSTRUCTIVE FEEDBACK - ALL HATERS WILL BE FLAGGED AND REPORTED!
And remember, there is NO RIGHT OR WRONG in trading - just money management!
REMEMBER IF YOU ARE PRACTICING SAFE... TRADING ALWAYS USE PROTECTION
(minimize your risk, use a stop loss. Especially in Margin Trades) ALWAYS!!!!!!!!!!!!!!!!!!!
<3 Lisa
DISCLAIMER:
The Legal stuff - I'm not a financial adviser. Just a few quick thoughts - remember you sit at your computer, you push the buttons...
PS make sure you give me a like, that way you get updates as I post them.... :) <3


RVN Structural S/R Flip| Pivot Point| .618 Fibonacci| RSI WedgeEvening Traders,
Today’s Analysis – RENBTC – trading above structural level with Fibonacci confluence, RENBTC is likely to rise up validation of this level.
Points to consider,
- Structural S/R Flip (Retest)
- Technical Confluence (Trade location)
- RSI Falling Wedge pattern
- Bull Impulses (PA validation)
RENBTC is re-testing its structural S/R flip; further candle closes will solidify the level. This is a key support with technical confluence; market structure, key Fibonacci level (.618) and a Fibonacci Extension.
This indicates a true trade location and a pivotal point on the chart
The RSI is in a falling wedge pattern, breaking in either direction will dictate the overall trend. Stochastics are over extended, can stay trading here for an extended time, momentum is stored to the upside upon a valid buy cross.
Overall, in my opinion, price action will dictate the overall trend, strong bull impulses will be a sign of a probable parabola. Validating support will be very bullish, RENBTC will likely rise to Fibonacci targets.
What are your thoughts?
Please leave a like and comment,
And remember,
“Dangers of watching every tick are twofold: overtrading and increased chances of prematurely liquidating good positions” – Jack Schwager


ENJ Parabola Channel Ideas!Hidden Bullish Divergence on RSI & MACD for ENJ on Daily Chart of all three pairs (USDT, ETH & BTC).
Also, Look at the Parabole Channel on ENJBTC pair!

$TTD Grabbed some putatoes on this one$SPY $SPX $AAPL $QQQ -- $TTD looks like its going to reverse soon so i opened a starter position -- july puts.

#microsoft bubble is about to burst!!!!lol looking at this chart & when someone say #Bitcoin is a bubble, then what is this?
Bearish diversion one after another & parabolic curve man once this breaks there will be lot of Blood!!
STAY AWAY!

VeChain Parabola Resistance |2.618 Fib Target|Increasing VolumeEvening Traders,
Todays Analysis – VeChain- trading above its macro double top resistance, the next logical target, daily resistance.
Points to consider,
- Structural Resistance Breached (Double Top)
- 2.618 Fibonacci Target (Daily Resistance Confluence)
- Valid Parabola (Strong Bull Impulses)
- Increasing Volume (Volume Climax Node, Temporary Top)
- Oscillators Over Extended (No Divergences)
VeChain has put in a Technical Higher High by taking out its Double Top, confirmation will be on the next candle close.
The next probable target is the 2.618 Fibonacci Extension, which is in confluence with the Daily Resistance.
VeChains trend has multiple bull impulses, a clear sign of being in a parabola. A volume climax node will indicate a Temporary Top being set, likely to happen at Technical Targets.
Oscilators are over extended but with no valid divergence, further development will give us a directional bias.
Overall, in my opinion, VeChain is likely to test at least the 2.618 Fibonacci Extension, a volume climax node will indicate a temporary top.
What are your thoughts?
Please leave a like and comment,
And remember,
“You become fearful the moment you identify with fear. But once you begin seeing it as an impersonal changing phenomenon, you become free.”
― Yvan Byeajee

LINK/BTC - The clear picture.LINKBTC has been in a parabolic trajectory since mid 2018 and hasn’t broken since.
Just leaving it out there for the bears to digest.

Parabolic run comes to an end for #ethereum i am NOOB with this chart patterns so that's why i am not giving a setup however i will look to add shorts around 245
if you have any knowledge then please do let me know in comment if i have charted this right :)
just sharing my thoughts & ideas

$W -- hate to say it but $SPY $SPX $AAPL $QQQ -- Hate to say it but this shitty mc shitburger of a company $W looks like its bull flagging... disgusting.

$DDOG -- H&S $SPY $ZM $AAPL $FB $SPX -- $DDOG picked up july puts on this parabolic bitch stock lol.. clear h&s that will likely end up filling the gap!

$SMG -- bearflag on the hourly$SMG showing a clear bearflag on the hourly chart + bearish TRIX cross as well, might be a good short soon, not right this second, but very soon

$OKTA -- shorting this pre ER parabolic piece of shit$OKTA look at this insane parabola. shorting it pre-ER nuff said

Bitcoin Bubble ComparisonDisclaimer: If you are primarily interested in copying other people’s trades then this is not for you. However, if you are willing to put in the work that it takes to learn how to trade for yourself then you have found the right place! Nevertheless please be advised that you can give 10 people a profitable trading strategy and only 1-2 of them will be able to succeed long term. If you fall into the majority that tries and fails then I assume no responsibility for your losses. What you do with your $ is your business, what I do with my $ is my business.
Sawcruhteez Strategies: How to BUY THE DIP | Advanced Dollar Cost Averaging Methods
Welp the last fractal didn't quite turn out as I had hoped : /
This was primarily a result of my belief that the log growth curve would hold as support leading into the halving. When $7,500 broke down a month ago it left me waiting on the edge of my seat for further development. I hope that everyone has been managing risk and staying safe themselves! For those who haven't I hope that you are learning from the experience and moving forward : )
After the S&P experienced a major selloff the rest of the markets followed. Bitcoin hasn't traditionally been an asset that is coupled with traditional markets, however Bitcoin has never experienced an S&P bear market. When stocks are selling off it creates an extremely risky environment and the riskiest assets generally selloff the hardest during a flight to safety. Furthermore the riskiest assets usually experience the weakest dead cat bounces after the first leg down.
After what we have seen over the past month I have become more bullish on Bitcoin than ever.
I do believe that the S&P is currently in the complacency stage of the bubble cycle and I remain worried about what may happen to Bitcoin if the S&P really melts down. That being said what we have seen over the last month has given me sufficient reason to believe that Bitcoin will repeat history with or without an S&P bull market.
Bitcoin is a unique asset class for at least one reason, and I am starting to believe that there are multiple aspects that make this market unique. First is the halving. There is no other asset that shares this characteristic and I believe this is the most important fundamental trait of Bitcoin. If that outweighs a S&P bear market then I believe it would lead to the biggest bubble that the world has ever experienced. That would be enough to gain mainstream adoption and if there is only one, or two (gold), assets going up while everything else is going down then it would create FOMO of unprecedented proportions.
Before the past month this was a complete fantasy in my mind. I refused to believe that the riskiest asset in the world would benefit from the riskiest possible environment. Now I can see the light.
The second thing that may be unique about Bitcoin is the extreme conviction of the remaining market participants. Bear markets separate those who truly believe in the underlying asset from those who are primarily motivated by getting rich(er). It also separates the true believers who know how to manage risk from those who do not. Capitulation happens when the strong hands become sellers. The move down in March was capitulation.
This results in a liquidity spike that will blow out the large majority of market makers. This is the do or die moment when supply and demand is truly tested. If there are more panic sellers than the market can support then it can drop to $0 in the blink of an eye. Anyone that watched the recent action in oil knows just how true this is. In 12 hours it fell from $10 to negative prices and this is the something that the economy fundamentally requires to function!!! This isn't true about 95%+ of other assets. If oil can go to $0 then anything can.
Anyone who didn't sell on that move down is not likely to sell anytime soon. The person, or persons, who were the biggest buyers below $5,000 likely aren't planning to sell anytime soon either. This creates a major (perceived) imbalance in supply vs demand. I am expecting a very choppy period over the next 2 - 3 months and I do expect price to retest below $6,000. This is where I will be looking to accumulate some heavy bags. I am very interested in buying spot from $4,5000 - $8,000. It's a big range and it will be a risky position to build but I believe that the risk is well worth the potential reward. Over the past few years my target for the next top has been $150,000. At this time I am starting to consider some significantly higher targets. If price proceeds in a similar fashion to the chart above then I will become more and more confident in the adjusted measurements.

ETH 12HR RSI Triple TopETH has had a great run since the $90 low in March 2020. But as we approach $200 it seems to be losing steam a bit and may be due for a correction. I don't like calling tops or fighting trends but there is some compelling evidence to indicate that $195 is a good short opportunity.
The RSI on 12HR has clearly triple topped and price has been consistently dragging against the parabola uptrend for the last couple days with weak bounces off it. It would not be hard to imagine crashing through the parabola for a short-term ~10% TP target at $175.
$195 is also right at the resistance level where we previously crashed through on March 11th 2020.

Bitcoin ( $BTC 12h) parabola strike again !Cryptocurrency is a wild market.
During the recent rally I was monitoring the price, waiting with cash on the side line to "buy the dip" and like always the dip never came.
Instead I now identifie what can be said to be a parabola.
Meaning that buyers becomes more and more impatient and cocky.
I speculate that like all parabola it will end in an extrême price action with excessive buying from retails (Fomo) and selling from insider (Dump).
This is not a fully technical analysis, just an update on price action. Due to the May halving hype everyone should be managing risk now more than ever.
As time goes by, I will keep you updated on the evolution of the asset price, so make sure to follow me on Tradingview
Disclaimer : This is not financial advice as I’m not a financial adviser.
This is just my knowledge on what can be said and done from the chart.
Due to the volatile nature of the market, everything can change on a day to day basis.
Everyone is wise to manage their risk properly when considering any trading decision or activities.

AAPL parabolic advanceShort opportunity once parabola breaks.
Against the current, will need a strong pullback to be confirmed.

XTZ - Short the top call Hey everyone,
This is the time to pay attention
Volatility up = volatility down
XTZUSDT has been following a crazy parabola and I think this is the time to call for an end - at least for now.
Expect a retrace to the 0.5 Fib but my most rational self is actually targetting a retest of previous resistance as support @1.7853 around the 0.236 Fib retracement.
Let's see how this plays out
Take care,
Vlad the Crypto Trader

Tezos XTZ Parabola possible breakdown. XTZ has broken out of a parabola curve, which predicts an 80% retracement of the advance. Personally I'd expect a retracement to the rectangle formation that Tezos originally broke out of. R/R is bad for a short setup, but if I owned any, I would consider liquidating or hedging here. Also might be worth looking at XTZBEAR tokens.

Bitcoin Halving ComparisonDisclaimer: If you are primarily interested in copying other people’s trades then this is not for you. However, if you are willing to put in the work that it takes to learn how to trade for yourself then you have found the right place! Nevertheless please be advised that you can give 10 people a profitable trading strategy and only 1-2 of them will be able to succeed long term. If you fall into the majority that tries and fails then I assume no responsibility for your losses. What you do with your $ is your business, what I do with my $ is my business.
Sawcruhteez Strategies: How to BUY THE DIP | Advanced Dollar Cost Averaging Methods
In my previous post I called for Bitcoin to retest $16,000 before the halving. From there I expected to see a multi month correction back to $11,500 where support would be waiting from a horizontal and trendline. After further analysis I think that is a very good roadmap for the months to come.
In the charts above I compare the current price action with what we saw in the second half of 2016, which was the last time that Bitcoin halved. We are currently three months from the expected halving date and last time around BTC pumped 80% in the 6 weeks before the rewards decreased. It started to correct two weeks before the halving occurred and proceed to fall 40%. If history repeats itself then that would indicate price rallying to $18,000 by the end of April before correcting back down to $10,800 in the following months.
I put together a fractal to illustrate that potential path and used a parabola to connect to the lows instead of a trendline. Regardless of what happens these next few months should be very interesting indeed!
