DOGE to MARSdoge with the 5 step parabolic growth will exceed expectations. possibility of reaching $2. i believe many underestimate the power in doge's popularity among retail investors. tp zones marked using polynomial regressions and fib levels. curves show possible movement paths for this idea.
Parabolic


AUTO/USDT Update: Reversal and 700% Recovery has startedAUTO mimics the movement of Ellipsis (EPS).
We broke out of the downwards parallel channel and got a very nice volume increase.
Currently we look for new support where we had our last resistance.
If this gets validated we can expect more upside momentum.
Basic rules:
- Never buy the top/ATH
- Take profit as long as you can
- Use Stop/loss for leveraged positions
- If you are not experienced, don't leverage in the first place
Enjoy the ride and don't be too greedy.
If you like the content, please like, comment and give this channel a follow.
Always do your own research and keep in mind that my charts and comments cannot be considered financial advice.
Cheers
ps.
Chart explanation:
Main lines:
- Green lines are tested support lines.
- Orange lines are resistance lines or, if we are above, possible support lines which were not tested yet.
- Cyan line is for volume trendline.
Helplines:
- Purple lines are trendlines we take a look at.
- Yellow lines are for visual help only.
Boxes:
- Either entry zone or support zone. Check the description.

HNT Before The Herd GrazesBoth fundamentally and technically, this project is about to jump straight from high school to the majors. If you are not yet familiar with what Helium is all about, I am not going to put myself in a position to spread false information #DYOR. Moral of the story, the chart is #bullish in my opinion, and if people now are making $100+ per day using the miners they cannot seem to make enough of just yet, this is merely the beginning. Did I forget to mention these miners use an incredibly small fraction of the energy traditional miners do, and that HNT has an upcoming halving; but the mining rewards will NOT be cut in half. Grab yourself a Helium miner if you get the chance. Not financial advice.
The 200d price target is incredibly conservative on my part as I see this coin as nothing other than a triple digit coin, I expect a move very similar to #Filecoin when people just did the research. Good luck out there!

Ethereum (ETH) - Parabolic Trend LineThe price of Ethereum (ETH) is increasing at an exponential rate - parabolic. A curved trading range has formed that can be used to determine the possible boom & busts of the asset.
SHORT/TAKE PROFIT: When in close proximity to the RED trend line.
LONG: after a confirmation bounce from green trend line.
STOP LOSSES: When a significant break of the parabolic trend line is made.

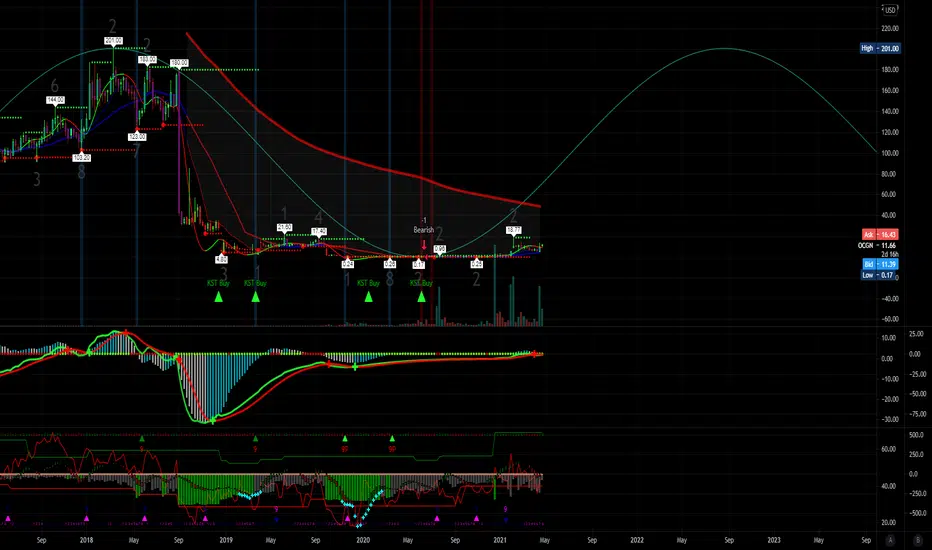
$OCGN PT 180-200 and higherOcugen, Inc., a clinical-stage biopharmaceutical company, focuses on the developing gene therapies to cure blindness diseases. The company's pipeline product includes OCU400, a novel gene therapy product candidate restoring retinal integrity and function across a range of genetically diverse inherited retinal diseases, such as retinitis pigmentosa and leber congenital amaurosis; OCU410, gene therapy candidate for the treatment of dry age-related macular degeneration (AMD); and OCU200, a novel fusion protein that is in preclinical development stage for the treatment of diabetic macular edema, diabetic retinopathy, and wet AMD. Ocugen, Inc. has a strategic partnership with CanSino Biologics Inc. for gene therapy co-development and manufacturing; and Bharat Biotech for the commercialization of COVAXIN in the United States market. The company is headquartered in Malvern, Pennsylvania.
BTC repeating the 2017 cycle?Bar pattern from 2017 Bullrun is looking eerily similar to current price action in appearance.
Which side you on? Bulls or Bears....

XBTUSD - REFUELLING FOR A MIGHTY WAVE 3self explanatory, i am currently believing that price action has formed an irregular flat nested inside another regular flat (for its C wave)
the lead up to coinbase's listing was incredibly bearish & could even fit the formation of a bear market correction
it could be considered possible that the initial correction had completed due to the swing at 0.618 of B, however subsequent progression does not resemble an impulse nor does it extend to any fibonacci levels - also, this cannot be a complex xyz correction as the X impulse does not meet any fibonacci criteria
take as you will, im waiting for the cheap long

$FSR PT 24Fisker Inc. (NYSE: FSR) (Fisker) – passionate creator of the world’s most sustainable electric vehicles and advanced mobility solutions – marked World Earth Day with a call to action regarding federally funded clean vehicle incentives: a new program termed "75 And More For 55 And Less," which encourages adoption of clean energy mobility powered by sophisticated automotive technology developed in America for use around the world.
This press release features multimedia. View the full release here: www.businesswire.com
Fisker Inc. (NYSE: FSR) (Fisker) – passionate creator of the world’s most sustainable electric vehicles and advanced mobility solutions – marked World Earth Day with a call to action regarding federally funded clean vehicle incentives: a new program termed "75 And More For 55 And Less," which encourages adoption of clean energy mobility powered by sophisticated automotive technology developed in America for use around the world.
Related to the current U.S. administration’s policy initiatives, Fisker is calling upon the federal government to implement "75 And More for 55 And Less": a rebate of $7,500 plus $10.00 per mile of certified driving range for BEVs priced at $55,000 and less. All rebates would be applied at the time of sale, instead of waiting for a tax credit.
"We are at an inflection point in our transition to low-carbon mobility," said Fisker Chairman and Chief Executive Officer, Henrik Fisker. "Just as the federal highways program in the 1940s and 1950s enabled a new era for the private car, we now have the opportunity, between the government and business, to accelerate adoption of electric vehicles and ensure the United States is at the forefront of this global shift."
Under the Fisker proposal, an electric vehicle priced at $45,000, powered by a certified 300-mile range battery, would receive a point-of-sale rebate of $7,500 – and an additional $3,000 for the battery range for a total of $10,500, lowering the transaction price to $34,500. This is significantly less than the current average cost of a new car at $40,000.

AAVE Primed and Ready for 2021The price of AAVE/BTC is currently consolidating in the lower band of a 10 month long parabolic trend. .0061 sats is the current support line and .0073 sats, the previous all time high from the last blow off top in September, is the resistance line. If it doesn't break resistance it'll test the local support line. However, I anticipate it will drop below that local resistance line down to .0049 sats, and possibly even .0040 sats. Fortunetly, that drop would be totally normal, and a healthy correction. Overall, the chart looks like people anticipate huge growth. It had two blow offs top within six months. Once a L2 solution successfully solves the gas fee issue, AAVE will go on an insane run. .015 btc in the summertime would be reasonable, if a L2 solution is successful by June. This is not financial advise. I am not an expert.

FIRO/USDT Update: Nearly 50% retracement. >10x to ATHFIRO just plummeted by 50% which is a lot.
We are now back within the original rising channel and found support where we had previous resistance.
If we can bounce off we can make this one green.
FIRO still has a lot to recover since it's 2018 ATH around 125$.
For everyone that missed the previous entry, you are lucky to get another one.
Basic rules:
- Never buy the top/ATH
- Take profit as long as you can
- Use Stop/loss for leveraged positions
- If you are not experienced, don't leverage in the first place
Enjoy the ride and don't be too greedy.
If you like the content, please like, comment and give this channel a follow.
Always do your own research and keep in mind that my charts and comments cannot be considered financial advice.
Cheers
ps.
Chart explanation:
Main lines:
- Green lines are tested support lines.
- Orange lines are resistance lines or, if we are above, possible support lines which were not tested yet.
- Cyan line is for volume trendline.
Helplines:
- Purple lines are trendlines we take a look at.
- Yellow lines are for visual help only.
Boxes:
- Either entry zone or support zone. Check the description.

Holding $Reef is a Unicorn Reef Mainnet in May is the catalyst for this movement
Current all time high is $0.30 and will break that most likely during this run up
Long term being built upon Polkadot and partnering with all major Defi projects this is easily at $30 coin or more

SXP nice pullback and we can go up!We can see how SXP bounced nicely from major trend line in this bullish channel.
We are at Fibo 0.618 right now. It's important level in retracement.
I'm definitely bullish. SXP will parabolic soon!

Bullish 4hr Divergence on IOTAIOTA have their biggest ever upgrade (Chrysalis) starting on the 21st and completing on the 28th. Expecting the bullish trend to continue.

NEO GOES PARABOLIC. Happy to say I told ya so! ;)Finally, NEO has gone parabolic. It has lagged way behind ETH and BTC during this bull run and still has 1x to reach its previous ATH.
My guess is that won't take long now.
See my previous charts below in which I called this a great mid term hold.
My only regret is not buying more sooner!
HAPPY trades,
CD

Verge/BTC >10x potential back to a new ATHVerge is on the rise and we also cover this with the XVG/USDT pair.
On the XVG/BTC we can see that we broke the first resistance and are overextended.
If you are not in this trade yet we suggest to wait for a retest of the old resistance line.
The volume continues to increase which is a bullish sign.
Basic rules:
- Never buy the top/ATH
- Take profit as long as you can
- Use Stop/loss for leveraged positions
- If you are not experienced, don't leverage in the first place
Enjoy the ride and don't be too greedy.
If you like the content, please like, comment and give this channel a follow.
Always do your own research and keep in mind that my charts and comments cannot be considered financial advice.
Cheers
ps.
Chart explanation:
Main lines:
- Green lines are tested support lines.
- Orange lines are resistance lines or, if we are above, possible support lines which were not tested yet.
- Cyan line is for volume trendline.
Helplines:
- Purple lines are trendlines we take a look at.
- Yellow lines are for visual help only.
Boxes:
- Either entry zone or support zone. Check the description.

PPT/BTC >60x Potential until we reach new ATHLooking at the PPT/BTC we see that PPT is currently recovering and starts its comeback.
Considering the ATH we still have room for a >60x move.
Pick your target and stay strong.
Currently we consolidate over an old resistance line looking for new support.
If we get the confirmation this is a great entry point.
Basic rules:
- Never buy the top/ATH
- Take profit as long as you can
- Use Stop/loss for leveraged positions
- If you are not experienced, don't leverage in the first place
Enjoy the ride and don't be too greedy.
If you like the content, please like, comment and give this channel a follow.
Always do your own research and keep in mind that my charts and comments cannot be considered financial advice.
Cheers
ps.
Chart explanation:
Main lines:
- Green lines are tested support lines.
- Orange lines are resistance lines or, if we are above, possible support lines which were not tested yet.
- Cyan line is for volume trendline.
Helplines:
- Purple lines are trendlines we take a look at.
- Yellow lines are for visual help only.
Boxes:
- Either entry zone or support zone. Check the description.

OMG/BTC Parabolic 10x Recovery incomingOMG as one of the promising scaling solutions starts to print a parabolic recovery.
We look at a 10x potential until we print new ATH.
Basic rules:
- Never buy the top/ATH
- Take profit as long as you can
- Use Stop/loss for leveraged positions
- If you are not experienced, don't leverage in the first place
Enjoy the ride and don't be too greedy.
If you like the content, please like, comment and give this channel a follow.
Always do your own research and keep in mind that my charts and comments cannot be considered financial advice.
Cheers
ps.
Chart explanation:
Main lines:
- Green lines are tested support lines.
- Orange lines are resistance lines or, if we are above, possible support lines which were not tested yet.
- Cyan line is for volume trendline.
Helplines:
- Purple lines are trendlines we take a look at.
- Yellow lines are for visual help only.
Boxes:
- Either entry zone or support zone. Check the description.

$DOGE to $1 for the memes, for financial freedom. fib levels, repeated fib channels for fun, parabolic steps.

GRT/BTC ready for a parabolic run.As we can see GRT is almost ready for a big run towards the top here, targets are hard to pinpoint but based on the Fibs we should see a nice rise out of it, used the prev run as an indication. It is tightly consolidating now into and near the top trend line, it has already done 2 fakeouts and the 3rd one should be pushing it upwards.
Trade at your own risk, this is not financial advice, just speculation.

$GBP USDT Falling wedge GBP just alerted a Mac D buy signal as well as a buy signal on the weekly Stock RSI. This is one of few that have not went parabolic yet and it's time is near

XLMUSDXLM... closer to $1.00 than the day before. XLM will more than likely follow ADA or XRP during their run to over $1.00

Peercoin PPC $2.12 next stopGreat 30% retrace. Lots of momentum here. This is one of the original 6 altcoins dating back to early 2013. A fully diluted supply of 26 million coins, of which we believe 8 million are lost.
