Parabolic

the chart speaks for itself bsv is bullish look at the bullish divergence and falling wedge. should out perform bitcoin either 2-5 times. If bitcoin reaches 14k and rises 40 percent we could see 240 percent increase in bsvusd

Yall think this is possible!!!?Leave comments down below if you think bsv will have another pump and dump cycle leaving 400% gains.

ETH just looks bullish to meNot going to lie, but ETH looks kind of bullish right now. Parabola continues to act as support and what is more interesting is that we are getting 21 and 55 EMAs contractions on the daily. Similarly to the end of August, those EMAs are rather going parallel now, which was exactly the case when the price took off last time. Now, the price need to reclaim 21 EMA with several closes above it.

TSLA Tesla Long this week If tesla holds this rising channel 505 target end of this week. falling out of rising channel would nullify

Tesla UpdateSituation
After the last analysis, we pumped from 0.618fib.
Right now we have already pumped by 20%+ and if you don't have a position, you are probably wondering what to do.
Trade
If you longed at around $360-$370, there is no worry. You can probably take some profits and hold until $550+
If you have an early short, you may be in serious trouble. We are only bearish, if the green trendline around $360 will break.
If you want to enter a long, wait for about $400, that's the best entry from a RR perspective.

Gold Short ShortGold has been respecting the downward trendline as shown making lower highs overtime.
Gold is likely to fall to the demand zone of $1919/troy oz before going to all time highs as we get closer to the U.S presidential elections.
Do follow me for more trading ideas (:

BITCOIN - THE LAST BULL STANDINGDear Traders and Hopeaholics alike,
as the self-proclaimed President and Founder of HOPEAHOLICS ANONYMOUS (or HA for short) I gave you this chart...
Right now AGAIN they are going to be reading this post and shouting HA HA HA HA HA everywhere I go. But as the President and Founder of HOPEAHOLICS ANONYMOUS, don't let me be the one to have the last laugh...again... ALL THE WAY TO THE CRYPTO BANK!!!
If you are in the industry (Crypto one that is) like me, you know that CRYPTO BITCOIN offers HOPE, it offers the possibility of a more secure and transparent future of money, one that is fully traceable, one that allows you to hold and secure it yourself without relying on a third party that may or may not be there in the future. IT ENABLES FULL CONTROL OF YOUR MONEY!
THE TECHNICAL STUFF
PARABOLIC CURVE - STEP-LIKE FORMATION
At the end of the 'X' symbol, as shown on the chart, bitcoin could double in price in the shortest period of time.
In ELLIOTT WAVE THEORY - we are currently in WAVE 2 - heading into WAVE 3.
Wave 3: In Elliott Wave Theory, wave three is usually the largest and most powerful wave in a trend (although some research suggests that in commodity (not crypto) markets, wave five is the largest). The news is now positive and fundamental analysts start to raise earnings estimates. Prices rise quickly, corrections are short-lived and shallow. Anyone looking to “get in on a pullback” will likely miss the boat. As wave three starts, the news is probably still bearish, and most market players remain negative; but by wave three’s midpoint, “the crowd” will often join the new bullish trend. Wave three often extends wave one by a ratio of 1.618:1
Wave 3 rally picks up steam and takes the top of Wave 1. As soon as the Wave 1 high is exceeded, the stops are taken out. Depending on the number of stops, gaps are left open. Gaps are a good indication of a Wave 3 in progress. After taking the stops out, the Wave 3 rally has caught the attention of traders.
**********************************************
NOW ASK YOURSELF THIS - IS THIS SATIRE OR ENTIRELY POSSIBLE?
I'll let you make that decision for yourself, as you are pushing the buttons. BUT let me tell you this... at HOPEAHOLICS ANONYMOUS and in my world... ANYTHING IS POSSIBLE!!!
SHOOT FOR THE MOON - EVEN IF YOU MISS YOU'LL LAND AMONG THE STARS!
**********************************************
If you are unsure of direction or feel you are over trading I have a moto. IF IN DOUBT SIT IT OUT! There is no shame in not being in a trade. Stick to your game plan, wait for a set up to be confirmed, and ONLY take a trade if it all aligns.
So please I welcome your comments and CONSTRUCTIVE FEEDBACK - ALL HATERS WILL BE FLAGGED AND REPORTED!
And remember, there is NO RIGHT OR WRONG in trading - just money management!
REMEMBER IF YOU ARE PRACTICING SAFE... TRADING ALWAYS USE PROTECTION
(minimize your risk, use a stop loss. Especially in Margin Trades) ALWAYS!!!!!!!!!!!!!!!!!!!
<3 Lisa
DISCLAIMER:
The Legal stuff - I'm not a financial adviser. Just a few quick thoughts - remember you sit at your computer, you push the buttons...
PS make sure you give me a like, that way you get updates as I post them.... :) <3


NIO - went Parabolic! TSLA wannabe? After hitting hi @ 16.44 on 13 July, NIO went into a 6 wk+ consolidation cummulating into a Cup & Handle Pattern. It finally broke strongly above the C&H neckline yesterday on strong volume.
Congrats if you had caught this break up and while it is expected to have a near term C&H target of around 20.50-21.00. It is likely to be able move a lot higher eventually (however, catching a larger move would require more wiggle room hence we would probably need to give it a wider stop).
Let's see how high it could (eventually) go.
Disclaimer: This is just my own analysis and opinion for discussion and is not a trade advice. Kindly do your own due diligence and trade according to your own risk tolerance. Thank you.

MFTBNB Good curve on weekly charts.
MFTBNB has developed nice curve on weekly charts with good volume and can expect .0004743 is next resistance
high chance of reaching by end of year.

$AMD PT $91-$93 then to $100AMD is that darling that continues taking share from Intel. We have formed a bull pennant with an inside CH. Appears friday we hit the top of the handle. We need to break that $84-81 range to get continuation to my $93 target. This will then get picked up once again by robinhooders and should propel it beyond $100. My top price (which is insane) is $111 which ends up being exactly the 2.618 Fib extension level. Be ready!! the NVDA drive should start waking people up for AMD. Tread lightly though as i am anticipating a pullback in the market either this week or next.

BRACE! TESLA: may correct soon. Pure greed has driven TESLA to ridiculous heights.
Robinhoods are in this market. Most of them from China.
Parabolic expansions tend to fall - sometimes very quickly.
Stay tuned. Stay safe.
Wash your hands and face! 😂
Eat veg! LOL.
Disclaimers : This is not advice or encouragement to trade securities. No predictions and no guarantees supplied or implied. Heavy losses can be expected. Any previous advantageous performance shown in other scenarios, is not indicative of future performance. If you make decisions based on opinion expressed here or on my profile and you lose your money, or miss opportunity, kindly sue yourself.

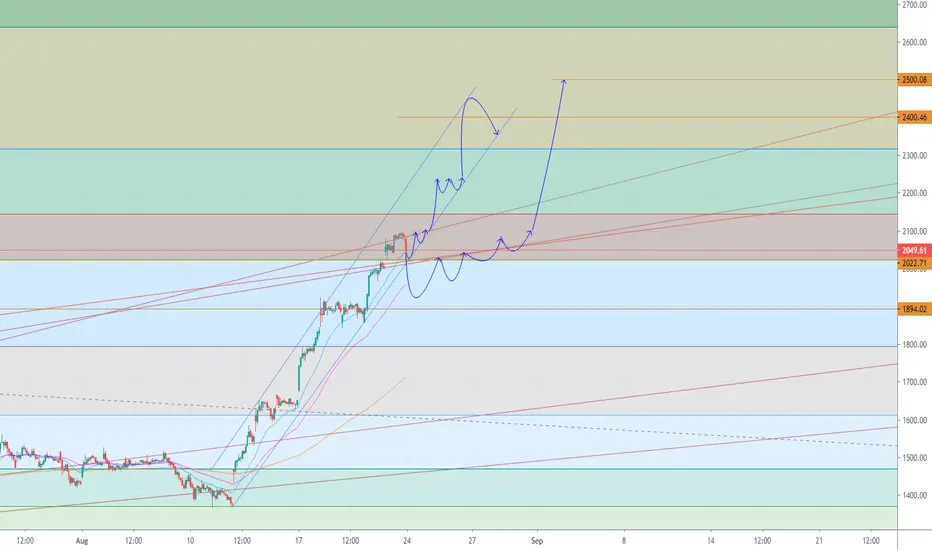
TSLA to $2500 post splitBeing a fundamental person, this drives me insane seeing how high tesla is. I think I have finally accepted that Tesla stock just doesnt care about balance sheets/ profit. Tesla from a technical standpoint however should continue to ride this parabolic trend to roughly $2400 by august 31st split. I anticipate a touch and go on Monday as tesla always seems to do. Tag $2000 and just start another crazy run. If we fail, we should fall back towards $1900 and most likely consolidate upward until the split. If this happens, I am looking at tesla having a split to make it $420 (because thats what elon wants). The week after the split tesla should very quickly run to $500 because of all the young robinhooders that want to pile into the now "cheap" stock.
Then we crash.
How do we think this will end?Parabolic moves like this only end one way and thats a sizable retracement.

Tesla At Top of ChannelThis is a very simple analysis. Just pointing out that Tesla is now at the top of a parabolic channel that goes back to the beginning of this year. It can still go higher from here, but some will be looking to take profit in this area.
The bottom of the channel is around $1,300.

LEND.BTC (Y20.P3.E3.v3).Gems in the making.No.2Hi,
This is a continuation of the previous post, link below.
This is part of my Defi - Gems in the making series, No2. Kava is No.3, SOLBTC will be No.4, etc
As you can see, I have updated my chart and target areas....I suggest keep going long.
Why, I expect 3 or 4 impulse moves before another major pullback or sell off.
(Until BTC hits its target, we will likely not have a sell off)
However its better to keep raising your stop limits, strategically placed as we go up.
With regards to the next target, I have noted the following:
- The height of the formation has confluence with the fib level, extension
- Using the CPR tool on the weekly R1, it too has confluence with both the height method and fib. level.
However the trend line is also a strong resistance
FYI, with regards to LINK, I would suggest looking at the chart and place a stop loss or sell soon.
Apply the stick test on the bottom trend, If its vertical, its unlikely to be sustained.
Please give me a like or tick for this post.
Cheers,
S.Sari
PREVIOUS POST

Ren- Muti-time frame analysisAnother hot oracle/infrastructure token riding on the DeFi hype. Good for short swing trade that lasts for a few days or weeks.

KAVA.BTC (Y20.P3.E3).Gems in the making.No.3Hi All,
This post is part of a series of posts that I have started with parabolic curve signs and hence the title association Gems in the making.No.x
<<< Note: This title is associated with all parabolic curve charts or likely to be as per yesterdays post on LEND.BTC >>>
KAVA is part of the DeFi group and looking at the overall view so far, chart below, we can see how its progressed.
If you refer to my previous post on LEND.BTC, I touch on the points of Base1, Base2, Base3 and Base 4 to then extend beyond the Arc to complete the cycle.
LINK.BTC is doing this right now. Refer to link supplied below for further background information.
OBSERVATIONS:
========================
> It is early stages but what I have quickly learnt about parabolic curves is that they move away from the channel path aggressively, just like Kava btc pairing now;
> Current price action is below another FIB. extension target and is consolidating into what seems a ascending triangle;
> The daily Phoeix supports the thesis that it will go sideways for now with slight downward pressure; Green RSI crossing over Red RSI with gray pressure moving upwards, meaning sideways action.
> The Phoeix outlook on the 3 day and onwards is all upwards pressure;
> Daily chart, the 21, 34 and 50 EMA from the price action, demonstrating aggressive movements;
> Daily Macd looking for a bounce off the signal line;
THOUGHTS:
> If the current price breaks this level in the coming week, it will give us the arc we are looking for, hence confirming the parabolic curve;
> How to trade this > go long and go to the smaller time frames be it 4 or 8 hourly chart and enter as the chart below.
Otherwise wait for the breakout and retest of this resistance line (place order there), but you risk missing out.
Please dont forget give me a like or tick for this post as I would like to see my charts not only succeed but also get more exposure out there.
Regards
S.Sari
Macro overview:
Daily chart:
Note the 21, 34 and 50 EMA from the price action, demonstrating aggressive movements
Entry level, if you haven't bought yet

AARTI DRUGS - Learning the Parabolic CurveMy new learning - Plotting the Parabolic Curve
Calling out experts to correct me if I'm wrong.
If the Parabolic Curve drawn is correct then expect the price to at least touch 1700-1750.
Lets Wait and Watch
*****
Help Me to Help Us.
I believe in keeping the chart simple with minimal drawings & easy to interpret.
So kindly express any disagreement & improvements so that we learn & earn together.
Please support the effort and appreciate it with a Like if you felt it deserves it and Following me would only add on to the motivation.

LEND.BTC (Y20.P3.E3.v2).Gems in the making.No.2Hi All,
*** This is a continuation of the previous post, or an update of the link below, Price Action explained ****
I constructed this chart prior to the drop. But the macro approach doesn't change.
The title is related to a few coins, Gems in the making will focus on specific coins that have demonstrated a clear parabolic curve pattern.
No. 1 goes to LINK.BTC, which I had a previous post with this as part of its title.
++++++++++++++++++++++++++++++++++++++++++++++++++++++++++++++++++++++++++++++++++++++++++++
ANYONE INTERESTED
============================================================================================
The vision:
I would like to build a team, a community maybe, limited no. where we work as a team on TA of the charts and we all benefit.
There is a criteria, you have to have the same values and mindset with the team. It won't be easy to build this team but why not start.
For now, its only a thought but if you interested let me know, and I can start planning the platform or forum to do this.
The vision, we work together going through the list of crypto, do quick summary of each and routinely review them together.
The criteria is that you know the basic fundamentals of TA and demonstrated it (by publishing your works where I can have a look).
I don't just want anyone but people who have the same mindset and are willing to do the work as a team.
For now, its just the planning I would like to do.
============================================================================================
Now for LEND.BTC
As a student in the art of TA more precisely price action and chart structure, I am very interested to building my knowledge base.
What really is frustrating is time and what can be achieve while this anticipated macro bull run is in the making.
Here is a new subject i'm trying to get good at and its identifying Parabolic (curve) structures.
LEND.BTC definitely falls into this as demonstrated on the chart.
So lets begin in point form >
> LEND has demonstrated 4 bases
> It has an increasing support trend-line, which the angle increases after each base completion
> Respecting the 21/34 EMA along the daily
> Climax ending\extention after base 4
> Pullback complete to 0.5 fib level
> ****** The KEY thing here, its done a double top *********
> The double top is what I'm playing my bets on, and that fractal is from BTC 2017 bull run, a similar structure even prior to 2017.
I'll put a sample here.
MY THOUGHTS:
========================================================================
This is going to be a difficult thing to explain and even to implement, but if you do it right, you compound your earnings.
Scenario lay-ed out:
> We noted that when BTC rises quickly, the ALTS and their pairing fall back\behind of that impulse wave.
> We have noted, when BTC hits its resistance in an uptrend, the ALT pairing bounce quickly behind.
> However if BTC makes a break, like this likely position of 12 K, you can be sure that the ALT pairings will drop significantly.
> We have noted that the BTC dominance level is approaching the 0.618 retracement based on my chart reference (refer to previous BTC dominance post, link below)
So you can expect the ALTs will take a hit, but after that, the ALTS will rise especially those DeFi and ETH the most.
With that scenario in mind, where we enter LEND is critical, otherwise you can take a hit because of the above points, so you must be quick to react.
The safer play is have only BTC and ETH until we hit $12500 or $13800 for bitcoin OR $465 to $508 for ETH
Otherwise roll the dice with me and buy up LEND, KAVA, SOL, LINK who have demonstrated parabolic structure.
Some are about to finish and start a pullback while others are looking to start the 2nd leg.
The BTC fractal associated with this chart and potential direction
The next project > SOL.BTC

LINK.BTC (Y20.P3.E4).Rare Gems and the Parbolic Curve PatternHi All,
**** This is a continuation of the previous post > LINK-BTC-Y20-P3-E3-TA-on-the-Macro-structure, link below ****
As I am still a junior in this field, I have however learnt something new this week and today to confirm something that just dawned on me, the Parabolic curve pattern.
FYI. I was trying to work out when to sell. Help me if you can?
I don't know much about it besides what I have seen recently on google to know this is it and that it is likely to have 4 base levels.
The issue I have is working out the target.
Some time back (post below) I got the Editor's Picks of the week (and will feature on the page www.tradingview.com). 1st time.
What I didn't know was actually doing a good job at getting the target right (I think, maybe more).
If I had know about this pattern I would have traded it much more successful.
I'm sharing this for others to benefit and to share the thrill of getting things right.
Now if any of you know where I can find out more details about this topic, I would much appreciate it.
For now, I saw a video that stated that the selling point is equal to the Base of (3) x 2.16
If this is correct, then we have 2.16 x 0.00016004 = 0.00034568
and that the Base of (3) x 0.79 with give the base of (4) = 0.0002865
Cheers,
S.Sari
PREVIOUS POST that came to work out OK.

