Parabolic


Timing the Peak of the Next BTC Bull RunWhen will Bitcoin reach the peak of its next parabolic advance? Probably at roughly the same time it did in the last rally. This seems straight forward enough, but other trend analysis on this platform has variously projected the next bitcoin price peak from sometime just after the third halving in May 2020 all the way to sometime in 2023. While the earlier prediction is highly unlikely, the extended prediction is supported by the fact that, peak to peak, the third bull run of 2017 was much more extended (1491 days) than the previous bull run (884 days). Therefore, we may assume that subsequent parabolic moves will also play out over longer and longer time frames.
However, the simplest answer is probably the best in this case. If we consider that the halvings are roughly 4 years apart, it is notable that the third peak came just over 4 years after the second peak. This suggests that in fact the peaks have become calibrated to the halvings and that the next all time high will come near the 4 year mark (or day 1460) as well. Bitcoin is unique in that the stock to flow ratio can be very precisely projected, unlike any other traditional market, making this rough prediction of the timing possible.
This probably doesn’t help us predict price discovery, however. Government regulation, current events, technological disruption, etc., etc., all affect market sentiment and make it nearly impossible to guess where the price will go. That said, we do know that the halvings will become more and more priced into market valuations in the future as the market gains a greater awareness of the halving algorithm, and this process has probably already started. Futures markets (CME & Bakkt) will also act as tempering forces on BTC volatility (apparently the intention when futures trading was launched on CME in 2017). And as the value of BTC has become more tagged to store-of-value than currency utility, volatility and price discovery have naturally been tamed (relatively), a process that will also continue. This is to say that conservative predictions may fall closer to the mark. On the other hand, the mere fact that flow is dramatically cut after each halving as demand continues to grow gives BTC bulls a lot of hope.
Whatever the peak of the next parabolic rally, it is likely to be tied closely to the halving cycle and stock-to-flow models, and trend lines will probably remain inside the general channel indicated by history. In other words, we're probably not going to the moon, but we are still holding the best performing asset ever seen.
Hopefully these observations aren’t too obvious. They are just meant to help us all keep our eyes on the big picture as we hodl into the future.
DF

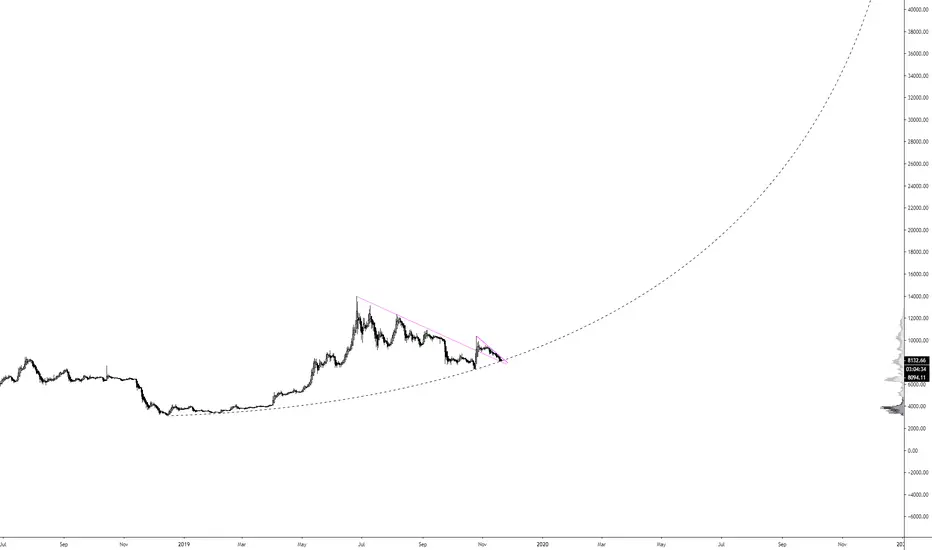
BITCOIN FORECAST LOGARITMICadded that indicador called "BEAM" created by bitcoineconomics on twitter
we are in hodl zone :)

Sell: Parabolic move that usually fades.
After Gap moves like this, there is usually a pull back to half way, followed by a bounce into resistance, then a fade to fill the gap.
Strong sell after bounce.
Do not fall for the trap and buy.

BTC bottomed at 7300?What is Parabolic Move?
In purely mathematical terms, a parabolic move is an exponential rise. Parabolic Curve chart patterns are generated when steep rise in prices are caused by irrational buying and intense speculation. Parabolic curve patterns are rare but they are reliable and are generated in mega bull trends. These patterns trend gradually making higher highs and lower lows in the beginning stages but can be volatile in the exhaustion and reversal stages.
Irrational buying in the public generates a strong rally to push prices vertically, followed by a steep sell off. Examples of this market types are the NASDAQ bullish markets during 1990–2000 (retraced 80%) and Gold prices from 2000–2011 (retraced 62%).
Parabolic curve is a reversal pattern and has a very predictable outcome. Although they are predictable, they are relatively difficult to trade since the market sentiment is bullish and may be relatively tough to point reversals to trade. Most Parabolic curve patterns have a significant correction of 62–79% of its price rise (from the top).
The basic ideas behind Parabolic curve patterns:
— Pattern is easy to spot but difficult to trade with excessive volatility.
— Most Patterns retrace to 62–78% of its rise. 50% retracement is first target.
BTC moved from 3.337 to 13.868 = $10.530 with %315.49 increase
From $13.868 to $7296 = $6.572 with %48 (correction) retracement.
Are we done here or there is another %30 drop coming?

S&P: Possible parabolic move left yetHad some concerns at the end of 2018, but it tweezed and stayed above the curve in black. Following, it executed a perfect bull flag right to 100% of the pole length. I'm suspecting we may have another one of these, and it could be parabolic this time all the way to 340. Expecting some correction in the flag until at least February or so of next year until we hit our confluence of support (FIBs, support curve, flag median, etc.)
I know I have an ugly inverse head and shoulders pattern on RSI. I suspect with the current RSI bullishness and pattern that we could see it go massively over bout in the 90+ range if the movement plays out.
Hopefully none of our politicans will screw it up, or at least wait until we all make a little $$$ :). Approach with caution!


BTC Parabolic Rise|Correction?Volume Climax and Key Resistance Hello Traders !
Quick Update on Bitcoin!
What a move for BTC from its critical support zone (noted on previous chart)! Price is now trading around major resistance; will a correction be more probable from here or a continuation of the parabolic trend?
Points to consider
- Trend still parabolic
- Testing major structural resistance
- Local resistance at .236 Fibonacci level
- Stochastics topping out
- RSI in overbought territory
- EMA’s yet to meet price
- Volume climax
BTC has had an insane parabolic rise with extreme bull volume taking out key resistance levels, negating the overall market structure…
Price is now testing structural resistance, now potential support if bulls are able to hold this level successfully; this will more likely then confirm a continuation. Local resistance is in confluence with the .236 Fibonacci level, sellers are looking very strong above that area due to the long wicks.
The Stochastics is currently topping out, no real clear direction as it can stay in upper region for an extended period of time. RSI is quite overbought; a correction will help cool it off.
EMA’s are yet to meet price, it must hold price as support to confirm a continuation of the trend, however it does have a long distance to meet price. We also have an extreme volume climax bar, which signals that, a temporary top maybe in for bitcoin…
Overall, IMO, a correction may be more probable, but it’s too early to tell, we need price to mature a little more. Consolidation in the orange box will allow the indicators to cool off and confirm support of a key level. However if this level breaks, then we are more to test the .6181 Fibonacci level.
What are your thoughts?
Please leave a like a comment,
And remember,
It does not matter how slowly you go as long as you do not stop.”Confucius

20191015 XRPEUR 4 Stage of Parabolic Move at 4 hours completedHi there,
Price just reached 4 stage of a parabolic movement at 4hs Chart. Besides, it was stopped of a Chuvashov Fork Line comming from past and from 1D Chart.
Every Colored line is an indicator for parabolic movement. When one of the lines are broken, the one before serves as support line.
Probably would try to go back to supply zone before breakout and retest to continue uptrend.
Cheers.
Charter X

Ethereum parabolic fractal patternHello friends, welcome to my chart.
Looking at the chart, ETH is testing multiple times the red line resistance. and the parabolic move up is expected.

Bitcoin Parabolic Since 2013, but this months close could??As you can see on the chart Bitcoin has been in a monthly parabolic curve since 2013. This months candle is testing the trend and the close will tell are we going up or finally break the six year curve. Let me know your thoughts!

BTC Price Prediction - UpdateBTC giant symmetrical triangle correlates with parabolic trend we have held since genesis.
Many times we breakout down from descending triangle only to continue parabolic.
Don't lose hope.

ICXBTC BullishICXBTC is breaking Ascending triangle. All important value like Take profits, Stop loss, Resistance you can see in chart! Potential profit 10% - 15% !

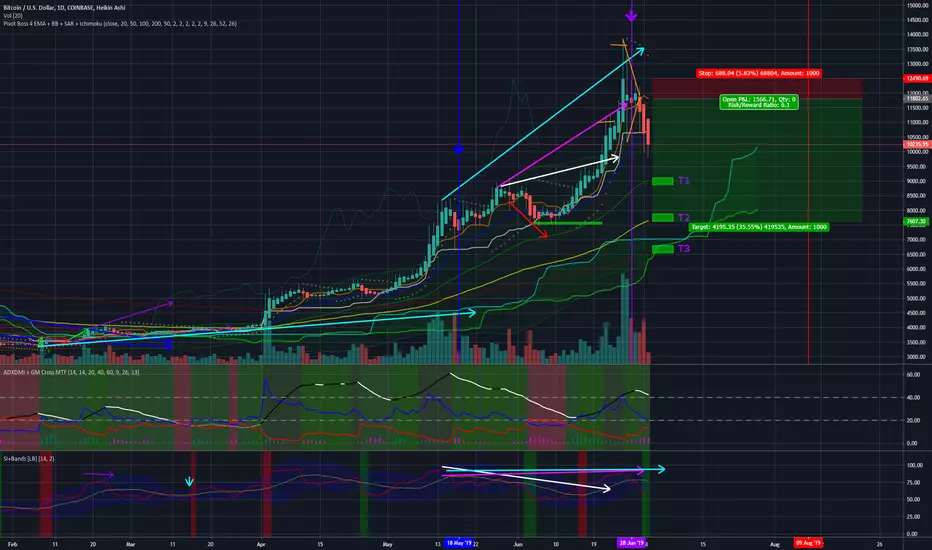
Bitcoin Short to 50, 100, and 200 EMAJust as the title says I am looking to enter short on Bitcoin until the Daily 50, 100, and 200 EMA's: that gives us 6550, 7659, and 9014 as our targets respectively.
Generally on retracements of this size Bitcoin has reached or breached the 100 EMA but often fails to reach the 200.
The Daily Ichimoku Cloud Tenkan and Kijou give us support around the $7,000 mark.
I will be looking to enter on spot and margin longs between the 200 ($6,550) and 100 ($7,659). I have been shorting since the 11-12k area.
At the time of publication Bitcoin has just breached the 20 EMA of $10,375, which has generally held up the price on every touch since we started the bull run at 4k.
On June 26th, 2019 Bitcoin reached a high of $13,868.44 on CoinBase and Daily RSI reached a level of 91.56 signalling that we were approaching far overbought levels. I began shorting above $11,000 and selling spot above $10,000.
ADX has also failed to reach old highs, falling from a peak above 60 on our run up to $8,500 to between 40-45 on this spike up to $14,000. We can conclude from this that the trend may be weakening as DMI and ADX fail to reach old peaks on each continued new local high.
We have also got a convincingly large Daily Bear Divergence formed by the 3 arrows on RSI on the chart; as RSI failed to make higher highs on the run from $8,500 to $14,000 yet price continued to make new highs.
Bear Divergence:
Price: Higher High
Oscillator: Lower High
BCHUSD 300% Parabolic Move Some thoughts and highlighted trendlines regarding Bitcoin Cash's quiet sideways movement, perhaps we'll see some movement from alts into 2020 now that attention is on Bitcoin. We have a head and shoulders possibility here to send us down, but I think that is already invalidated. H&S usually don't hold much weight in crypto.
Keep an eye on it!

WOOWWWWW PHBBTC 45% OF PROFIT We love coins that make parabolic movements. Who buy near 48 should be happy now with more than 45% of profits.
We respect them !!

FMX, Fomento Economico Mexicano SAB - Parabola SupportNYSE:FMX
Very particular this pattern in which the price has been bouncing perfectly for 6 and a half years on the parabolic support and is in the theoretical final phase before any breakout of the resistance that lasts a long time.
We set the alerts and wait.
Stay Tuned!
finance.yahoo.com

ETC in disbelief if the blue oval is tested and broken out of these are my targets.
target 1) 8.20
target 2) 9.75
target 3) 10.85

Possible cup and handle formation GOLDGold looks to be forming a beautiful cup and handle. The 1915 level will be a critical point for GOLD breaking above this level could lead to a parabolic curve in gold similar to that of BTC.
My outlook remains long term bullish for gold just remain with low leverage buys as we could see some pullbacks from current levels.

Calling New ATH ~15k€ around 15th-Sept; 25k-30k shortly later.My previous chart quite impressively respected my forecast.
RSI keeps good looking after last nice green candle few minutes ago, as well as MACD-MFI combination.
Next parabolic rally to new ATH at

Bigger picture of where BTC is goingSome people keep asking me where we go, but the thing is as I previously explained, it is all about probability, no one can be sure on any of the time terms (If people really knew to predict every BTC move they would be very rich and famous in doing so), but my probabilities atm are:
Short term? no one can be sure...
we are in a symmetrical triangle as I showed previously... any break below it or above it will determine the short-mid term mood..
mid term? historical phases (last parabolic run, and the first time we hit 1k+ and had a big correction before the explosion) show that we have still a big correction, also the rise of the current parabolic was due to tether manipulation and exciting bots, also i didn't see real volume buying power, sentimental's aren't really that strong, and in fundamentals the technology is way behind so I don't see any institutions nor adaptation in at-least next 2 years... also if we explode with another parabolic move upwards then the crush is going to be much worst then I expect now, so mid term if we wont create ath, then we will see a 1-5.5-8.2k again (1-3 if tether dies, and 5.5 because we need to reset the current parabolic like we did with the previous, or at-least correct it to 0.7 fib' which is +/- 8.2k)... also excitement, and other values of moon boys give me the same vibes as it was when we got to 18k last time, and when we got to 1k for the first time way before that (both had long term corrections which no one believed could happen)...
long term? I can see Bitcoin between 1-10m$ if the technology matures and succeeds, this is the stable zone for Bitcoin where 1sat = 1cent, when BTC replaces all fiat in the world (Or stays above all of them), when only multi billionaires can hold 1 whole BTC, when all BTC cap can hold all gold in the world and so on...
Hopefully this answers your question..
Things can always change, by this is basically the vision which I hope to see..
