USDJPY Analysis : Key Reversal Zone After Parabolic Rally🧠 Market Psychology & Structure
The USDJPY 4-hour chart reveals a classic parabolic curve pattern signifying an acceleration phase in bullish momentum. This phase typically occurs during the final stages of a bullish move, where price action becomes increasingly steep due to aggressive buyer participation.
The rounded curve drawn on the chart reflects momentum compression—where pullbacks become shallower, and higher highs are formed rapidly. However, this pattern often ends in a blow-off top or a sharp correction, especially when approaching key supply zones.
🧩 Key Technical Highlights
Major Break Zone: The previous resistance around 148.80–149.00 (now flipped to support) was clearly broken with strong bullish candles, confirming trend continuation.
Break Out Demand : Price retested the breakout zone (around 149.80–150.00) before launching higher, validating this level as a new demand zone.
Current Price Action: The pair is currently hovering around 150.50 after a powerful rally, showing early signs of exhaustion with smaller bullish candles and slight upper wicks.
🔍 Target Area – Next Reversal Zone (151.80–152.30)
The green highlighted zone marks a strong supply area / reversal zone, identified from:
Previous price rejections in historical data.
Overbought conditions due to vertical rally.
Completion of the parabolic structure (climax zone).
We can expect price to reach this zone in the coming sessions, where it may:
Face strong selling pressure.
Trigger short positions from institutional sellers.
Lead to distribution or reversal back toward the demand area near 150.00.
🔄 Forecast & Trade Plan
Scenario 1 (High Probability): Price taps into 151.80–152.30, forms bearish engulfing or rejection wick, then pulls back to 150.00 or lower.
Scenario 2 (Invalidation): Strong breakout above 152.30 with momentum—bullish continuation towards 153.00+ possible.
🧠 Trader’s Mindset (MMC Insight)
This chart suggests a matured bullish trend nearing exhaustion. As smart traders, we anticipate rather than react. Wait for the price to reach the supply zone, then observe for confirmation (bearish structure, divergence, candlestick pattern) before shorting.
Avoid chasing longs at these highs—risk-to-reward is no longer favorable. Patience will offer a much cleaner entry if the reversal unfolds as expected.
Parabolicmove

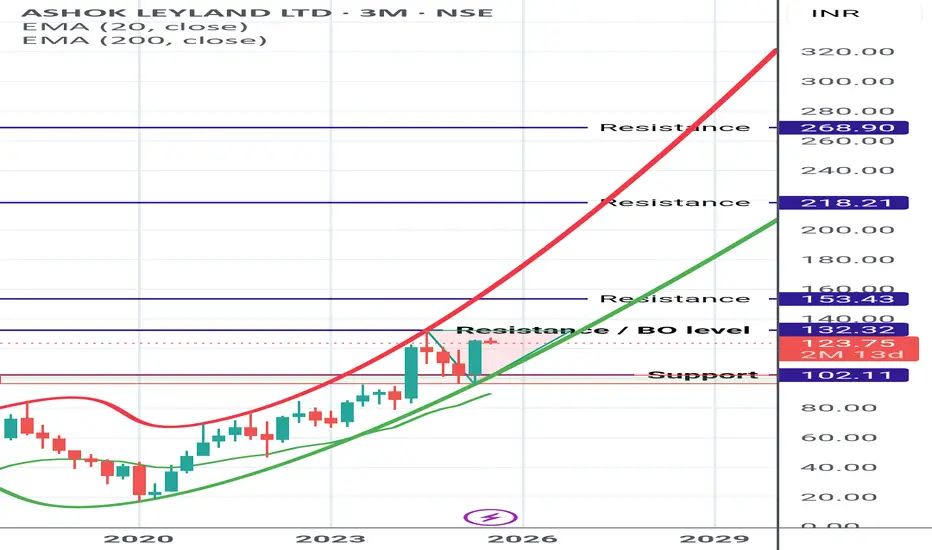
Ashok Ley land updated view Ashok ley land chart updated after price adjustment of bonus.
Currently trading in Parabolic uptrend pattern and inside Triangular zone.
On closing above the triangular marked zone (Breakout level) rest of the marked Resistance can be expected
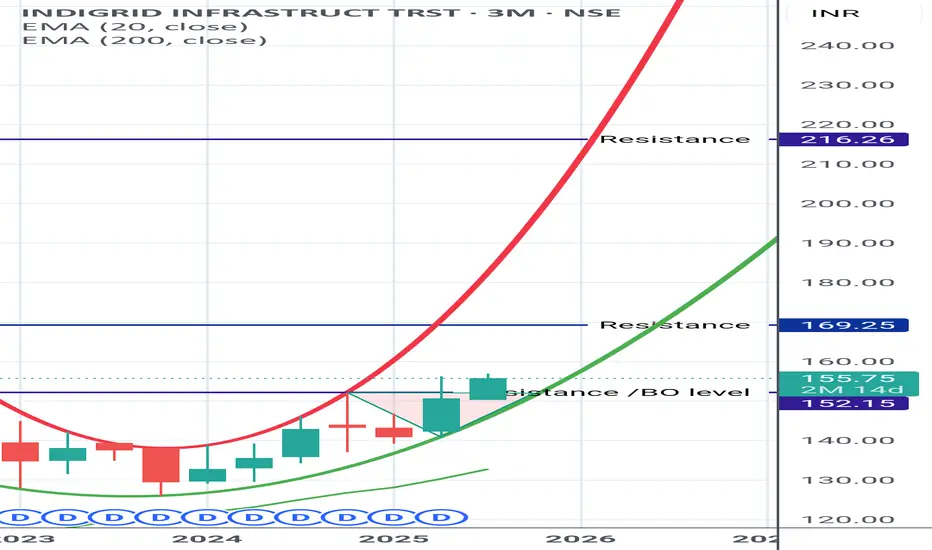
INDIGRID (REIT) INDIGRID - (REIT)
Dividend and Growth (Almost like investing in a BOND)
*At Present they are giving Rs. 4/- as dividend every quarter.*(here it is called as Distribution)
Slow and steady moving stock.
Can have a Small portion.
Technical view is *BULLISH*
Shared it for Reference purpose based on chart pattern and My STUDY.
Do Your analysis from your side before taking the ENTRY.
EWT Will Melt Faces: Why This Time Is DifferentThe crypto market is maturing. The era of pure speculation is giving way to real-world value. In this new paradigm, where major institutions are now involved, UTILITY will be king. One project is perfectly positioned to dominate this new age: Energy Web Token (EWT). As the world scrambles for sustainable energy solutions and the energy transition accelerates, Energy Web is building the digital backbone to make it all happen.
The attached chart isn't wishful thinking; it's a visualization of an inevitable shift. The accumulation phase is over. The explosive, utility-driven growth is about to begin.
The Indispensable Role in the Energy Transition
The urgency of the energy transition is undeniable. We face rising energy needs and the critical imperative to reduce our environmental footprint. Energy Web is at the forefront, offering an open-source, decentralized technology stack to fast-track the move to a low-carbon, customer-centric energy system.
Their mission is to decarbonize the global electricity system using blockchain. They achieve this by enabling distributed energy resources—from rooftop solar panels to electric vehicles and large-scale batteries—to be managed on the grid in a decentralized way. This creates a more flexible, participatory energy market where every user can be both a producer and a consumer.
An Ecosystem of Heavyweights
What truly sets Energy Web apart is its staggering ecosystem of over 100 partners, including titans of industry like Shell, Vodafone, Volkswagen, and Siemens. These aren't just names on a website; they are active collaborators, including major grid operators like Elia in Belgium and Stedin in the Netherlands, all working to implement and accelerate the commercial adoption of Energy Web's technology. These global partnerships underscore the immense trust and conviction that the biggest players in the energy market have in Energy Web's solutions.
Live Products with Real-World Impact
Energy Web isn't selling a dream; it's delivering live products that form the core of its ecosystem:
Energy Web Chain (EWC): An enterprise-grade public blockchain tailored for the energy sector. Since its launch in 2019, it has processed millions of transactions for groundbreaking applications.
Energy Web Decentralized Operating System (EW-DOS): A full stack of open-source software and standards designed to connect and manage the billions of low-carbon assets that will make up the grid of the future.
Green Proofs and Data Exchange: Solutions that bring deep transparency and verifiability to emerging green product supply chains, such as Sustainable Aviation Fuel (SAF). Companies like United Airlines and Amazon are already using this technology.
Energy Web X (EWX): Leveraging Polkadot's powerful and flexible infrastructure, EWX is the next generation of Energy Web's technology. This migration enables customized, enterprise-grade solutions with enhanced security and interoperability, allowing partners to accelerate their decarbonization strategies.
The Numbers: Market Cap and Price Roadmap
As of July 16, 2025, Energy Web Token (EWT) has a market capitalization of approximately $49.7 million USD, with a price of around $1.65 USD. The circulating supply is about 30 million EWT out of a maximum of 100 million.
While no price forecast is a guarantee, the outlook is incredibly bullish. Some analyses suggest potential prices of 40.63 or even more.
These predictions are rooted in the fundamental growth of the network. The 2025 roadmap is packed with milestones, including the rollout of fiat payment integration, the launch of SmartFlow 2.0 and 3.0, the implementation of EVM support on EWX, and the execution of numerous customer and EU-level projects.
The Inevitable Shift to Utility is Here
The chart attached to this idea shows a classic pattern: a long consolidation period followed by a parabolic rise. This is not a coincidence. The market is maturing. The days of projects with no substance are numbered. Large institutional players, now entering the space, are seeking sustainable, fundamentally sound investments.
EWT is precisely that. It solves a real-world, global problem. It has a working product, an unparalleled network of partners, and a clear vision for the future. The shift to utility is the next great wave in the crypto market, and Energy Web Token is poised to ride it to unprecedented heights.
The great separation is coming. Projects built on hype will fade. Projects that create tangible value, like Energy Web, will not only survive—they will dominate. Get ready, because EWT is poised to melt faces. This time, it's different.

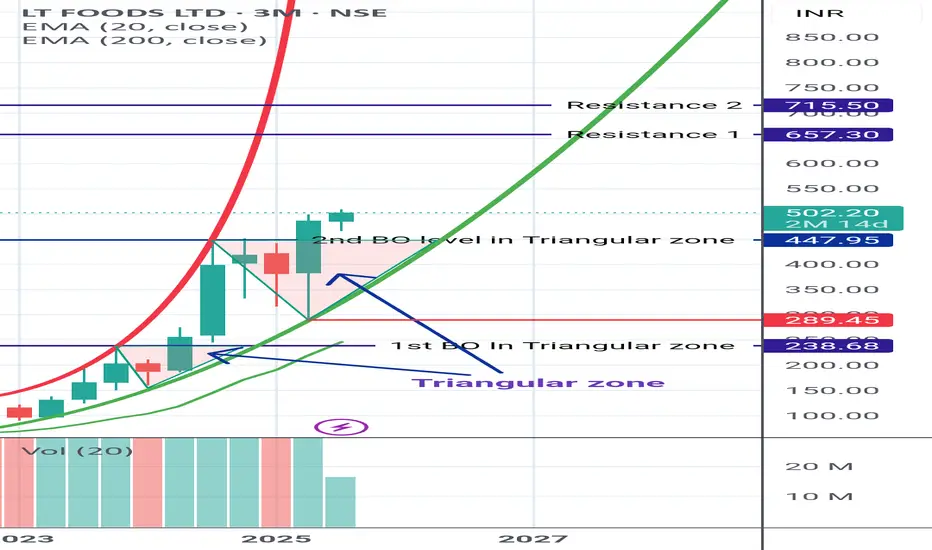
LT FOODS LT FOODS
Moving in Parabolic uptrend pattern & given Triangular zone BO Second time. Making the rally strong.
Shared it for Reference purpose based on chart pattern and My STUDY 🙏
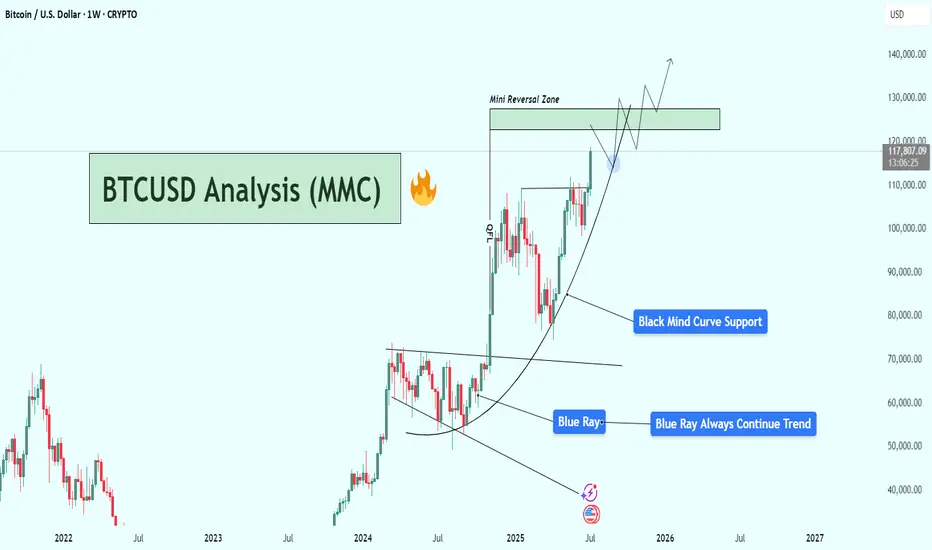
BTCUSD Weekly Analysis : Testing $130K Resistance + Next Target📌 1. Big Picture – Bitcoin is in a Parabolic Uptrend
This chart clearly shows that Bitcoin has shifted from a consolidation phase into a full-blown parabolic rally. That’s not just random growth — it’s an aggressive, momentum-driven market move that usually only happens during major bull cycles.
The curve shown in black — labeled “Black Mind Curve Support” — is your guide here. It's not a simple trendline. It shows how Bitcoin is accelerating upward, and this curve acts as a dynamic support. Every time price dips to it, buyers jump in fast — which shows strong bullish pressure and market confidence.
🔍 2. Blue Ray Broken = Trend Change Confirmed
Earlier, BTC was stuck under the Blue Ray, a long-term resistance trendline. As marked:
“Blue Ray Always Continue Trend”
That means, as long as price stays under it, the market is bearish. But guess what?
BTC broke above it — strongly.
That break confirmed a reversal in long-term structure, and it triggered this massive upward move. This breakout also aligned with a pattern of higher highs and higher lows, further confirming that bulls are now in full control.
🧠 3. Current Situation – Heading Into Mini Reversal Zone
Now BTC is trading around $117,820, and it's approaching the green box labeled Mini Reversal Zone — between $125,000 and $135,000.
Why is this area important?
It’s a psychological zone (big round numbers).
It lines up with historical resistance and previous supply zones.
It’s where smart money might take some profit, so we could see rejection or a short-term pullback here.
🎯 4. Two Scenarios to Watch
✅ Scenario A: Mini Pullback & Retest
BTC hits the Mini Reversal Zone → stalls → pulls back → retests the Black Mind Curve → bounces again.
That’s bullish and normal in a healthy uptrend. If you missed earlier entries, this pullback could be your golden opportunity.
🚀 Scenario B: Breakout of Reversal Zone
If Bitcoin breaks above $135K with strong momentum and closes the weekly candle high, we may see another parabolic rally toward $140K+.
This would mean even stronger buyer interest, possibly driven by FOMO, ETFs, or macro news.
📉 What Could Invalidate the Bullish Move?
Only if BTC:
Breaks below the Black Mind Curve, and
Starts closing weekly candles under $105K–$100K
That would mean the curve is broken, momentum is lost, and we might go into a consolidation or deeper correction.
But for now? No signs of weakness. Trend is strong, volume is rising, and price action is clean.
🧩 Summary of Key Levels
Type Level Notes
Curve Support Dynamic ($105K–$110K) Critical for trend continuation
Mini Reversal Zone $125K – $135K Watch for rejection or breakout
Bullish Target $140K+ If breakout holds above reversal zone
Trend Indicator Black Mind Curve As long as price rides this, bulls are in control
📌 Final Thoughts
This BTC chart isn’t just a random uptrend — it’s a well-structured parabola, powered by strong technical support and clean breakouts. Everything is lining up for a potential monster move, but don’t chase price blindly.
Watch the Mini Reversal Zone closely. If we see rejection, be ready to buy the dip. If we break through with volume — it’s 🚀 time again.
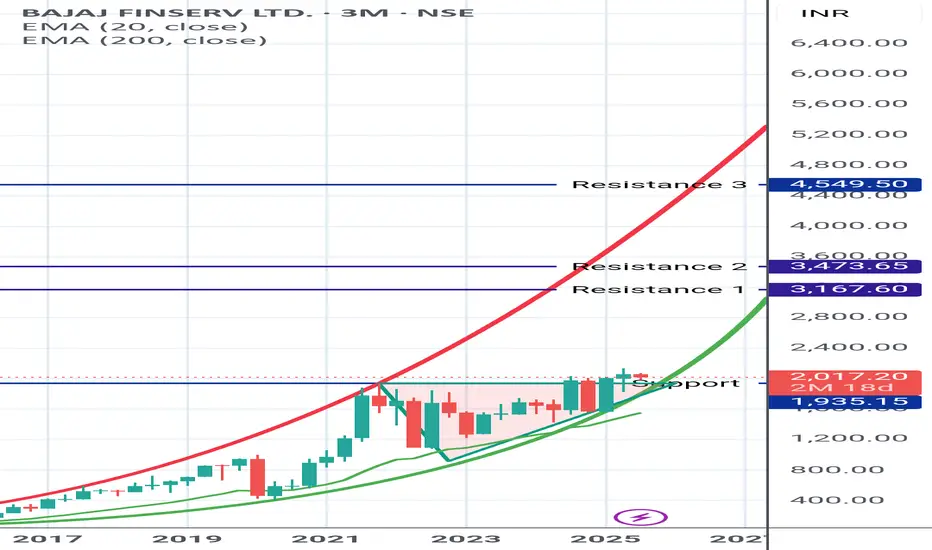
Baj Finserv Bajaj Finserv
looks good in Parabolic uptrend. Recently closed above the triangular marked zone and retesting it.
Can expect fresh rally.
Silver (XAGUSD) Structural Analysis : Curve break & TargetSilver is exhibiting a textbook bullish continuation pattern, guided by a parabolic curve structure that reflects intensifying buyer momentum. This unique setup provides a high-probability trading roadmap as we approach a major reversal zone—one where smart money may look to offload long positions or enter fresh shorts.
This analysis aims to help traders anticipate the likely path of XAGUSD based on structure, liquidity behavior, and trend psychology.
🔍 Key Structural Observations:
1. Black Mind Curve Support (Dynamic Bullish Structure)
This parabolic arc acts as dynamic support. Every bounce from the curve shows growing strength in buyer conviction.
The price is riding the curve upward with higher lows, signaling accumulation with momentum.
This is not a standard trendline but rather a curve reflecting the accelerated nature of this uptrend.
2. Aggressive Bullish Momentum
The recent price behavior has shown strong impulsive candles to the upside followed by shallow corrections, confirming bullish dominance.
Volume and candle size increase near the curve, suggesting institutional interest.
3. Reversal Zone: 37.20 – 37.45
Marked as the Next Reversal Zone, this green box represents a key supply area where previous swing highs exist.
Historically, price struggled to break this region cleanly, making it a high-probability reaction zone.
Expect either:
a bearish rejection (short-term correction), or
a consolidation before a breakout continuation.
4. Liquidity Pool & Needed Volume Zone (~35.20 – 35.50)
The market often revisits zones of untapped liquidity. This area likely holds:
Buy-side stop losses
Unfilled institutional orders
If the market needs a deeper retracement, this is the zone to watch for re-accumulation.
🧠 Market Psychology Behind This Setup:
This structure suggests a classic case of smart money accumulation, with price moving upward in a controlled yet aggressive fashion. The parabolic nature of the move points to:
Increasing retail buy-ins
FOMO-driven entries
Possible engineered sweep before the next impulse
The reversal zone could become a profit-taking area for institutions. If large players want to continue higher, they may first induce a pullback to absorb more volume at lower prices (near the curve or liquidity zone).
🔧 Tactical Playbook for Traders:
For Bulls (Long Bias):
Watch for pullbacks toward the curve or liquidity zone.
Enter long positions on bullish confirmation (e.g., engulfing candles, pin bars) off those zones.
Targets: 37.20 – 37.45, possibly higher if broken with strength.
For Bears (Countertrend Traders):
Wait for clear rejection patterns in the reversal zone.
Use confirmation like RSI divergence, momentum slowdown, or distribution volume.
Target: Curve support or deeper liquidity zone for reentry.
📌 Key Technical Levels:
Zone Price Range Description
Reversal Zone 37.20 – 37.45 Resistance / Take-Profit Area
Curve Support Dynamic (rising) Support based on parabolic arc
Liquidity Pool 35.20 – 35.50 High-volume demand zone
🧭 Conclusion
Silver is currently in a momentum-driven phase supported by smart money activity. The parabolic structure and clean liquidity map give traders a clear plan to engage both long and short setups with timing and precision. Patience around the reversal zone will be key, as the next major move may depend on how price behaves in this critical area.

BTCUSD Technical Analysis (MMC) – Resistance or Target Zone🔍 Overview
Bitcoin has executed a strong bullish recovery over the past few sessions, breaking out of a well-structured bullish channel and testing a significant resistance zone. The move exhibits traits often identified in MMC strategies, including liquidity grabs, engineered price action, and trap-based breakouts.
This chart analysis combines curve support structures, channel dynamics, and resistance reactions—all crucial components of technical strategy layered with smart money behavioral cues from MMC.
🔹 Price Action Breakdown
📈 1. Blue Ray – Liquidity Shift Signal
The bullish impulse was initiated from what is labeled the "Blue Ray" zone—a deep liquidity pocket often used by smart money to trap sellers.
This area marks a liquidity sweep after a steep selloff, creating the perfect environment for institutional buy orders to fill before driving price upward.
📉 2. Channel Formation & Breakout
A clean ascending bullish channel formed during the rally, showing a methodical stair-step price climb.
This consolidation phase provided multiple reentry opportunities before a sharp breakout, which signals a transition from accumulation to expansion, often seen in MMC mapping.
🧭 3. Curve Support – Parabolic Price Action
Price hugged a curve support line, often interpreted as a parabolic base.
This curve reflects increasing momentum—buyers are stepping in earlier at each dip, creating higher lows in a tightening arc.
This structure is also commonly seen in smart money accumulation zones as price is pushed upward while retail sentiment lags.
🚧 4. Resistance Zone – High Interest Reversal Region
BTCUSD is now inside a key resistance zone (~$109,800–$111,500), which has acted as both supply and previous swing highs.
MMC traders often identify these zones as trap areas, where price gets aggressively pushed up to fill institutional short orders.
This zone contains high sell-side liquidity, meaning there's a strong chance for a reversal or false breakout.
🔄 5. Projected Reversal Zone
A potential correction could bring price down to the next reversal zone (around $106,500–$107,500).
This zone is supported by:
The curve structure, which is still active.
Previous minor resistance turned support.
Institutional demand likely waiting to reload long positions.
📉 Possible Scenarios
✅ Bullish Continuation
If BTC can break and sustain above $111,500, especially with strong volume, it will likely push into new local highs.
In this case, curve support may be used for re-entry on pullbacks.
❌ Bearish Reversal Setup
A rejection from this resistance zone—especially with a long-wick candle, engulfing pattern, or divergence—could confirm a short-term top.
MMC-style reversals often occur quickly and aggressively, trapping late buyers.
⚙️ Trade Management Insights
Trade Setup Entry Area Target Stop-Loss Notes
Aggressive Short ~$110,800 ~$107,500 ~$111,800 Only on strong rejection pattern
Conservative Long ~$107,000 Retest $110,000+ Below $105,500 Only if curve support holds clean
Breakout Buy Above $111,800 Open upside Below $110,000 Wait for breakout + retest
🧠 MMC Observations
Price Engineering: The market moved through clean zones quickly—classic MMC manipulation to clear liquidity.
Trap Zones: The resistance zone may act as a bull trap where late retail buyers are absorbed.
Smart Money Flow: Institutional traders may now shift to distribution mode unless curve support holds firmly.
💬 Final Thoughts
Bitcoin is at a key decision point. Traders should remain flexible but vigilant. The presence of curve support combined with aggressive upward momentum suggests bullish strength, but the resistance zone and prior liquidity behavior warn of potential trap activity.
Monitor the reaction closely in the next 1–2 candles. A failed breakout could trigger a swift 2–3K retracement.
📌 Tip: Combine this analysis with on-chain volume or open interest data for better conviction.

Next high will be lastAccording to parabolic move next high will be last high and end of bull season. Crypto market will be stable be and bear will start after stability.

TIA | Next Altcoin to MOON ??In the macro, it's clear that TIA has been in a downward trend for an extended period of time. This means, it's a great place to buy - because the bullish cycle is up next.
In an earlier publication, I made an update about the ideal entry point for TIA:
A key indicator to watch is the daily timeframe, when the price begins to trade ABOVE the moving averages - that's when you'll have the first confirmation of a bullish turn around. It is a bullish sign to see the gradual higher lows.
Moving Averages:

Insane volatility imminent conspiracyI've seen one other TA notice this parabolic base forming (pink area) which I believe we'll be exiting over the next few years. Maybe it will happen this bull cycle. However, I think it's also possible that this bull cycle will be somewhat lackluster, not exceeding $150k, before correcting down to the 80's with wild volatility. I think this will shake out A LOT of investors and now that we have the likes of Black Rock et al in the mix, it's my theory that they don't want us in at the bottoms they want us in as their exit liquidity. When BTC does exit this formation and is supported above it very briefly, we're going to see the proverbial 'god' candle with absolute vertical movement. This will likely be nation states and corporations finally having the eureka moment. And it will occur during the 'usual' bear market.
As the title states, this is a conspiracy but it seems like a very plausible scenario. Of course there's fundamental theory laced in with TA which I shouldn't do here but we're living in wild times. Am I stupid? Let me know!

TradeCityPro | CELOUSDT Suitable Trading Opportunity👋 Welcome to the TradeCityPro channel!
Let’s analyze CELOUSDT, a cryptocurrency that appears to present opportunities in both spot and futures markets this week.
🌍 Market Overview
Before diving into CELO, let’s take a look at Bitcoin during the London session. BTC continues to print red candles, with its dominance (BTC.D) ranging.
This scenario leads to a balanced market correction, where individual coins behave independently based on their BTC pair performance.
📊 Weekly Timeframe
CELO has been ranging within a weekly box for approximately 830 days, with no significant breakout.
While buying at the box's bottom might have yielded 100% gains, holding positions for extended periods in a risky market like crypto can lead to "capital dormancy," causing stress. Hence, trigger-based trading is preferred.
This time, CELO has printed a higher low within the box, hinting at a potential breakout.
Breakout above 0.8412 with a stop loss at 0.4083 for a mid-term buy.
If missed, another entry above 1.2530 with confirmation from RSI moving into overbuy territory (76.06) ensures a more secure position.
📈 Daily Timeframe
CELO is currently testing the box resistance but shows stronger buyer momentum this time.
Last rejection from 0.8683 led to a correction down to 0.5318, but buyers established a higher low compared to 0.3998, indicating a shift in momentum.
Daily RSI needs to break 74.22 to confirm a sharp move upward , Upon confirmation, price could rally to 1.0503.
⏱ 4-Hour Timeframe
CELO has formed a parabolic movement, with consistent support at the curve line during pullbacks.
Despite some weakening momentum, as long as the price holds above the curve, there’s potential for further upside.
📈 Long Position Trigger:
Breakout above 0.8683 to initiate a long position.
As long as the price remains above 0.7352, higher lows per Dow Theory suggest strength.
💡 BTC Pair Insight
CELOBTC is bearish but shows signs of weakening bearish momentum, which might lead to a trend reversal or a new bullish phase.
Coins with similar BTC pair setups last week either didn’t move or experienced significant pumps after their triggers.
📝 Final Thoughts
Stay calm, trade wisely, and let's capture the market's best opportunities!
This analysis reflects our opinions and is not financial advice.
Share your thoughts in the comments, and don’t forget to share this analysis with your friends! ❤️

I think is time to start talking about PARABOLASOnce BTC goes above previous ATH is a good time to start analyzing parabolas. If you look closely once it breaks previous ATH the movent continues ascending in a parabolic move and then braking the pattern to culminate in a lateral correction or bear markets. Lets see this time

#Bitcoin is on the verge of a parabolic rise!CRYPTOCAP:BTC , which started the parabolic run 700 days after the 2015 and 2018 bottom confirmations, is on the verge of a parabolic run again in October 2024, 700 days after the 2022 bottom confirmation. 📈

DOGE Ready for next expansion stage. Happy Monday traders!
Today we are taking a look at the All Time History of DOGE coin. Before we look at eh price action of DOGE lets take a trip down memory lane and give you some history of this coin.
Doge: Much Coin, Very History
Doge, in internet meme culture, refers to a photo of a Shiba Inu dog with multicolored Comic Sans text captions representing the dog's thoughts. This meme became wildly popular in the early 2010s, inspiring. Yet, most have never looked up the true meaning of the word DOGE.
Dogecoin (DOGE), launched in December 2013 by software engineers Billy Markus and Jackson Palmer. It was created as a lighthearted parody of the seriousness surrounding Bitcoin and other cryptocurrencies at the time. They built Dogecoin using Litecoin's open-source code, which itself stemmed from Bitcoin.
Dogecoin quickly gained a loyal following, especially on sites like Reddit, where it became a popular tipping currency for content creators. Despite its comedic origins, DOGE achieved surprising success. Here are some milestones:
Instant popularity: Over a million visitors flocked to Dogecoin.com within the first month.
Community focus: Dogecoin fosters a fun and inclusive online community, a stark contrast to some other cryptocurrencies.
Elon Musk effect: Celebrity endorsements, particularly from Elon Musk, have caused the price of DOGE to fluctuate dramatically.
Highs and lows: In 2021, DOGE reached a peak market capitalization of over $85 billion, but its value remains volatile.
DOGE Definition: The chief magistrate in the former Italian republics of Venice and Genoa, known as the Doge (pronounced DOZH), held a complex and multifaceted role. Fun fact, Coins minted by the republic often featured the Doge's image or an abbreviation of their name. This served as a symbolic stamp of approval and helped ensure public trust in the currency.
Today, Dogecoin remains a prominent cryptocurrency, though its price is significantly lower than its 2021 highs it may be repeating its historical gains very soon. Whether it's intention was to be a serious contender in the future or a lasting internet joke, DOGE's place in crypto history is secure.
What do the charts say
Looking at the all time history of this coin we can see that the price action has created two previous run ups producing over 21,000% gains between 2015 and 2017 and again reaching for the sky and touching over 50,000% gains during the 2020/2021 crypto bull market.
Each cycle DOGE has nearly mimicked its prior cycles bear market, accumulation period and eventually, a mind melting bull run. As you can see on the chart we have completed the bear market and are currently breaking out of accumulation.
My personal Targets for DOGE are $4.20, $10.10 and $12.00. If Doge did just half of the gains it did last run it would reach a total of over $12. With rumors shooting around the internet that Elon may add DOGE as the local currency for the X platform and this being a real possibility, I think it is counterproductive to think these type of gains are not in the cards.
Much profits,
Savvy

Bitcoin Macro Parabolic Continuation?If continuation, the steepness of the parabola implies a large move...$85k at a minimum. If the parabola breaks, distribution targets (~50% correction) are on the table.

3 Touches and your done #BITCOIN is on Parabola watch.#Crypto creates many parabolic moves
as they are reflexive assets fuelled by Fear and Greed.
I am currently on alert that we may have a parabolic rise on our hands.
And we could #BTC double to reach very close to that $100K level
BEFORE summertime.
Our #Alts could go beserk
but we must have some sort of selling plan in place.
You need to come up with your own plan!

📈DYDX: Is it finally breaking out?🔥🔔🔍DYDX is finally breaking out of its consolidation range after 672 days. The price is currently trading above the supply zone and is supported by a well-defined curve. This could be the start of a parabolic move.
✅The fixed range volume profile indicator shows that we have broken out of the high-volume zone and are ready to start moving. The SMA25 indicator is also confirming the move and is moving along with the price.
🛒The current candle is a good opportunity to buy spot. We can enter after the candle closes. The stop-loss should be placed at $2.5, which is the previous low and the POC of the fixed range volume profile.
🚀For targets, I am looking at $7.8 and then $23.7 (ATH). However, I will not place sell orders now. I will wait and see how the price reacts to these levels.
📊One positive thing about this coin is that the volume has increased significantly during the recent move. This shows that traders are paying more attention to this coin.
💥The RSI oscillator is also entering the overbought zone. This increases the chances of a parabolic move. However, with the high buying volume, we can expect this move to be upwards.
🧠💼This is not financial advice, and it is only my personal opinion on this cryptocurrency. Please do your own research before making any investment decisions.

EGLD: parabolic curve in 4hTo complement my previous idea, we can see the possible parabolic curve that EGLD would be forming.
Again, be ready for surprises, the last point of supply (LPS) can happen violently, I would not leverage.

MOONBEAM (GLMR) long idea based on obv In the vast world of crypto, Moonebam Network shines,
With GLMRUSDT, a trade idea intertwines.
On balance volume, it diverges with might,
Since November 22 of 2022, a hopeful sight.
Through highs and lows, we've journeyed far,
Witnessing an all-time low on May 10th, like a shooting star.
But amidst the darkness, a divergence emerges,
A glimmer of hope, as optimism surges.
With on balance volume diverging hard,
An upward movement may catch us off guard.
A parabolic rise, like a rocket in the sky,
Moonebam Network ascending, reaching new highs.
So let's hold onto hope, and trust the signs,
As GLMRUSDT paves the way, where opportunity aligns.
From the depths of doubt, we anticipate,
A journey of success, as we elevate.
In this hopeful tale, we set our sights high,
Moonebam Network soaring, reaching for the sky.
With divergence as our guide, we'll ride the trend,
A story of triumph, where dreams transcend.
In the world of trading, risks come into play,
But manage them wisely, in your own unique way.
It goes without saying, it's NFA,
To preserve your capital, make it sway.
Set your stop-loss, keep your goals in sight,
Trade with caution, both day and night.
Take charge of your risks, let them not prevail,
In this volatile market, where fortunes unveil.
Research and analyze, before you dive,
Make informed decisions, so you can thrive.
But remember, my friend, it's your preference to decide,
Manage risks effectively, and let success reside.

It needs a correctionIs super over extended. It can go down very fast. It just opened a short position.
$CRYPTO Total Market Cap - 3.6T LoadingCat calling $3.6T Total Crypto Market Cap 2023. Parabolic blow off 1st-2nd QT of 2023, followed by an equally impressive crash in all markets.
