Is FIL/BTC only at Base 3?Not an expert. Not financial advice.
Am I reading this right? Is FIL/BTC about to take off on its biggest leg up in this current parabolic curve?
Parabolicmove

$OCGN PT 180-200 and higherOcugen, Inc., a clinical-stage biopharmaceutical company, focuses on the developing gene therapies to cure blindness diseases. The company's pipeline product includes OCU400, a novel gene therapy product candidate restoring retinal integrity and function across a range of genetically diverse inherited retinal diseases, such as retinitis pigmentosa and leber congenital amaurosis; OCU410, gene therapy candidate for the treatment of dry age-related macular degeneration (AMD); and OCU200, a novel fusion protein that is in preclinical development stage for the treatment of diabetic macular edema, diabetic retinopathy, and wet AMD. Ocugen, Inc. has a strategic partnership with CanSino Biologics Inc. for gene therapy co-development and manufacturing; and Bharat Biotech for the commercialization of COVAXIN in the United States market. The company is headquartered in Malvern, Pennsylvania.
QTUM Soon Gonna Reach The Peak Of Parabola MovementQTUM Price traded at $19.79 with a gain of 36.40% in the last 24-hour and 24.17% up in the weekly time frame. Furthermore, QTUM bounced from the support of $11.72. In contrast, the market capitalization stands at $1.9 billion. Technically, investors can perceive a positive crossover in the EMA, and the price is above the 55-EMA. RSI index showcases an upward slope. Moreover, the price movement can be towards the resistance of $22 in future trading sessions. Also do check my previous article on QTUM’s parabolic movement here
Resistance: $22.0
Support: $11.72

NEO comes out of nowhere for its epic run!This is a very simple observational chart!
Neo is super strong at the moment, which is what I like to see!
A simple resistance/support line drawn in (looking left), it is important where today's daily candle closes. (have used a 3day candle chart to show last run more clearly)
If it closes below the line, I would expect this to become a resistance, consolidation zone for a while.
If we close above, do we retest as support or just rocket through?
Elliot wave, I would say we are on the 3rd wave, so a 4th wave pullback, red candle would not be too unexpected.
Happy Trading
(not saying to buy or sell)

Please comment on my idea. Thanks.Look at this chart. You dont even have to know anything about technical anallysis or anything. Just simply look at it. It have to go down if it is to have sustainable upward movement. You dont even have to look any indicators to know this is an overbought instrument right now.
Im not going to lie, im in love with xrp since i was fortunous enough to enter very early before the huge price movement. But i expect downward movement and maybe a some sort of consolidation period before going up again. I did sell all of my holdings couple days back and im eagerly waiting to enter again. It seems it cant make a huge upward movement before taking some time to chill but you never know when! Therefore keep an eye on xrp. It can have you win big!
Good luck and be responsible with your hard earned money!
Always watch out for opportunities but be carefull.


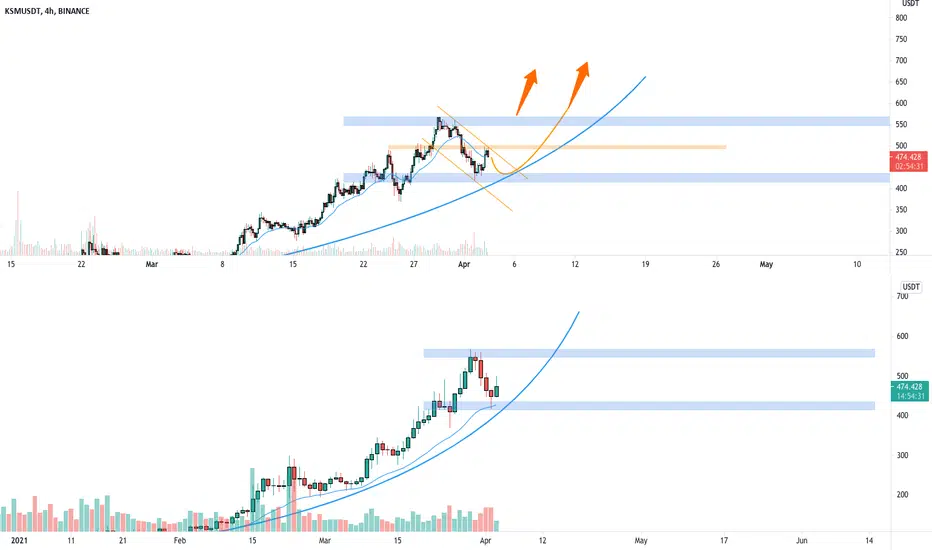
KSMUSDT is creating a parabolic 🦐KSMUSDT is creating a parabolic, and on 4h timeframe the price is creating a descending channel IF the price will have a breakout from daily resistance, According to Plancton's strategy (check our Academy), we can set a nice order
–––––
Follow the Shrimp 🦐
Keep in mind.
🟣 Purple structure -> Monthly structure.
🔴 Red structure -> Weekly structure.
🔵 Blue structure -> Daily structure.
🟡 Yellow structure -> 4h structure.
⚫️ Black structure -> <4h structure.
Here is the Plancton0618 technical analysis, please comment below if you have any question.
The ENTRY in the market will be taken only if the condition of the Plancton0618 strategy will trigger.
NULS/USDT 1 hour chart In this idea I show the movement through a formation that will soon break to the upside in a big way. I have overlaid a fractal that I believe best illustrates the movement I expect from the price action prior to and following breaking through the upper trend line. Bitcoin's upper resistance I expect it to be rejected from is 57951 before retracing down a good bit possibly as low as 43k. That movement should not take place till early am Monday allowing time for this pump to happen.
This coin is going to see some very good movement in the coming months with an exit on the long prior to a healthy retrace being $3.50 when we reach a previous major high and create a double top. After i think it will not be long before we see $10.
If you agree throw me a like and follow me for more unique ideas and concepts that keep you in the gains. Much love to my supporters.
ND

THETA ShortM pattern forming (with 3 trendline rejections, the 3rd currently rejecting)
Parabolic run up while the rest of the market was either ranging or moving up slowly
Options expired yesterday, so could see a further move downwards as we have seen in the past after options expire
Nearing the end of the week/month
Its currently the weekend where we usually see a correction of the weeks bullish movement
2 strong rejections of the $14.50-$15.00 supply zone on 23rd and 24th March
BTC is currently still in a range between $50-$55k (current price is $54k)
Daily/3D/W RSI still in heavy overbought territory at 70 and above

10 Year Yield Moving parabolicallyThis is what I see for the 10-yr: a parabolic- type move as repo rates go negative and banks go short on treasury bonds. As of right now there is nothing stopping the yield form going to about 2%, although I do believe the Federal Reserve will intervene before that happens.


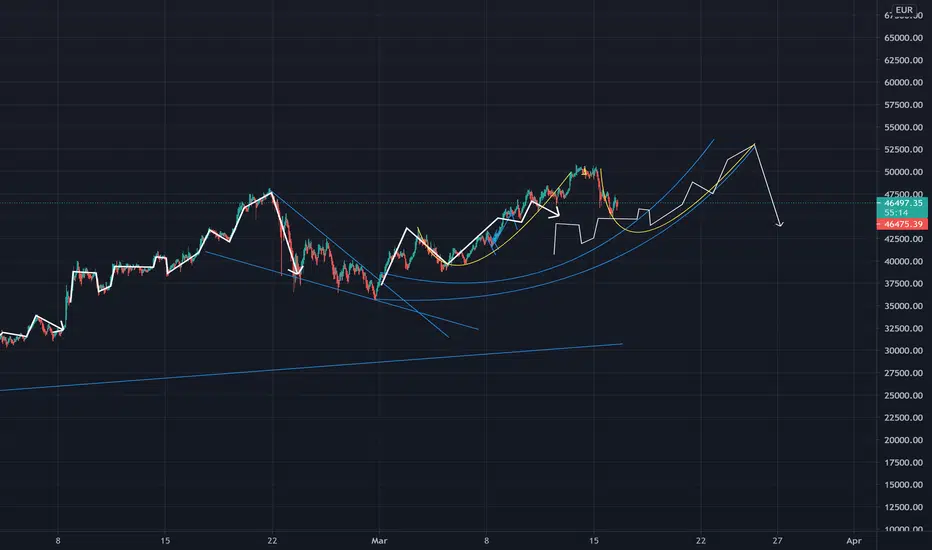
Huge parabolic curve setup today!We see the start of a huge parabolic to push out to the next top before we see another big correction. We hit about 43000euro or 51000 usd before we start to move up again.
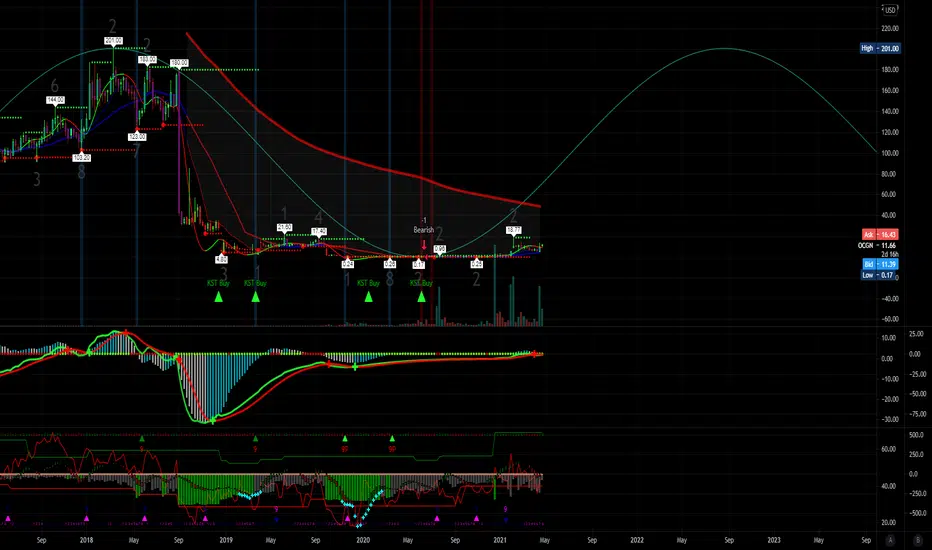
UMA/USD: NO Whammy NO Whammy! STOP! CASH? Pls?!What's Up my Financial Amigo's & Amigas:
Keeping it simple since I've had too much scotch at this point:
Shown here is a basic(ish) 3 Base Step Parabolic Curve Structure (or seemingly so despite a less than perfect step structure IMO - such may likely be worsened from the aforementioned scotch), Regardless: wherein, X mark'ith that M'Fing spot on that M'Fing plane, located just prior to largest leg up (thus far - Step 3).
Also, not TA per se...but my gut got a tingle this afternoon when I was walking my dog, so I bought some. Sometimes a gut is much more reliable than TA...and sometime you also lose money way faster lol. Gamble was and is easier said and done during bull markets I know, but the trend is ur friend, don't hate the playa, hate the game, yadi-yadi-yadi, where is my boat, etc.,
Also and essentially: I just think its time for UMA to move another leg up, or if not still, very close. It could also and very well go higher, but IDK, this is my first bull run so I am still unsure of how large gains can be----and honestly I am still burned a bit with have scars on my scars from last bear market...So 293% Profit will have to do...for now. Come get some!
If so... or even close to that, well honestly, I am gonna be the one who becomes parabolic if u know what I mean...get it...lol sorry but that joke was simply "too hard" to resist. ;)
Either way I'll prob sell sooner that my projection in order to pt those funds into another opportunity (since I am not a whale and still have bills to pay you arrogant trust fund babies in the chat room) JK, It's okay, I am jealous of that sort of financial freedom, but all good things come to those who wait right?!!? *** cough cough OXT cough cough ***
NOT financial advice. GL trading ladies and gents/people, etc.

Bitcoin is Tracking this Parabolic Bar PatternBitcoin has been following a parabolic trajectory similar to the trajectory from November/December 2017. A bar pattern is displayed which was taken up to the 2017 peak around $19400 USD. This is shown on a linear scale. I've been tracking this bar pattern since early February and it has been following pretty accurately. Take this with a grain of salt as it is just a fun indicator but should only be used as an idea with your own technical analysis. If this plays out, I think this would just be a local top and not the market cycle top. I believe there will be a global blow off top at the end of the year, or some time next year.

$BCHUSD - Parabolic uptrendHello everyone!
Wait for a completion of the correction and go long or wait for a breakout from the current resistance at $546.
There is a possible cup and handle pattern being formed on BCHUSD, nevertheless the best takeaway is to go long above $546

Matic Right now...WoWNot to discourage anyone from "pumping my bags" as they say, but seems like a serious correction is due. I am not selling as my cost basis is at the bottom of the chart 0.005-0.01-approx. Might add some on 20-30% dump from here. Comfortably hodling and will probably stake in the next few days. That is a hell of a parabola.

TSLA Bubble is close to bursting!Almost at the end of a large 5th Elliot Wave, will need to pull back hard to make Tesla healthy. This could be triggered by earnings tomorrow or soon after (It may approach 1000) Tesla is losing market share in Europe at a face pace to VW. Extremely overvalued at the moment due to people using it as an asset like BTC.
Target 1 Short - 364
Target 2 Short - 219

$780 TESLA!!!A PARABOLIC MOVE CONSISTS OF 4 BASES.
Refer to the link attach here: pixiutrades.files.wordpress.com
From the chart above we can clearly see all 4 bases and we are likely in the fourth base now that could probably send us to $780 to $800 range in days or weeks ahead.
But becareful, usually after base 4 is done, a massive pullback will likely happen. In this case, it could send Tesla back to base 3 at around $465!
Wish you all good luck! God bless! Remember to follow me for more updates ahead!
Merry Christmas everyone!


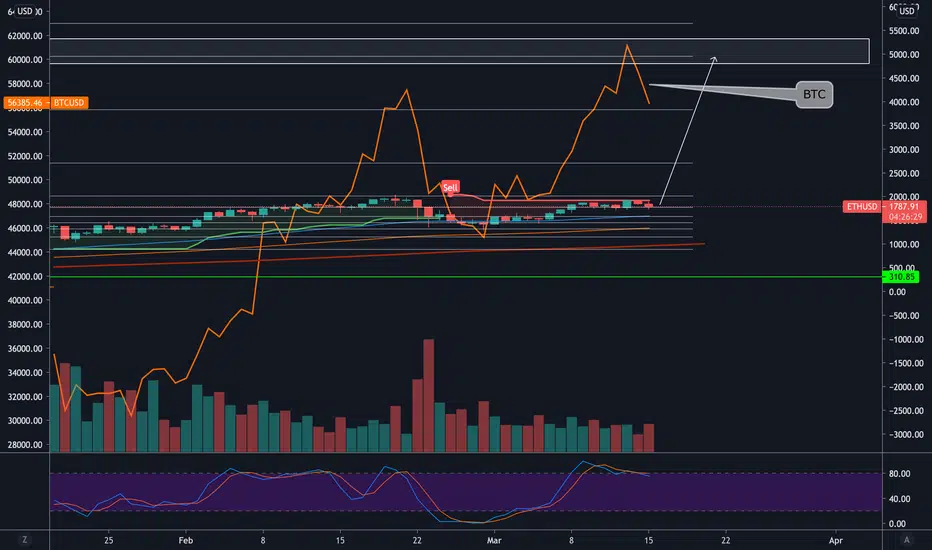
BTC Parabolic Moves Left BTC Q2 2019 - Right BTC Q4 2020
Bitcoin almost always ends it's moves in a parabolic fashion
With $36.000 as a key strike for Derbit options we may have a powerful gamma squeeze in the making
Don't FOMO the top, every parabolic move is followed by a correction

PARABOLIC BITCOIN MOVEMENT! 30K NEXT???A PARABOLIC MOVE CONSISTS OF 4 BASES.
Refer to the link attach here: pixiutrades.files.wordpress.com
From the chart above we can clearly see all 4 bases and we are likely in the fourth base now that could probably send us to $28,000 to $30,000 range in days ahead.
But be careful, usually after base 4 is done, a massive pullback will likely happen. In this case, it could send Bitcoin back to base 3 at around $20,000!
Wish you all good luck! God bless! Remember to follow me for more updates ahead!
Merry Christmas everyone!

Make Indicators Profitable AgainIf you have been in the market for some time, then you have probably tried a few different indicators. Some may have worked well, others not so much. However, just because the indicator's default version didn't work, that doesn't mean it doesn't have potential!
Parabolic SAR Default
We have tested the Parabolic SAR with its default settings, on ETH/USDT 4h chart, on Kucoin. Each trade was taken with 100% of the available equity, and resulted in a total profit of -89%. This means that you would have decimated your account if you had used the default Parabolic SAR. The default Parabolic SAR values on Tradingview are: "Start" 0.02, "Increment" 0.02 and "Maximum" 0.2.
Modified Parabolic SAR
By modifying the "Increment" and "Maximum" values to 0.002, you will create a version that has a total profit of 492%! This version even works on shorts. There are even more profitable versions of the Parabolic SAR strategies which you can use. We have just tested a few different values, but more extensive testing would almost certainly bring better results.
Although you can use this indicator for your entries and exits, it is better to use it as a filter. This version is a lot slower than the default one, and as such, it only catches the big trends. As mentioned earlier, it also works on shorts; therefore, it can identify bear markets accurately. Therefore, you can use this version as a filter to find the long-term trend, and then use another indicator that signals more often, such as the MACD, to find the appropriate entries and exits.
