AUDJPY - let's do it again!Hello TradingView Family / Fellow Traders. This is Richard, also known as theSignalyst.
As per our last AUDJPY analysis (attached on the chart), it rejected the first blue circle zone and surged in a parabolic manner.
📈AUDJPY is currently retesting the intersection of the blue trendline and red support.
📚 As per my trading style:
As #AUDJPY is around the latest blue circle zone, I will be looking for bullish reversal setups (like a double bottom pattern, trendline break , and so on...)
📚 Always follow your trading plan regarding entry, risk management, and trade management.
Good luck!
All Strategies Are Good; If Managed Properly!
~Rich
Disclosure: I am part of Trade Nation's Influencer program and receive a monthly fee for using their TradingView charts in my analysis.
Parallel Channel

US100Price broke daily resistance last week and now looks like a retracement is on the way. H4 gave a double top at the rising channel resistance. Pulling back to retest the neckline. target is 22,200.

Dow Jones Wave Analysis – 1 July 2025
- Dow Jones broke the resistance zone
- Likely to rise to resistance level 45000.00
Dow Jones index recently broke the resistance zone located at the intersection of the resistance level 44000.00 (former top of wave iv from March) and the resistance trendline of the daily up channel from May.
The breakout of this resistance zone accelerated the active impulse wave (3) – which is part of the multi-month upward ABC correction 2 from April.
Dow Jones index can be expected to rise to the next resistance level 45000.00 (target price for the completion of the active impulse wave (C)).

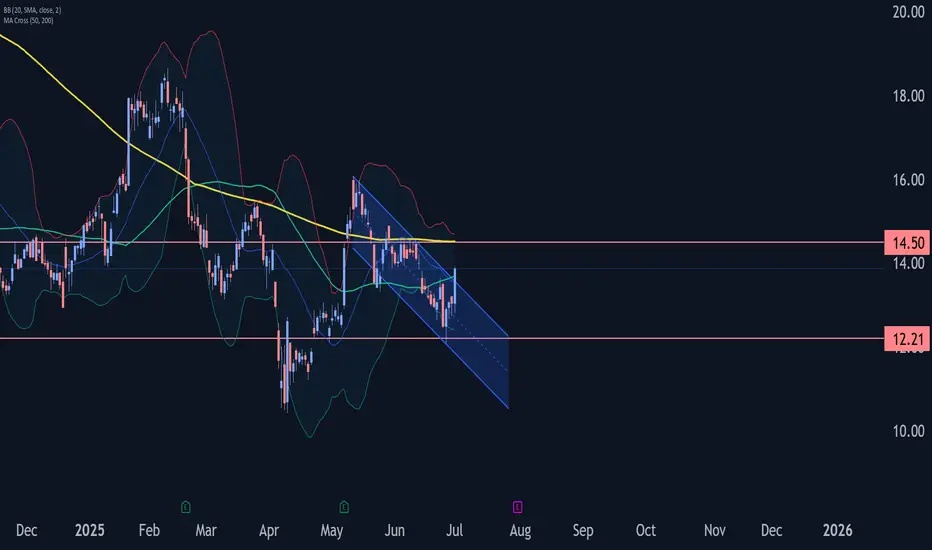
Trip Wave Analysis – 1 July 2025- Trip broke daily down channel
- Likely to rise to resistance level 14.50
Trip recently broke the resistance trendline of the daily down channel from the start of May (inside which the price has been falling in the last few weeks).
The breakout of this down channel accelerated the active short-term corrective wave (ii) – which is part of the downward impulse wave C from last month.
Trip can be expected to rise to the next resistance level 14.50 (which reversed the previous waves ii and (2) at the start of June).
STZ | Reversal Setup – 35-Year Channel Support + Falling WedgeTicker: NYSE:STZ (Constellation Brands Inc.)
📆 Timeframe: 1W (Weekly)
📉 Price: $166.74
📈 Pattern: Descending wedge + long-term parallel channel from 1989
📊 Pattern Breakout Probability: ~69% in favor of bullish reversal
🔍 Technical Setup:
STZ is currently testing the lower bound of a macro rising channel going back to 1989 — a level historically associated with major market bottoms. At the same time, price is compressing inside a descending wedge, a high-probability bullish reversal structure.
📊 According to historical chart pattern statistics, falling wedges break upward ~68% of the time, especially when accompanied by rising volume and multi-decade support.
🧠 Trade Thesis:
📥 Buy Zone: $160–$170
⛔ Stop-Loss: $150.79 (below wedge support, could be an increasing trailing stop)
📐 Probability of Upward Breakout: ~69%, based on classical pattern statistics
🎯 Upside Targets & ROIC (from $166.74):
Target Price Return
🎯 Target 1 $218 +31.2%
🎯 Target 2 $257 +54.2%
🎯 Target 3 $273 +63.8%
⚠️ Why This Setup Is Exceptional:
✅ 35-year rising channel support — rarely tested
✅ Descending wedge compression = bullish tension
✅ Volume spike and price rejection = signs of bottoming
✅ Statistically supported pattern → ~7 in 10 chance of breakout
💬 STZ combines deep technical structure with statistically supported probabilities.
This is the kind of trade setup where structure, price, and probabilities align.
#STZ #FallingWedge #ChartPatterns #SwingSetup #TechnicalBreakout #TargetTraders

BTCUSDT at Best Resistance !!This is the Daily chart of Bitcoin .
BTCUSDT is trading near it Resistance Zone 108,600 - 107,400.
If this level is sustain , then we may see lower prices in BTCUSDT.
Thank You !!

Bitcoin can turn around from seller zone and start to declineHello traders, I want share with you my opinion about Bitcoin. The price previously broke above the support line and made a strong bullish move from the buyer zone (99300–100500 points). After the breakout, the price started rising steadily and is now approaching the Seller Zone (108500–109500), which also coincides with the resistance line of the downward channel. This area has shown strong bearish pressure in the past. Every time the price entered this zone, it quickly reversed. It’s a key area where many traders seek short-term opportunities. Currently, price is just entering this zone again and showing early signs of weakening momentum. Given the channel's structure, past price behavior near this resistance level, and the presence of the seller zone, I expect BTCUSD to turn around soon. Once the price rejects this level, I anticipate a reversal and a move back into the channel, continuing the downward trajectory. My first target is set at 103000 points, near the center of the range and above the support level (100500). This area has been tested multiple times before and may act as a strong buffer again. Please share this idea with your friends and click Boost 🚀
Disclaimer: As part of ThinkMarkets’ Influencer Program, I am sponsored to share and publish their charts in my analysis.

AUDUSD Breakout ascending channel and consolidation breakout 1D 📊 AUD/USD Technical Breakdown – 1D Time Frame
The Aussie has officially broken out of both the ascending channel and the consolidation phase, signaling strong momentum ahead. 🚀
📍 Entry Level: 0.65800
🔁 Possible Retest Zone (Support): 0.64000
🎯 Technical Targets:
✅ 1st Target: 0.66900 (Key Supply Zone)
✅ 2nd Target: 0.69000 (Major Resistance Level)
Market structure and price action suggest bullish continuation if the breakout holds. Always manage risk accordingly. 📈
---
💬 Drop your thoughts below
❤️ Like, 🔄 Follow, and 👥 Join us for more real-time updates and smart setups!
— Livia, keeping it sharp 😜

GOLD → Retest of the resistance range. Correction?FX:XAUUSD is recovering amid expectations of lower interest rates in the US, and the falling dollar is also supporting the price of the metal.
The dollar remains under pressure due to political uncertainty in the US, budget concerns, and trade risks. However, strong stock market growth and possible tariff measures against Japan and the EU are also affecting the market, adding volatility to gold
Powell will speak at the ECB forum, and markets are waiting for him to hint at a rate cut. Currently, the probability of a cut in July is estimated at 20%, and in September at 77%. A dovish tone will support gold, while a hawkish tone will increase pressure.
Technically, since the opening of the session, gold has exhausted its daily range (ATR), and there is a fairly high probability that after strong growth, the price may be stopped in the 3347-3350 zone.
Resistance levels: 3347, 3350
Support levels: 3312, 3295
If gold cannot continue to rise after breaking through 3347 and the price returns to the resistance zone, then in this case, we can consider a correction to 0.5-0.7 Fibonacci before a possible continuation of growth.
Best regards, R. Linda!

EURGBP: Strong Bullish Confirmation 🇪🇺🇬🇧
EURGBP is going to continue rising in an uptrend
that the pair established at the end of May.
A completion of a consolidation and a formation of a new local Higher High
indicate a highly probable bullish continuation soon.
Next resistance - 0.8605
❤️Please, support my work with like, thank you!❤️
I am part of Trade Nation's Influencer program and receive a monthly fee for using their TradingView charts in my analysis.

GOLD → Recovery and retest of resistance. DowntrendFX:XAUUSD has been recovering since the start of the session thanks to a weak dollar, but further growth is uncertain. However, the price is still below the key range and important levels.
At the beginning of the week, gold rebounded from monthly lows amid a weakening US dollar, which remains under pressure due to trade disputes with Japan, uncertainty surrounding the budget, and expectations of a Fed rate cut in September.
However, the technical picture for gold remains bearish, and further dynamics will depend on new statements from Fed officials, labor market data, and Jerome Powell's speech on Tuesday.
Technically, after breaking through the global range support, the price is forming a correction and testing 3294. Before a possible rise to 3320 or to the 0.7 Fibonacci zone, a correction to 3271 may form, which will determine the further development of the situation.
Support levels: 3271, 3255, 3245
Resistance levels: 3294, 3320, 3347
A retest of 3295 (0.5) Fibonacci is forming. There is a possibility of a false breakout with a possible correction. If, during the correction, buyers keep the price above 3271 and return to retest 3294, we will have a chance to attempt growth to 3320 - 3347
Best regards, R. Linda!

BTCUSD parallel channel On the daily chart, BTCUDS is running in the parallel channel. The short-term market fell back after testing the upper resistance. At present, we can pay attention to the short-selling trading opportunities, and the downside target is around 98000. If the price breaks through the resistance near 108800, it will break the channel.

KULR | High-Growth Channel Reversal – Targets +298% to +2,368%📍 Ticker: AMEX:KULR (KULR Technology Group, Inc.)
📆 Timeframe: 1W (Weekly)
📉 Price: $7.11
📈 Pattern: Rising parallel channel with bullish consolidation
🔍 Technical Setup:
AMEX:KULR is respecting a clean ascending channel since early 2023 and is currently consolidating just above key support and the lower trendline, forming a launch base.
🔵 Key Resistance: $6.51 has flipped to support
📈 Price bounced from demand zone + holding mid-channel
📊 Volume profile supports accumulation at lows
🧠 Trade Plan & Dynamic Stop:
📥 Entry Zone: $6.80–$7.20
⛔ Trailing Stop: A few % below the lower rising trendline
→ Trail it dynamically as the channel rises (e.g. ~4–7% buffer under trendline)
🎯 Targets & ROIC:
🎯 Target 1: $9.45
→ Return: +31.3%
🎯 Target 2: $28.81
→ Return: +305.1%
🎯 Target 3 (Channel Top): $168.12
→ Return: +2,268%
⚠️ Key Technical Notes:
Bullish retest of major breakout zone ($6.50) is holding
Trendline structure is strong → perfect for trend-following strategy
Trailing stop method protects gains without prematurely exiting
Momentum expected to increase above $9.00
💬 Is KULR about to explode higher with the next growth leg?
Watch for confirmation above $9.50 for breakout acceleration.
#KULR #ChannelBreakout #SmallCapTech #ExplosiveSetup #TrendTrading #TargetTraders

This look promising for Crypto!The DXY breaking below its trend channel is a really positive sign for risk assets like Bitcoin and Altcoins. Usually, a weak dollar means more money flows into risk assets. The DXY's technical target is 89, which is the level to watch for the end of the crypto bull run.

USDCHF Wave Analysis – 30 June 2025
- USDCHF falling inside a minor impulse wave
- Likely to fall to support level 0.7900
USDCHF currency pair is falling strongly inside the minor impulse wave 3, which recently broke the daily down channel from the start of May.
The breakout of this down channel follows the earlier breakout of the key support level 0.8055 (which stopped the previous impulse waves (1) and i).
Given the strong daily downtrend and the continuous outflows from US dollar or risk-on mood, USDCHF currency pair can be expected to fall to the next support level 0.7900, the target price for the completion of the active impulse wave 3.

NZDUSD → Pre-breakout consolidation. One step away from a rallyFX:NZDUSD is consolidating, but the chart shows signs of readiness to shift to a distribution phase, which could lead to a rally.
Against the backdrop of a falling dollar, which is continuing its main trend, the NZD may break out of consolidation in a distribution pattern. Since the accumulation is quite large (taking into account the long squeeze), the trend may be strong.
A pre-breakout consolidation is forming relative to 0.6080, followed by the price breaking through the resistance of the global trading range. Consolidation above 0.6080 will confirm the breakdown of the structure, which could trigger distribution
Resistance levels: 0.6080, 0.612
Support levels: 0.6062, 0.604
The price may be supported by a bullish trend and a decline in the dollar. A breakout from the 4-month consolidation may be accompanied by a continuation of the uptrend until the intermediate high of 0.6355 is reached in the medium term.
Best regards, R. Linda!

SOLANA → BINANCE:SOLUSDT.P is consolidating after breaking through trend resistance. The market trigger is 148.0, and Bitcoin is provoking the market to recover...
The market is buying back all the losses. SOL breaks the local downward resistance and forms consolidation with a trigger of 148.0. The market has come to life following the rallying Bitcoin. If the general trend continues, SOL may break out of the accumulation zone and form a distribution towards 154.0
The latest retest of resistance is provoking a correction. Before rising, the price may test the zone of interest at 144 or the lower boundary of consolidation at 142.2. The ideal scenario would be a false breakdown of support at 142.2 before rising.
Resistance levels: 148.0, 154.2
Support levels: 142.2, 137.5
Fundamentally, the situation for the crypto market is improving. Technically, the market is also showing positive dynamics. SOL is consolidating after growth, which is generally a positive sign. Now we need to wait for the price to break out of consolidation and continue its growth. One of the signs of this is a rebound from the 0.5 range and a quick retest of resistance with a gradual squeeze towards the trigger.
Best regards, R. Linda!

Euro will make correction to support line of channelHello traders, I want share with you my opinion about Euro. In this chart, we can see how the price entered to triangle, where it at once bounced from the support line and rose to the 1.1100 support level, which coincided with the buyer zone. Soon, price broke this level, after a small correction, and continued to move up to the 1.1575 current support level, which coincided with the support area. This area also coincided with the resistance line of the triangle, and the Euro rebounded from this line and started to decline. In a short time, it declined to the buyer zone, where it turned around and started to move up. Soon, Euro exited from triangle and continued to rise inside an upward channel, where it made a correction first and then continued to grow. Later, EUR rose to 1.1575 current support level, one more time and even almost broke it, but failed and corrected. But soon, it finally broke this level and rose to the resistance line of the channel, where at the moment it continues to trade near. In my mind, Euro will rebound from this line and go to the correction until to support line of the channel, breaking the support level. For this case, my TP is located near this line - at the 1.1490 points. Please share this idea with your friends and click Boost 🚀
Disclaimer: As part of ThinkMarkets’ Influencer Program, I am sponsored to share and publish their charts in my analysis.

US 500 Index – Uptrend Channels, Support and Resistance CluesPositive price activity continues to materialise within equity indices, with several over recent sessions, successfully posting new all-time high trades.
The US 500 index is no exception, with at the time of writing (7.30am Monday 30th June) a new upside extreme just posted at 6208, see chart below.
However, such moves into new all-time high ground, which effectively is uncharted territory, can offer a challenge to traders. There is obviously difficulty in assessing where next resistance levels might stand. Just because an uptrend price pattern is evident and new all-time highs are being posted, doesn’t guarantee further price strength.
There will be levels where sellers, or resistance, are found again that might create at least a short term sell-off in price, even a more extended phase of price weakness.
However, how perhaps might we be able to judge where these levels may stand, when an asset is trading at price levels previously not seen?
Within technical analysis there is a tool that can potentially help traders gauge where next resistance might be encountered – The Uptrend Channel.
Let’s take look at uptrend channels and the US 500 index, and where possible clues might be offered to where both support and resistance levels may currently stand.
The Uptrend Channel:
We have previously discussed uptrends (and downtrends) in previous reports, so please look at our timeline for further details.
However, the basic definition of an uptrend line, is a straight line connecting previous price lows. In the chart below, we look at the US 500 index and have drawn a straight line connecting the 5095 low, posted on April 21st, with 5913, the June 23rd low.
This uptrend line today (June 30th 2025) stands at 6000, and traders may now be viewing this as a potential support to price weakness, if seen. It’s held on 2 previous occasions, April 21st and June 23rd, and may do so again, if price weakness approaches this line in the future. Please note, this is a rising trendline, so the support level will move higher each day.
Now look at the chart above again, you’ll notice we have also now drawn a trendline parallel to the lower uptrend line, which connects with the 5958 May 16th price high. This line also moves higher each day, as it too represents an uptrend and today stands at 6527.
While much will continue to depend on future market sentiment and price trends, if (and as we know within trading, it is a big if!) prices continue to move higher and post new all-time price highs, traders may be watching this uptrend channel pattern to suggest both potential support and resistance price levels.
They may argue that while support, which today stands at 6000, marked by the level of the lower limits of the uptrend channel, remains intact, potential might be for a more extended phase of price strength. Possible resistance could then be 6527, the current level of the upper limits of the uptrend channel.
Please remember, these levels will change daily, and you will need to refer to your own Pepperstone charts to update these levels on a daily basis, as they will change for each sessions.
Looking Ahead:
Today marks the end of a volatile but impressive second quarter for the US 500 index. It saw a low of 4799 on Monday April 7th in the thick of the trading carnage caused by President Trump’s trade tariffs, but since the 90 day tariff pause was announced on April 9th the index has rallied steadily to register a new all time high at 6208 in Asia this morning. That’s a bounce of 29% in Q2!
The start of Q3 isn’t likely to be without its challenges, however. There are concerns that President Trump’s $4.5 trillion tax bill, that is moving through the Senate currently, could increase the US debt burden to unsustainable levels.
Also, the July 9th tariff deadline is getting closer by the day and only 1 trade deal has been announced during the 90 day pause, despite lots of talk that 10 more deals, including India, Japan and potentially the EU are in the pipeline.
Updates on the health of the US economy this week in the form of Non-farm Payrolls on Thursday (1330 BST) and ISM Services PMI (1500 BST) could be critical if markets expectations for Fed rate cuts later in the year are to materialise, and the next earnings season for US companies begins in the middle of next week as well.
How this all unfolds could help to determine whether the US 500 keeps recording new all time highs or begins to unwind the recent upside moves as risk sentiment sours again.
The material provided here has not been prepared accordance with legal requirements designed to promote the independence of investment research and as such is considered to be a marketing communication. Whilst it is not subject to any prohibition on dealing ahead of the dissemination of investment research, we will not seek to take any advantage before providing it to our clients.
Pepperstone doesn’t represent that the material provided here is accurate, current or complete, and therefore shouldn’t be relied upon as such. The information, whether from a third party or not, isn’t to be considered as a recommendation; or an offer to buy or sell; or the solicitation of an offer to buy or sell any security, financial product or instrument; or to participate in any particular trading strategy. It does not take into account readers’ financial situation or investment objectives. We advise any readers of this content to seek their own advice. Without the approval of Pepperstone, reproduction or redistribution of this information isn’t permitted.

Ethereum Leveling Map — ETH/USDT 1DNo directional bias for Ethereum, but will use levels to spot entries for intraday.
Right now located at POC and seems balanced for both sides.
Potential Adam&Eve setup in development.
Quality levels for support $2150, 2000, 1800, 1500.
Resistances $2700, 3000, 3500, 4000
Keep in mind it will follow BTC price action by most of time.
Happy trading

NATURAL GAS (NATGASUSD): Bullish Outlook Explained
Natural Gas is trading in a mid-term bullish trend on a daily.
The price updates higher highs and higher lows after each
test of a rising support line.
Its last test made the market form a strong rejection first
and a bullish engulfing candle then.
The market may continue growing and reach at least 3.7 resistance soon.
❤️Please, support my work with like, thank you!❤️

ALUMINIUM Futures at Best Support !!This is the 1 hour chart of Aluminium futures.
Aluminium is moving in well defined ascending parallel channel with Support at 245 level .
If this level is sustain , then we may see higher prices in the Aluminium Futures.
Thank you !!

TITAN ' s Key Point | Breakout | Swing.This is the 4 hour Chart of the TITAN COMPANY.
Titan has formed a Cup and Handle pattern and given a breakout .
Two possible scenarios:
If the breakout sustains with volume, the rally may continue.
If it retests the breakout level, it would offer a safer entry before the next leg up.
If this level is sustain then we may see higher prices in Titan.
