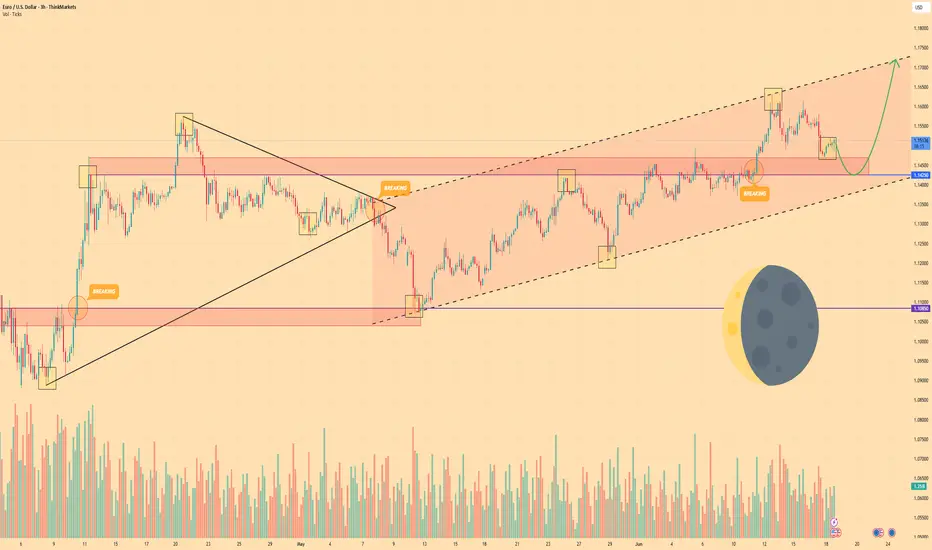
Euro can fall to support area and then rebound upHello traders, I want share with you my opinion about Euro. Observing this chart, we can see how the price, after a period of sideways trading, the price started to grow gradually and formed a consistent bullish structure. The trend was supported by regular bounces from the support line, confirming the bullish sentiment. At some point, price made a temporary drop below the support area, but this move was short-lived; bulls quickly stepped in, and the pair recovered. After that, EURUSD returned back into the channel and began forming higher highs and higher lows again, confirming the continuation of the trend. Right now, the price is declining slightly and approaching the support area again, which is located between 1.1455 and 1.1430. This zone has shown itself as a strong support during previous moves and is now being retested from above. Given the current structure and the upward channel in play, I expect the Euro to rebound from this support area and continue growing toward the 1.1580 points - that’s my current TP 1. Please share this idea with your friends and click Boost 🚀
Disclaimer: As part of ThinkMarkets’ Influencer Program, I am sponsored to share and publish their charts in my analysis.
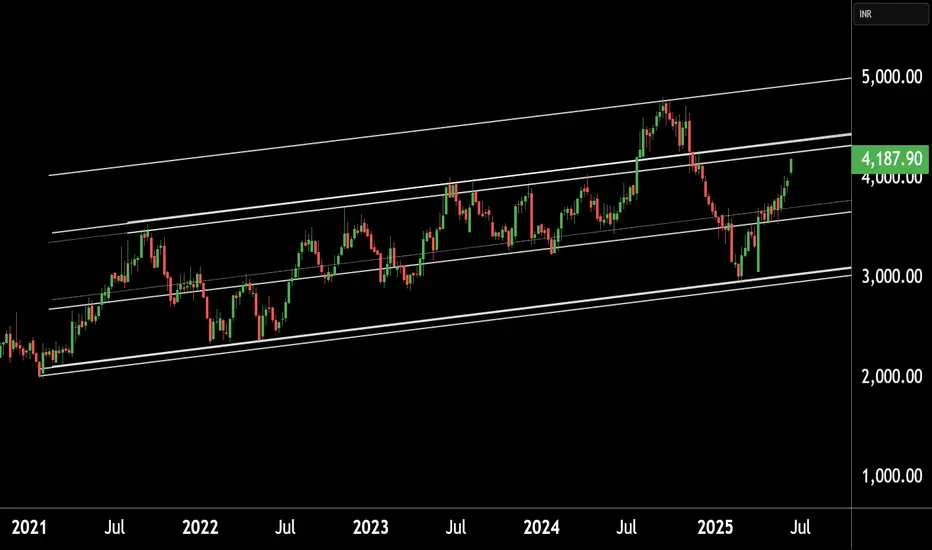
Parallel Channel

The GENIUS Act: A Historic Breakthrough in Stablecoin RegulationIn the fast-evolving world of cryptocurrencies, stablecoins have carved out a unique role, acting as a bridge between digital assets and traditional finance. Until recently, however, the regulatory framework for these instruments remained fragmented and unclear. The adoption of the GENIUS Act marks the first major step toward establishing a coherent regulatory system for stablecoins in the United States — an event already being hailed as a historic breakthrough.
What Is the GENIUS Act?
The GENIUS Act (short for "Guaranteeing Effective National Incorporation of Ubiquitous Stablecoins") is a legislative initiative designed to set clear rules for the issuance, backing, and circulation of stablecoins. Its primary goal is to ensure transparency, stability, and security for users, investors, and financial institutions engaging with these digital assets.
The bill has received bipartisan support, demonstrating a broad political consensus on the need to bring order and trust to the digital asset market.
Why Is It a Breakthrough?
Before the GENIUS Act, the legal status of stablecoins existed in a regulatory "gray area." Issuing companies often faced uncertainty: were they subject to banking laws, SEC oversight, or fintech regulations? This ambiguity led to high-profile lawsuits, account freezes, and declining institutional trust.
The GENIUS Act introduces:
A licensing framework for stablecoin issuers, requiring 100% reserves in fiat currency or secure liquid assets
Mandatory audit and reporting standards, including independent verification and public disclosures
Clear separation between fiat-backed and algorithmic stablecoins, acknowledging their different risk profiles
Mechanisms for coordination with the Federal Reserve, paving the way for stablecoin integration into the broader financial infrastructure
Impact on the Market
The passage of the GENIUS Act has already had a ripple effect. Major issuers like Circle (USDC) and Paxos have expressed their readiness to comply with the new standards. Meanwhile, less transparent players are beginning to lose market share.
Institutional investors — including banks and asset managers — are increasingly viewing stablecoins as a reliable instrument for payments and capital storage. This growing confidence could be the key to the mass adoption of Web3 apps, decentralized finance (DeFi), and digital commerce.
Global Significance
The GENIUS Act also sets a precedent for other countries. Just as the U.S. once led the way in traditional financial regulation, it is now establishing benchmarks for digital assets. The EU, UK, Singapore, and others are closely analyzing the bill’s elements for adoption in their own jurisdictions.
Conclusion
The passage of the GENIUS Act represents a historic step toward crypto market maturity. It not only eliminates regulatory uncertainty but also lays the groundwork for sustainable digital economic growth. For the first time, stablecoins have a clear, institutionally recognized legal status — marking the transition from chaotic innovation to structured trust.

Wedge Breakout in Motion – 317% Potential Toward Channel Up📍 Ticker: NASDAQ:ACB (Aurora Cannabis Inc.)
📆 Timeframe: 1D (Daily)
📉 Price: $4.71
📊 Volume: 1.22M
📈 RSI: 42.76 (rising from oversold territory)
🔍 Technical Setup:
After years of decline, NASDAQ:ACB has broken out of a large descending wedge, with price pushing above downtrend resistance and reclaiming horizontal support.
🔼 Breakout Structure: Descending wedge + horizontal base
📉 Bear market floor established at ~$3.00
📈 Next key level: ~$5.60, then $9.00+
💠 Price projection drawn within expanding ascending channel, targeting mid-to-upper range reversion over time.
🧠 Trade Plan & Price Targets:
✅ Entry Zone: $4.60–$4.80 (confirmed breakout, medium risk)
✅ Entry Zone: $3.60–$3.80 (full gap retest, lower risk)
✅ Entry Zone: $2.95–$3.10 (Lowest low, lowest risk)
❌ Stop-Loss: Close below $4.00 (failed retest + support invalidation)
❌ Stop-Loss 2: Close below $3.55 (Lower than the biggest gap low level)
❌ Stop-Loss 3: Close below $2.84 (Lower than the lowest low)
🎯 Target 1: $5.60
→ 📈 Return: +18.9%
🎯 Target 2: $9.00
→ 📈 Return: +91.0%
🎯 Target 3: $15.00
→ 📈 Return: +217.0%
⚠️ Key Insights:
RSI curling up from below 40 = momentum shift
Short interest remains high → potential short squeeze trigger
Price is now above long-term downtrend — trend reversal scenario in play
Macro sentiment toward cannabis may act as catalyst
Still haven't started the biggest US market
💬 Can Aurora Cannabis light up again and return to its long-term channel highs?
Follow for more setups with asymmetric risk/reward.
#TargetTraders #ACB #CannabisStocks #WedgeBreakout #ChannelReversion #PennyStockSetup

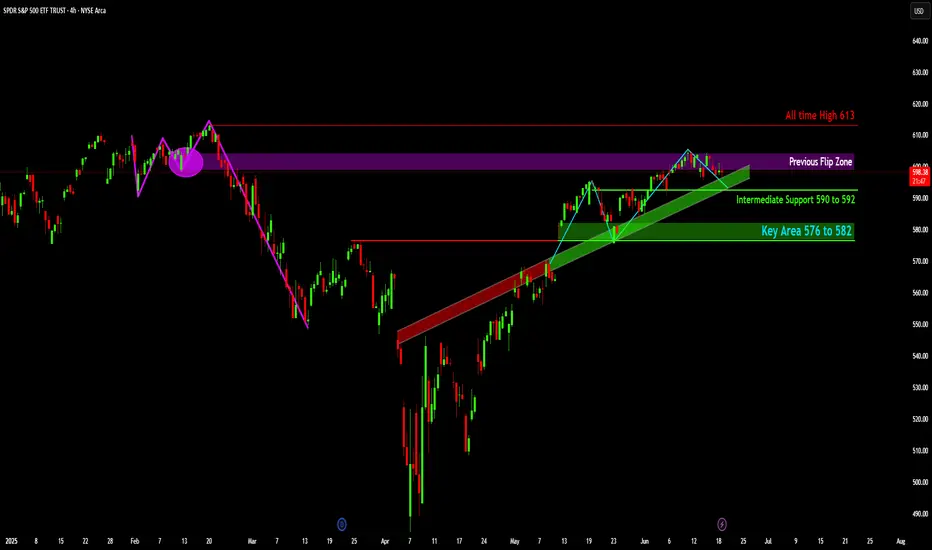
SPY: What's Next After the Resistance Retest?
The price action of SPY, shows a significant decline from early February highs, followed by a strong recovery and an established uptrend from mid-April.
Price is currently testing the "Previous Flip Zone" (indicated by the purple shaded area), a level that previously acted as support before the market's sharp decline and has since been retested as resistance.
The "All time High 613" is marked as a major overhead resistance level, representing the peak achieved before the February drawdown.
An "Intermediate Support" zone is identified between 590 and 592, coinciding with the upward-sloping green trendline that has supported the recent rally.
A "Key Area" of support is highlighted further down between 576 and 582, indicating a more substantial demand zone should the intermediate support be breached.
Disclaimer:
The information provided in this chart is for educational and informational purposes only and should not be considered as investment advice. Trading and investing involve substantial risk and are not suitable for every investor. You should carefully consider your financial situation and consult with a financial advisor before making any investment decisions. The creator of this chart does not guarantee any specific outcome or profit and is not responsible for any losses incurred as a result of using this information. Past performance is not indicative of future results. Use this information at your own risk. This chart has been created for my own improvement in Trading and Investment Analysis. Please do your own analysis before any investments.
CHFJPY - Bullish... but not for long!Hello TradingView Family / Fellow Traders. This is Richard, also known as theSignalyst.
📈CHFJPY has been overall bullish trading within the rising channel marked in blue. However, it is currently retesting the upper bound of the channel.
Moreover, the red zone is a strong structure and resistance.
🏹 Thus, the highlighted red circle is a strong area to look for sell setups as it is the intersection of the upper blue trendline and resistance.
📚 As per my trading style:
As #CHFJPY is around the red circle zone, I will be looking for bearish reversal setups (like a double top pattern, trendline break , and so on...)
📚 Always follow your trading plan regarding entry, risk management, and trade management.
Good luck!
All Strategies Are Good; If Managed Properly!
~Rich
Disclosure: I am part of Trade Nation's Influencer program and receive a monthly fee for using their TradingView charts in my analysis.

NZDCHF - The Bears Are Back!Hello TradingView Family / Fellow Traders. This is Richard, also known as theSignalyst.
📈NZDCHF has been overall bearish trading within the falling channel marked in red, and it is currently retesting the upper bound of the channel.
Moreover, the green zone is a strong resistance.
🏹 Thus, the highlighted red circle is a strong area to look for sell setups as it is the intersection of the upper red trendline and resistance.
📚 As per my trading style:
As #NZDCHF approaches the red circle zone, I will be looking for bearish reversal setups (like a double top pattern, trendline break , and so on...)
📚 Always follow your trading plan regarding entry, risk management, and trade management.
Good luck!
All Strategies Are Good; If Managed Properly!
~Rich
Disclosure: I am part of Trade Nation's Influencer program and receive a monthly fee for using their TradingView charts in my analysis.

EURUSD - Getting Over-Bought?Hello TradingView Family / Fellow Traders. This is Richard, also known as theSignalyst.
📈EURUSD has been overall bullish trading within the rising channels marked in red and blue. However, it is currently retesting the upper bound of the channels.
Moreover, the orange zone is a major daily high.
🏹 Thus, the highlighted red circle is a strong area to look for sell setups as it is the intersection of the upper blue/red trendlines and daily high.
📚 As per my trading style:
As #EURUSD approaches the red circle zone, I will be looking for bearish reversal setups (like a double top pattern, trendline break , and so on...)
📚 Always follow your trading plan regarding entry, risk management, and trade management.
Good luck!
All Strategies Are Good; If Managed Properly!
~Rich
Disclosure: I am part of Trade Nation's Influencer program and receive a monthly fee for using their TradingView charts in my analysis.

FANG: Bearish Trendline Rejection - Potential Short SetupAnalysis:
On the daily timeframe, FANG is clearly entrenched in a significant downtrend, characterized by a series of lower highs and lower lows. The current price action suggests a potential continuation of this bearish trajectory, as the stock is interacting with a critical resistance confluence.
1. Dominant Descending Trendline (Dynamic Resistance):
The Downward trendline has consistently acted as dynamic resistance, successfully capping price rallies multiple times (as indicated by the red circles). Each touch has been met with renewed selling pressure, confirming its validity as a significant bearish barrier.
2. Current Price Action at Trendline:
FANG is currently testing this critical descending trendline for what appears to be the fifth time. The price has pushed up into this resistance, and the recent candles suggest a struggle to break above it, hinting at a potential rejection. This interaction at such a well-established trendline is a high-probability setup for trend continuation.
3. Key Horizontal Levels:
Key Resistance Level $175 to $180: While not immediately in play, this overhead resistance zone further reinforces the broader bearish structure. A move towards this level would still face significant selling pressure from the trendline.
Key Support Level $135 to $140: This horizontal zone previously provided support and represents a logical downside target for the current bearish leg.
4. Potential Short Setup:
Based on the current rejection from the descending trendline, a short-selling opportunity appears to be unfolding:
* Entry: A clear rejection and a confirmed bearish candle from the trendline (around the current price of 150.50) would offer a suitable entry.
* Stop Loss: A tight stop-loss can be placed just above the recent swing high and the trendline, indicated by the tool at $158.63. This provides a defined risk and protects against a false breakout.
* Target: The primary downside target is the Key Support Level $135 to 140.
Invalidation & Risk Management:
The bearish thesis would be invalidated if FANG decisively breaks above the descending trendline and sustains a daily close above the $160 level with strong volume. Such a move would suggest a potential shift in the trend and would warrant re-evaluation of the bearish outlook. Traders should always adhere to their risk management plan.
Conclusion:
Given the established downtrend and the current rejection from a highly validated descending trendline, FANG appears poised for a continuation of its bearish momentum. The setup offers a clear entry, stop, and target, aligning with the dominant market structure.
Disclaimer:
The information provided in this chart is for educational and informational purposes only and should not be considered as investment advice. Trading and investing involve substantial risk and are not suitable for every investor. You should carefully consider your financial situation and consult with a financial advisor before making any investment decisions. The creator of this chart does not guarantee any specific outcome or profit and is not responsible for any losses incurred as a result of using this information. Past performance is not indicative of future results. Use this information at your own risk. This chart has been created for my own improvement in Trading and Investment Analysis. Please do your own analysis before any investments.

EURO - Price can correct to support area and then continue riseHi guys, this is my overview for EURUSD, feel free to check it and write your feedback in comments👊
Some days ago, price declined below support level and then started to grow inside a triangle pattern.
In this pattern, Euro broke $1.1085 level and even rose higher than $1.1425 level, but soon made a correction.
Later price exited from triangle and fell to support level, after which it started to grow inside rising channel.
Inside channel, price rose near support line and later reached $1.1425 level one more time, and some time traded close.
Soon, Euro broke this level and rose to resistance line of channel and then started to move down.
In my opinion, EUR can fall to support area and then continue to grow in channel to $1.1720 resistance line.
If this post is useful to you, you can support me with like/boost and advice in comments❤️
Disclaimer: As part of ThinkMarkets’ Influencer Program, I am sponsored to share and publish their charts in my analysis.
USDCAD Breakout from Parallel Channel | Bullish Move Ahead?USD/CAD has just broken out of a well-respected downward parallel channel, signaling a potential trend reversal. We saw a strong bullish impulse that pushed price above the channel resistance and now appears to be consolidating just above it.
🔍 What to Watch For:
Pullback Opportunity: Price may retest the breakout zone (~1.3640–1.3660). This zone could act as new support, providing a good entry point for buyers.
Upside Target: The next major resistance sits near 1.38542, offering a potential move of over 180+ pips from current levels.
Momentum: Bullish momentum is strong, suggesting a high probability of continuation after a healthy pullback.
📈 Bullish Bias remains intact as long as price holds above the breakout zone.
📉 If price drops back inside the channel, reevaluation of the bullish outlook will be needed.
🔔 Trade Idea: Look for long opportunities on a successful retest with confirmation (bullish candlestick or volume surge).
💬 What are your thoughts on this breakout? Are you long on USD/CAD or waiting for confirmation? Let me know in the comments! 👇

GOLD → Consolidation. Awaiting the FOMC meetingFX:XAUUSD is consolidating in the range of 3403 - 3373. The problem is that there is news ahead. FOMC and interest rate meeting. The market may react in any unpredictable way...
On Wednesday, the price of gold retreated from $3,400 as sentiment stabilized and investors focused on the upcoming Fed decision. Tensions in the Middle East remain high, but there is less panic in the markets. The Fed is expected to leave rates unchanged. The focus is on forecasts for rates, growth, and inflation. Dovish signals could support gold and weaken the dollar. If the Fed is more cautious due to oil and the conflict in the Middle East, the dollar could rise and gold could fall.
Technical nuances are irrelevant in this case, as price behavior depends on the market's interpretation of fundamental factors.
Resistance levels: 3403, 3420
Support levels: 3373, 3339
BUT! Technically, I would say that there is pressure from the bears. The price is compressing towards the support level of 3373.
The market remains unbalanced in favor of buyers, and it is logical that market makers will be interested in testing the trend support zone or the 3339 level (due to the liquidity pool) before continuing to rise (gold may continue to rise both if rates are lowered and if they remain at the same level. However, the tone of the Fed will play a major role here)
Best regards, R. Linda!

EURUSD Has breakout the ascending channel bullish strong now EURUSD Breakout Alert!
EURUSD has broken out of the descending channel with strong bullish momentum from the key support level at 1.15100.
📈 Technical Outlook (4H Time Frame):
🔹 Key Support: 1.15100 (confirmed bounce)
🔹 1st Resistance Target: 1.16300
🔹 Bullish Order Block: 1.12900 – strong demand zone below
This breakout signals potential continuation to the upside. Stay tuned as price action develops! 🔥
📌 Like, Follow, Comment & Join us for more real-time updates!
Trade smart, stay informed 😜
— Posted by Livia

GOLD → Bear pressure. Area of interest: 3340–3306FX:XAUUSD continues to decline under pressure from sell-offs. However, the situation is interesting overall, as there is conflicting data and unexpected price behavior is surprising the market...
On Tuesday, gold is trying to regain the $3,400 level after pulling back from highs, but it is still facing selling pressure and returning to $3,377. The market reaction to the $3,377 level is quite weak, and if the price starts to stick to support, this will lead to a further decline. The dollar is strengthening as a safe-haven currency, holding back gold's growth. The markets are focused on the outcome of the Fed and Bank of Japan meetings, as well as US retail sales data. Any dovish signals from the Fed could support gold and weaken the dollar.
Technically, on D1, gold is returning below the 3382 level (selling zone) and testing 3377. The reaction to the false breakout of support is weak, and the price is forming a pre-breakdown consolidation relative to 3377. There are clear areas of interest that could lure the price before the news. For example, 3343, 3306, 3245.
Resistance levels: 3382, 3403.
Support levels: 3377, 3339, 3320
The bearish structure will be broken if the price strengthens to 3403 and consolidates above that level. This will reinforce buyers' expectations, which could lead to growth. At the moment, I would expect two scenarios: price consolidation within 3377-3403. But technically, the chart shows that there is bearish pressure in the market. The price continues to storm the support level of 3377, which may not hold up against another retest. A break 3377 could lead to a fall to the areas of interest at 3339-3306.
Best regards, R. Linda!

Wait for the NAS100 to break the parallel lines before shortingPEPPERSTONE:NAS100 - Need the price on the 1H TF to break down the parallel lines before taking any short position. After than we could see the index going to 21,450. But till then hold your shorts.

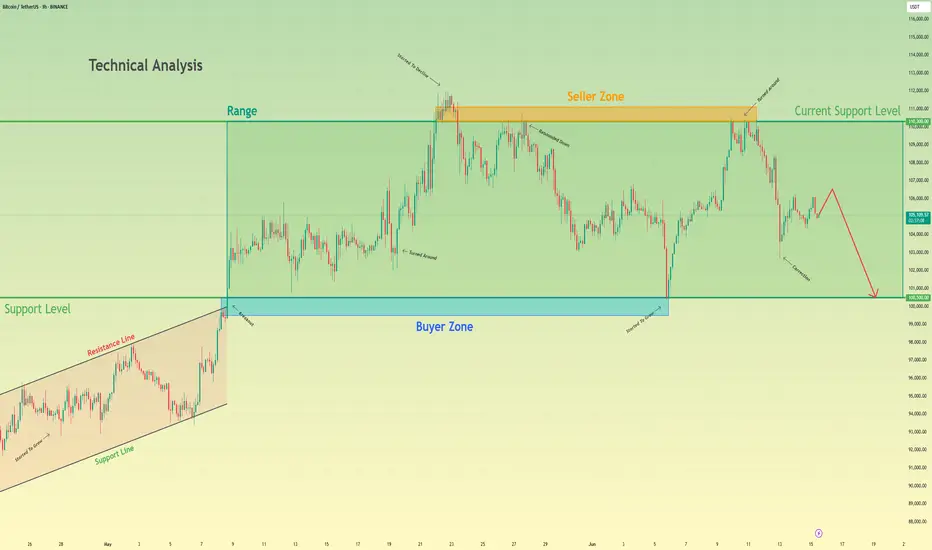
Bitcoin will make a small upward move and then continue to fallHello traders, I want share with you my opinion about Bitcoin. Earlier, the price was confidently growing inside an Upward Wedge, showing a series of higher highs and higher lows. This rising structure was supported by consistent momentum until BTC reached the seller zone between 110300 and 111100, where the growth slowed down and started to fade. From there, the price rejected this resistance and shifted into a Range, bounded by 100500 and 110300. BTC has been fluctuating inside this horizontal structure for some time, unable to break above the seller zone or below the buyer support. Now BTC is showing signs of weakness, forming a minor correction and struggling to reclaim previous highs. Given this structure and rejection from the seller zone, I expect BTC to make a small upward move and then start a decline toward the support level at 100500, which also coincides with the bottom of the range and acts as a strong psychological level. For this reason, I set my TP at 100500 points. Please share this idea with your friends and click Boost 🚀
HelenP. I Bitcoin will continue to move up inside triangleHi folks today I'm prepared for you Bitcoin analytics. After rebounding from the support level, the price initially showed strength and moved upward. However, the bullish momentum was short-lived, and the price began a downward correction, forming a well-defined descending channel. During this decline, the price dropped below the support zone, confirming short-term bearish dominance. Despite this breakdown, bulls regained control, and the price started forming a series of higher lows, resulting in the development of a symmetrical triangle. This structure signals compression and potential preparation for a breakout. The current price action confirms that BTC is now recovering within this triangle, supported by the upward trend line drawn from the recent lows. Given the strength of this recovery and the stabilization above the support zone, I expect the price to make a small correction and then continue climbing toward the resistance level at 110000. That’s why my current goal remains focused on this level, representing both a psychological and technical barrier aligned with previous local highs. If you like my analytics you may support me with your like/comment ❤️
Disclaimer: As part of ThinkMarkets’ Influencer Program, I am sponsored to share and publish their charts in my analysis.

SHORT ON EUR/JPYEJ has created a (Rising Channel) with a (Double Top) at a major resistance zone.
Both Chart Patterns are Bearish Reversal Patterns.
I will be Selling EJ to the next demand level as it seeks out liquidity to the downside for 100-200 pips.
USDJPY Descending channel breakout ahead bullish strongFX:USDJPY Breakout Alert – Bullish Momentum on 4H Chart 💥
The pair has broken out of the descending channel with strong bullish confirmation. Price action is showing solid momentum and market structure shift.
🟢 Entry Level: 144.700
📍 Technical Targets:
1st Target: 146.000 (Key Supply Zone)
2nd Target: 148.500 (Major Resistance)
🔴 Stop Loss: 143.000 (Demand Zone)
📊 This setup is based on the 4H time frame, offering a favorable risk-reward ratio for swing traders.
💬 Like, follow, and drop a comment if you’re riding this move!
💎 Join us for more updates, signals & insights.
Let’s trade smart, not hard. 😜
#USDJPY #ForexSignals #BreakoutTrade #TechnicalAnalysis #ForexTrading #LiviaTrades

Wedge Pattern – Simple Explanation
📚 Wedge Pattern – Simple Explanation
A wedge pattern is a shape on the chart that looks like a triangle or cone. It tells us that the price is getting ready to break out — either up or down.
---
🔻 Falling Wedge (Bullish)
Looks like price is going down, but slowly.
Lines move closer together.
Usually means the price will go up soon.
It's a bullish signal (good for buying).
---
🔺 Rising Wedge (Bearish)
Price goes up, but losing strength.
Lines get closer together.
Usually means the price will go down soon.
It's a bearish signal (good for selling).
---
💡 Easy Tips:
Wait for breakout (big move out of the wedge).
Use a stop-loss below/above the pattern.
Target = height of the wedge.
---
📌 In Short:
Wedge = Squeeze pattern.
Falling wedge = Buy chance.
Rising wedge = Sell chance.
---
Let me know if you have sny doubt in comments

PI INDUSTRIES LTD at Key Resistance !!This is the Weekly chart of PI INDUSTRIES LTD.
PIIND having good law of polarity at 4300-4400 range.
If this level is sustain , then we may see lower prices in PIIND.
Thank You !!
BITCOIN → Buyback bar. Chance of growth to 108,000BINANCE:BTCUSDT is trading in a fairly wide range of 100,600 - 110,400. The market is stagnating due to fundamental uncertainty, but the risks of a decline are quite high...
After the escalation of the conflict in the Middle East, Bitcoin broke the bullish structure on the market and managed to test the local level of 102500, from where a fairly aggressive phase of buying out the fall began within one trading session. The market is defending the structure quite aggressively. The chart shows a local range forming with strong levels at 102500 and 106200. Accordingly, the price may remain in this range for a long time (in which case an intraday trading strategy can be considered). However, if Bitcoin starts to stick to one of the boundaries, then we can consider the price leaving the range, but based on the structure of the uptrend, correction, and the formation of a buyback bar, it would be logical to see an attempt to break through resistance with the aim of continuing growth.
Resistance levels: 106200, 108200, 110400
Support levels: 102500, 100600
On D1, there are no prerequisites for a strong decline. The market is buying up knives and trying to stay afloat (in consolidation). In the medium term, there may be an attempt to retest 102500 - 100600 due to the liquidity pool. But locally, the market may form an attempt to grow to 108200
Best regards, R. Linda!

NZDUSD → Correction and liquidity capture ahead of growthFX:NZDUSD , following a sharp decline during the Pacific-Asian session, is testing the support of the upward trend and the liquidity zone...
The dollar is correcting amid escalating tensions in the Middle East. This is a temporary move, and the market may return to its main trend. The currency pair is forming a false breakdown of support
Against the backdrop of an uptrend and a weak dollar, the currency pair is testing support at 0.6000. The reaction is weak at the moment, but there is a chance for growth if the price consolidates above 0.6020. I do not rule out a retest of the liquidity zone at 0.5989 before growth
Support levels: 0.6000, 0.5989
Resistance levels: 0.6068
The inability to continue falling and the formation of a local reversal structure relative to 0.6000 (price consolidation above 0.6020) may support the market. I do not rule out that the market may decline to the liquidity zone of 0.5989 before rising.
Best regards, R. Linda!

BTC is Bullish!Hello TradingView Family / Fellow Traders. This is Richard, also known as theSignalyst.
📈BTC has been overall bullish trading within the rising channel marked in blue.
Moreover, the red zone is a strong structure!
🏹 Thus, the highlighted blue circle is a strong area to look for buy setups as it is the intersection of structure and lower blue trendline acting as a non-horizontal support.
📚 As per my trading style:
As #BTC approaches the blue circle zone, I will be looking for bullish reversal setups (like a double bottom pattern, trendline break , and so on...)
📚 Always follow your trading plan regarding entry, risk management, and trade management.
Good luck!
All Strategies Are Good; If Managed Properly!
~Rich
