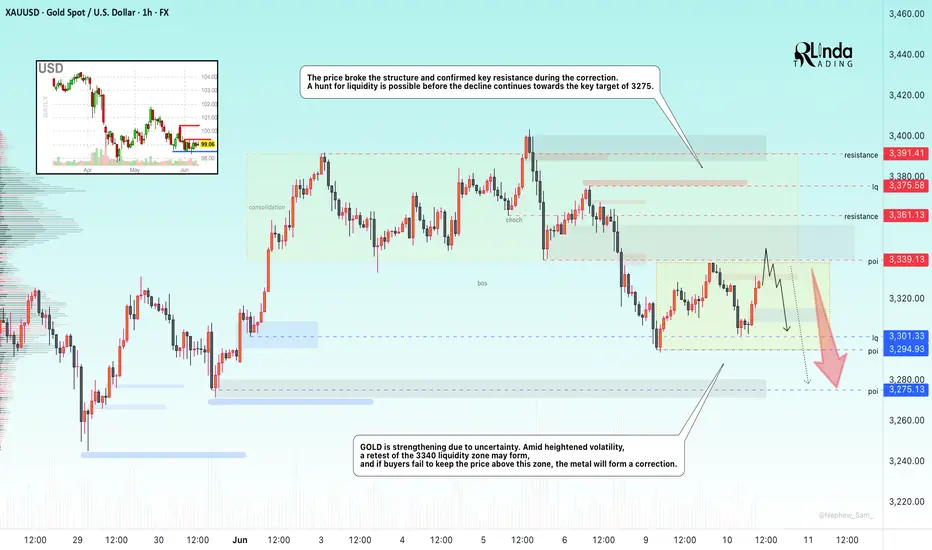
GOLD → Hunt for liquidity ahead of continued correctionFX:XAUUSD is strengthening due to uncertainty while the dollar consolidates. Amid heightened volatility, a retest of the 3340 liquidity zone may form, and if buyers fail to keep the price above this zone, gold may form a correction
Demand for the dollar is supported by the rise in USD/JPY after soft comments on interest rates by Bank of Japan Governor Ueda. Gold is responding with a correction. Traders remain cautious ahead of the outcome of the second day of trade talks between the US and China in London. Donald Trump confirmed that dialogue with Beijing is continuing, but key differences remain. Investors are also awaiting US inflation data (CPI), which could determine the further dynamics of the dollar and gold. Meanwhile, inflation expectations in the US fell from 3.6% to 3.2% in May.
Technically, gold broke the structure and confirmed key resistance during the correction. A hunt for liquidity is possible before the decline continues towards the key target of 3275.
Resistance levels: 3340, 3361
Support levels: 3301, 3275
The price is forming a new trading range of 3340 - 3301 (3294). Before declining, especially if the fundamental background changes to positive as negotiations progress, gold may test the liquidity zone of 3340 and form a false breakout, which will trigger a continuation of the correction to 3275.
Best regards, R. Linda!
Parallel Channel
GOLD → Correction before a decline or continuation of the trend?FX:XAUUSD is testing the liquidity zone during the Asian session and forming a false breakout. The metal is recovering, but the fundamental background remains unstable...
On Monday, gold is holding steady at around $3,300 amid a weaker dollar and caution among traders ahead of US-China talks and the release of US inflation data (CPI) on Wednesday. Strong NFP data for May strengthened the dollar and lowered expectations for a Fed rate cut. However, domestic problems in the US are putting pressure on the currency... Markets are adjusting positions ahead of CPI. Geopolitics and domestic unrest in the US are holding back gold's decline, despite possible optimism about a trade deal.
Technically, the trend is bullish, with the price previously breaking the structure but rising in the Asian session after a false breakdown of the order block and the 3300 liquidity zone. Further movement depends on 3330 - 3340
Resistance levels: 33301, 3339, 3375
Support levels: 3301, 3275
The price is heading towards 3330-3340 for a retest. If the dollar continues to decline and gold manages to consolidate above 3340, the bullish trend may continue. BUT! A false breakout of the 3330-3340 zone could trigger a further decline after the bullish structure breaks down.
Best regards, R. Linda!

$TEM to $100Target $100 this summer. Price is breaking out with a nice volume. $72 level is the main level to watch. Once we clear $72, $100 range is doable

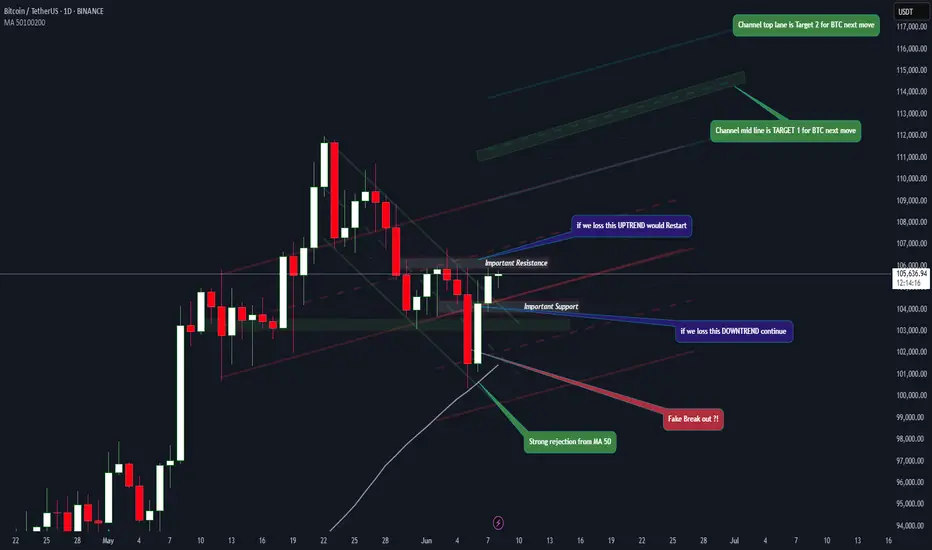
Bitcoin Wave Analysis – 9 June 2025
- Bitcoin broke daily down channel
- Likely to rise to resistance level 110,000.00
Bitcoin cryptocurrency recently broke the resistance trendline of the daily down channel from May (which encloses the previous ABC correction 2 from the end of May).
The breakout of this down channel accelerated the active minor impulse wave 3 of the intermediate impulse wave (3) from the start of April.
Given the clear daily uptrend, Bitcoin cryptocurrency can be expected to rise to the next resistance level 110000.00 (which reversed the price in January and May) – the breakout of which can lead to further gains toward 115000.00.

"GBP/USD is cooking inside a trianglePair: GBP/USD
Timeframe: 4H
Strategy: Elliott Wave + Triangle Pattern + Breakout
Formation: Contracting Triangle – Wave 1 to 5
Risk-Reward: High Probability Setup
Status: Pre-breakout phase
🔍 Technical Breakdown:
A clean contracting triangle is forming, completing all 5 internal waves within the structure.
Wave 5 looks exhausted and price is rejecting trendline resistance.
Expecting a bearish breakout from the triangle.
Target zone = 1.34759, aligning with previous liquidity + measured move.
Entry area refined with supply zone + minor structure break (as seen in inset schematic).
🎯 Target: 1.34759
🛑 Stop Loss: Above triangle resistance
🟢 Entry Trigger: After breakout + retest or SMC confirmation
This setup matches Elliott Wave’s triangle structure behavior – typically occurring before the final push in a larger correction or continuation.

AUDJPY: Consolidation is Over!🇦🇺🇯🇵
AUDJPY is completed a consolidation, violating
a resistance of a horizontal range on a daily.
The price will most likely continue rising and reach 95.0 level soon.
❤️Please, support my work with like, thank you!❤️

BTC on the riseThere is no correction at this point; BTC wants to go higher. The next resistance lies around 109k.

Is WLDUSDT Preparing for a Nasty Reversal?Yello, Paradisers! Have you been watching WLDUSDT creeping upward inside that nice channel and thinking this is a breakout in the making? Be careful. This setup might be laying a trap for overconfident bulls—and the signs are getting louder.
💎WLDUSDT is currently trading within an ascending channel, a structure that often signals weakening bullish momentum. The price is approaching a key resistance area, and what makes this zone even more dangerous is the confluence of bearish indicators stacked right on top of each other. We have the 200 EMA acting as dynamic resistance, the 0.618 Fibonacci retracement level overlapping perfectly, and a visible I-FVG (4H) in the same zone. This trio of signals significantly increases the probability of a strong bearish reaction.
💎If the price reacts from this resistance zone, performs an inducement move, and forms a clean bearish structure, we could be looking at a high-probability short opportunity. This would offer a solid risk-to-reward setup for those who are prepared and disciplined enough to wait for confirmation.
💎However, if the price breaks above the resistance and closes a full candle above it, then this bearish thesis will be completely invalidated. In such a scenario, it’s smarter to step back and wait for a clearer, more favorable structure to form. Chasing trades here would only increase the risk of getting caught on the wrong side of a fakeout.
🎖Discipline always wins in the long run, Paradisers. The market rewards those who wait for clean, high-probability setups — not those who trade based on FOMO. If you want to build long-term profitability, you must stay strategic, patient, and act only when everything aligns.
MyCryptoParadise
iFeel the success🌴

TSLA – Are You Buying Cheap or Buying Expensive?Tesla (TSLA) continues to trade within a long-standing macro range, well-defined by two behavioral zones:
🟩 Value Zone – Accumulation ($132 to $270.50):
This is where smart money tends to accumulate over time. Historically, moves from this zone lead to long-term rallies. Price spent multiple weeks here during major drawdowns — offering long-term entries at discounted value.
🟥 Premium Zone – Profit Taking ($270.50 to $409):
Above the midpoint ($270.50), price enters what can be considered the “expensive” territory. Historically, this area has acted as a supply zone, with frequent distribution and sharp reversals.
TSLA is currently sitting just above the midpoint, testing that equilibrium. Whether it consolidates for another leg higher or fails here could define the next swing move.
So ask yourself:
Are you buying value, or chasing premium?

NZDJPY: Move Up Ahead! 🇳🇿🇯🇵
There is a high chance that NZDJPY will continue rising.
I see a strong intraday bullish confirmation after a confirmed
breakout of a key daily horizontal resistance.
Next key resistance is 0.875
❤️Please, support my work with like, thank you!❤️
I am part of Trade Nation's Influencer program and receive a monthly fee for using their TradingView charts in my analysis.

TSLA: Uptrend channel bounce, trading between 50 and 200-day SMAHey guys/gals!
So we all know that Tesla took a massive drop last week. It fell about 14%, and was down even 3% after hours at one point. I think we can all agree this crash wasn't technicals driven - it was clearly headline impacted. This was a clear black swan even t, and even in my case, nothing like this has ever happened to me as a trader. It was unforeseeable, forced me to hedge overnight and I'm still having nightmares (lol). Definitely one to remember as I don't think something like this would happen with any other stock. Tesla is truly unique in this sense.
But looking at the bigger picture, the bounce that we experienced on Friday must've been technicals driven, and psychologically influenced, as I am almost certain that the crash was a massive overreaction. People woke up the next day and thought this was severely discounted over a couple social media tweets (I won't go into the politics of things).
As you see on the chart, Tesla may in a new upward channel. At first I figured this may be a bear flag, however due to the upcoming catalyst like the Robotaxi launch - this would likely only be a bear flag if prices crashes below the lower support trend line.
As long as price is within the channel, I'd say things are holding up. We'd likely see a jump towards the upper side of the channel - however it's important to note that $300 and £360 are major resistance points. Robotaxi launch and any future tweets will definitely move price, and I think those will be a factor in determining whether price goes up or crashes below the trend line.
Another thing to point out is that price is currently trading between the 50-day and 200-day moving averages. The 50-day SMA is acting as vital support, whereas the 200-day SMA is the resistance. If there is a break above the 200-day SMA, price will likely go higher. The opposite may happen if price crashes below the 50-day SMA.
Either way, headlines and technicals mentioned above will continue to influence price.
Note: not financial advice.

Crypto Total Market Cap – Bulls vs. Walls
🧪 1. 🐸 Miracle’s Take – The Meme Prophet Speaks!
“Wassup degenz! It’s ya boi Miracle again – and this chart’s juicier than a frog smoothie!”
Market just kissed the MA50 like it’s a long-lost love 💋… and BOOM — bounced back hard!
We’re climbing outta the bear channel like a true meme-warrior escaping rug hell 🧱
BUT... the resistance zone ahead (3.27T–3.32T) is like a fat whale sitting on top of the market 💀
A breakout above that and we go party at 3.48T, where the liquidity gods live 🎯
If we get slapped down though… Miracle sees a revisit to 3.2T support, where apes gather before launch 🦍
🔋 Momentum is here, but no confirmed breakout YET!
📢 Miracle’s Warning: “A trendline breakout without meme energy is just hopium with candles!”
💡 Miracle Watchlist:
✅ Break + Retest of resistance zone = GO LONG
❌ Rejection = scalp short back to MA
🔍 2. Unknown Analyst View – Clean & Technical
MA50 acted as a dynamic support and initiated a bounce.
Price is trying to break out of a descending channel, which has acted as a structure since late May.
Immediate resistance lies in the 3.27T–3.32T zone, which previously caused multiple rejections.
A confirmed breakout with volume and a successful retest of the resistance zone or MA50 could push us toward:
🎯 Target 1: 3.35T
🎯 Target 2: 3.48T (horizontal key resistance)
If rejected, we could slide back to the 3.20T support (yellow line) or even back into the bearish channel.
The market’s response to this zone will define the short-term trend.
"Observe the structure. Let price prove direction."
🎭 Two Faces. One Chart.
Who do YOU trust more today?
The meme-warrior 🐸 or the mystery tactician 🧠?
💬 Tell us in comments: #TeamMiracle or #TeamUnknown?
🎬 TradeWithMky – where altcoins speak louder than Bitcoin!
#CryptoCap #TotalMarketCap #AltseasonComing #TradeWithMky #CryptoAnalysis

TradeWithMky — Where Altcoins Speak Louder Than Bitcoin!Welcome, fellow trader, to TradeWithMky — the only TradingView realm where charts are alive, trendlines whisper secrets, and candles burn with prophecy.
Led by Miracle, the pepe-faced meme wizard of TA, we don’t just follow the market — we ride it like a shooting star across the altcoin galaxy 🚀.
💡 Here’s what you’ll unlock inside this spellbook of price action:
🌀 Magic Channels & Trend Spells
🔄 MA50 Rejections & Support Summons
📉 Fakeouts Exposed, Traps Uncovered
📈 Breakouts Blessed by Fibonacci Spirits
🧠 Deep-dive TA with a twist of humor, mystery, and meme-lore
From the shadows of fake breakouts to the light of uptrend awakenings, our charts tell stories — and you are the hero. Whether you're a seasoned wizard or a humble apprentice, here you’ll find something rare:
Real analysis. Real magic. Real fun.
🎯 Targets that work. Levels that matter. A vibe you won’t forget.
👉 Follow now and let Miracle show you why:
@TradeWithMky – Where Altcoins Speak Louder Than Bitcoin!

Bitcoin will continue to fall to support level in channelHello traders, I want share with you my opinion about Bitcoin. This chart shows how the price rebounded from the support line and started to grow. In a short time, it rose to the support level, which coincided with the buyer zone, and it even soon broke this level. Next, the price rose a little and then continued to move up, but later corrected the support line. After this, BTC rebounded and rose to the seller zone, breaking the 108800 resistance level. Then it rose a little more and turned around, and started to decline inside the downward channel. In the channel, price soon broke the 108800 level and continued to fall next. Later, Bitcoin broke the support line and fell almost to the support line of the channel, after which it turned around and made an upward movement. After this movement, Bitcoin dropped to the 100300 support level, after which it turned around and, in a short time, rose to almost the resistance line of the channel. Price didn't reach this line, turned around, and continued to fall in the channel. In my mind, Bitcoin can continue to move down top support level inside the downward channel. That's why my TP is 100300 level. Please share this idea with your friends and click Boost 🚀

GOLD (XAUUSD): Important Supports & Resistances for Next Week
Here is my latest structure analysis for Gold.
Vertical Structures
Vertical Support 1: Falling trend line
Vertical Support 2: Falling trend line
Horizontal Structures
Horizontal Support 1: 3231 - 3286 area
Horizontal Support 2: 3121 - 3177 area
Horizontal Resistance 1: 3372 - 3404 area
Horizontal Resistance 2: 3427 - 3423 area
Horizontal Resistance 3: 3492 - 3500 area
Consider these structures for pullback/breakout trading.
❤️Please, support my work with like, thank you!❤️
I am part of Trade Nation's Influencer program and receive a monthly fee for using their TradingView charts in my analysis.

DLF - Towards 580 - Triple top BreakdownDLF has shown Triple top breakdown and with this it will have following targets
Target1: 655
Target2: 580

BTC Short Setup! OB + Fair Value Gap + Trend Channel ConfluenceBitcoin (BTCUSD) | 30-Min Chart – High Probability Sell Setup
Bitcoin continues to respect bearish structure inside a descending trend channel, creating prime opportunities for Smart Money traders to strike at optimal levels.
🔍 Trade Breakdown:
Bearish Market Structure
Price is forming lower highs and lower lows
Channel structure is being respected with multiple taps on both the upper and lower bounds
Liquidity Sweeps & Internal Range
Multiple yellow-highlighted zones show liquidity engineering — both buy-side and sell-side have been swept
Recent sweep + demand failure confirms bearish intent
Premium Entry Zone Setup:
🔴 Order Block Zone (OB): 105,200 – 105,400
🟣 Fair Value Gap (FVG): Overlapping with OB – perfect imbalance correction
📐 Fib Levels:
61.8% = 104,987
70.5% = 105,298
79% = 105,388
🔺 This is the kill zone — premium retracement + inefficiency fill = high confluence
Bearish Continuation Expectation:
BTC likely to react at OB zone and continue bearish leg
Projection into discount fib levels:
-27% = 104,000
-62% = 103,800
-100% = 103,727
Channel Respect = Structure Confidence:
Every key swing is aligning with channel resistance/support
Blue arrow shows expected path: liquidity sweep ➝ OB/FVG tap ➝ drop to channel low
🧠 Chart Ninja Entry Plan:
🔹 Entry Zone 105,280 – 105,388 (OB + FVG + 70.5–79% Fib)
🔻 SL Above 105,400 (above OB)
📉 Target 103,727 (channel + -100% Fib extension)
⚖️ RRR Over 1:4 — sniper-grade RR setup
💬 Ninja Wisdom:
You're not chasing moves — you're waiting where liquidity pools.
Fair Value Gaps + OB + Trend Channels = institutional signature.
Trade like Smart Money. Let retail chase candles. 🥷💸
📍 Save this setup before the market plays out
🔁 Share your thoughts below – entry, TP, SL?
👣 Follow @ChartNinjas88 for more sniper BTC setups daily

DOGEUSDT major daily support ahead wait for pumpAs we can see price is near major daily support of 0.17$ and also previous time price was not able to break this channel resistance zone and started to see correction again and again but soon the channel upper side will break and price will manage to pump above 0.3$ and even 0.5$.
DISCLAIMER: ((trade based on your own decision))
<<press like👍 if you enjoy💚

BITCOIN → Correction. The hunt for liquidity...BINANCE:BTCUSDT.P is recovering after liquidity was captured in the 100K zone. Locally, the technical situation is controversial despite the global bullish trend
Bitcoin is changing its market character (106700) and breaking the bullish structure (103000) during a correction phase. As part of the downward momentum, the movement is testing liquidity below the 100700 support level. As for the liquidation, there are several reasons: the conflict between Trump and Musk, strangely enough, the market reacted with a fall; the liquidation of whales, history repeats itself...
Traders are buying back Bitcoin, but technically the market has a bearish structure. Locally, there is a bearish trend, and a countertrend correction, “liquidity hunting,” is forming.
Ahead lies a fairly important zone of 105900-106700. The initial retest may end in a false breakout, as there may not be enough potential for continued growth (after a strong buyback).
Resistance levels: 105,900, 106,720, 110,400
Support levels: 103000, 101400, 100K
After a correction from 105900, which could target half (0.5) of the trading range, the market may attempt to return to a bullish phase, provided that the bulls keep the price from falling and do not allow it to update local lows. That is, in the short term, I expect a decline from 105900 to 103000, but further, if the price starts to return to 105500-105900, there may be chances for growth to 110K
Best regards, R. Linda!

JINDAL STAINLESS Breaks the Channel – What’s Next?After completing a long WXY correction, Jindal Stainless has flipped into a strong uptrend. The price broke above the downtrend channel and also reclaimed the 200-day moving average — confirming strength.
The rally from 504 has unfolded as a nested 1-2, 1-2 impulse, and the wave 5 has now entered its 1 to 1.618 projection zone. We’re likely entering a blue Wave 4 pullback, especially as:
RSI shows bearish divergence
The rally looks stretched short-term
A healthy retracement toward the 661–640 zone can follow.
As long as 633.35 holds, this bullish structure remains intact.
Trend : Bullish
Retracement zone : 661.80 – 640.65
Invalidation : Below 633.35
This is a dynamic setup. Chart will be updated as price action unfolds
Disclaimer: This analysis is for educational purposes only and does not constitute investment advice. Please do your own research (DYOR) before making any trading decisions.

Ripple Analysis - What Shall we Expect !!!If the price can break through this channel's resistance, I expect it to reach $2.5 in a short time.
Stay Awesome , CobraVanguard

Euro will correct a little and then continue to move up nextHello traders, I want share with you my opinion about Euro. Observing this chart, we can see how the price entered to upward channel, where it at once dropped from the resistance line to the support line and then started to grow. In a short time price rose to the 1.1210 level, broke it, and even rose a little more, but soon turned around and declined to the support line of the channel. Then the Euro made an upward impulse, and then broke the 1.1210 level one more time and continued to grow inside the channel. Later price reached the resistance line of the channel and then corrected, after which, in a short time rose to the support area, breaking the 1.1400 level. But soon the price turned around and dropped to the 1.1210 level, thereby exiting from channel. Next, Euro continued to grow inside the wedge, where it rose to the current support level and soon broke it. After this, the price rose to the resistance line of the wedge and then corrected, after which it made an upward impulse. Price exited from the wedge, and now I think that the Euro can make a correction, after the rise, and then continue to grow next. That's why I set my TP at 1.1560 points. Please share this idea with your friends and click Boost 🚀
Disclaimer: As part of ThinkMarkets’ Influencer Program, I am sponsored to share and publish their charts in my analysis.
