NAIIVE. Pullback before the next leg up.CTO Token in an up trend now and it seems community pretty strong and bullish. Binance Smart Chain is experiencing a surge in liquidity. Regarding TA, the price may Pullback to the moving average before trend continuation.
Parallel Channel

GOLD → Consolidation before a strong move...FX:XAUUSD is consolidating after a false breakout of resistance at 3365, awaiting economic data. The metal remains attractive to investors amid the economic crisis.
Gold is supported by the weakening dollar amid increased trade risks. Today, US tariffs on steel and aluminum come into force, and Trump's ultimatum to trading partners expires. Investors are also awaiting news of a possible meeting between Trump and Xi Jinping amid new accusations against China. The focus is on key employment data (ADP) and the ISM services index, which could influence the dollar and expectations for the Fed's actions.
Technically, the market may test the 3323 liquidity zone before continuing its growth.
Resistance levels: 3365, 3391
Support levels: 3345, 3323, 3303
Overall, both the global and local trends are bullish, with the price forming a local correction after a false breakout of resistance. If the bulls hold their ground above 3323-3345 after retesting support, growth may continue in the short to medium term.
Best regards, R. Linda!

AUDCHF → Hunting for liquidity. Fall from resistanceFX:AUDCHF is emerging from local consolidation and entering a distribution phase. Potentially, against the backdrop of a downtrend, the market may be interested in the liquidity zone at 0.5356
Globally, we have a strong downtrend and a countertrend correction that is facing pressure in the 0.545 zone. The decline is resuming, but at some point the market formed an EQH liquidity pool at 0.5356, which is most likely acting as a magnet pulling the price towards it...
Based on the technical situation, we can conclude that if the price continues to form a distribution towards the target, the market is quite capable of stopping the price and returning to the downtrend phase.
Resistance levels: 0.535, 0.5356
Support levels: 0.5327, 0.5314
Thus, a breakout of the resistance level of 0.5356 without the possibility of continuing growth and a return of the price below the resistance level with subsequent price consolidation in the sales zone (below 0.5356) may trigger a resumption of the downward trend.
Best regards, R. Lind

PIRAMAL ENTERPRISES LTDThis is the Weekly Chart of PEL !!
PEl is moving in an Ascending Channel pattern on the weekly chart.
PEL is following a HH–HL structure in the channel in Daily chart support at 1040-1050 range, confirming a bullish trend continuation.
Based on historical price behavior, the stock has
previously delivered a 74% return from its swing low, reaching the 1500–1520 range.
Thank You!!

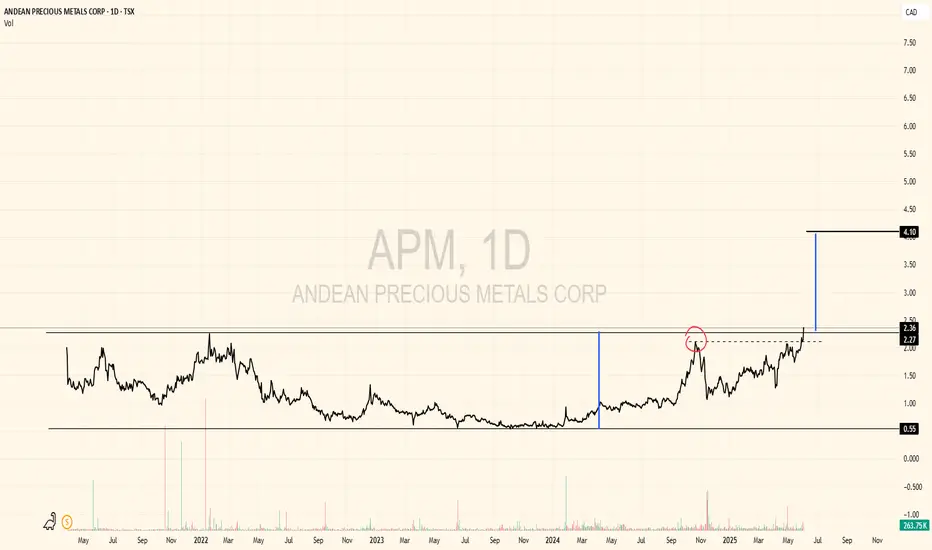
Measured-move target $4?After a massive base like this, and the macro lining up positively for this name, I think an initial $4 target as a result of the huge inverted head and shoulders is very likely.
GOLD → Correction to liquidity before growthFX:XAUUSD is in the realization phase after exiting the “symmetrical triangle” consolidation. The price is supported by the trend and a complex fundamental background.
Gold is retreating from its peak, remaining below risk support. The price of gold is falling moderately from $3,392, awaiting data on JOLTS job openings in the US.
Gold is supported by trade and geopolitical risks: Trump doubled tariffs on metals, increasing pressure on the dollar. The conflict with China has escalated due to allegations of violations of agreements.
Focus on US employment: Strong data could support the dollar and limit gold's gains, but the technical picture remains bullish.
Resistance levels: 3365, 3391, 3409
Support levels: 3345, 3323
Against the backdrop of a rising dollar, gold may test deeper liquidity zones, such as 3345 and 3330. However, if trading forms between 3365 and 3345, followed by a retest of resistance and consolidation above 3365, this could trigger an early rise to 3391-3409.
Best regards, R. Linda!

AAVEUSDT → A false breakdown provokes a change of characterBINANCE:AAVEUSDT.P maintains a bullish market structure. The coin is consolidating, with bulls trying to hold their ground above the key support line.
Against the backdrop of a correction, the price is testing liquidity, with a false breakdown of support provoking a change in character to bullish within the local timeframe. Bulls are trying to maintain the bullish structure.
The price is breaking through the resistance of local consolidation, forming a change in character, but before growth, the market may close the gestalt in the form of an order block or liquidity located in the 249.5 zone.
Support levels: 249.11, 240.0
Resistance levels: 274.27, 280.47
Technically, the coin looks quite good and promising overall. If the bulls hold their ground in the 249-250 zone, then in the short to medium term, we could see good movement with the possibility of new highs...
Best regards, R. Linda!

Bitcoin may break support level and continue to fall in channelHello traders, I want share with you my opinion about Bitcoin. Previously, price was moving inside a horizontal range, consolidating between resistance and the buyer zone near 103500 - 102900. The market lacked clear direction, and price repeatedly rebounded within this structure, failing to build strong momentum either way. Eventually, BTC exited the range and began forming a downward channel. This shift introduced a clear bearish bias, with each high being lower than the previous one. Price action started respecting the descending resistance and support lines, confirming the structure. Sellers consistently stepped in from the seller zone near 109000 - 109500, pushing the price downward with each retest. Currently, BTC is hovering around the support level at 103500 points, showing short-term weakness. The latest reaction from this area didn’t generate significant bullish follow-through. In my view, BTC is likely to break through this support and continue falling inside the channel. That’s why I’ve placed my TP at 100600 points, which matches the support line of the channel and offers a logical downside target. Please share this idea with your friends and click Boost 🚀

Euro will rise to seller zone and then drop to support lineHello traders, I want share with you my opinion about Euro. At first, price was moving inside a downward channel, forming lower highs and lower lows. Each rejection from the resistance line pushed the price lower, and the structure remained bearish until the price reached the buyer zone near 1.1210 - 1.1185 points. A strong rebound from this area triggered a breakout from the channel, signaling a shift in market dynamics. After this breakout, the trend reversed and price started forming an upward channel, with clean impulses and structured corrections. Bulls began stepping in from higher support levels, and the market started respecting the new rising support and resistance lines. Now the price is approaching the seller zone at 1.1435 - 1.1460 points and has already shown signs of rejection from that area. Given this setup, I believe EURUSD may start to decline and fall back toward the support line of the upward channel. That’s why I’ve placed my TP at 1.1325 points, which aligns with the channel's support structure. Please share this idea with your friends and click Boost 🚀
Disclaimer: As part of ThinkMarkets’ Influencer Program, I am sponsored to share and publish their charts in my analysis.

GOLD (XAUUSD): Bullish Continuation Confirmed
As we discussed yesterday, Gold managed to break and close above
a resistance line of a bullish flag pattern on a daily.
It opens a potential for more growth.
Our next resistance is 3429.
For buying, consider the expanding demand zone based
on a broken horizontal resistance and a trend line.
❤️Please, support my work with like, thank you!❤️
I am part of Trade Nation's Influencer program and receive a monthly fee for using their TradingView charts in my analysis.

Rising from the Ashes: CUMMINS INDIA's Grand Wave 5 Launch?After a soul-sucking 11-month correction that chewed through every classic pattern — flats, triangles, zigzags, combos — CUMMINS INDIA may finally be ready for lift-off.
A WXYXZ correction has reached its climax in a clear Wave 4 low near ₹2580, completing the complex structure inside a descending channel.
But the game changed when price:
Broke the 200 SMA
Blasted through the channel
Punched RSI above 70 for the first time since May 2024
And did it with volume breakout
Now, all eyes are on Wave 5 — projected to aim for:
1.0 extension: ₹3569
1.618 extension: ₹3812
Can we reach a new ATH above ₹4171? It’s possible — if this unfolds through nested 1-2-3s, we may be witnessing the start of a larger degree rally.
Invalidation : Below ₹2706. If it breaks, the count may need a rework .
For now? Wait until it retraces to launchpad.?
Disclaimer: This analysis is for educational purposes only and does not constitute investment advice. Please do your own research (DYOR) before making any trading decisions.

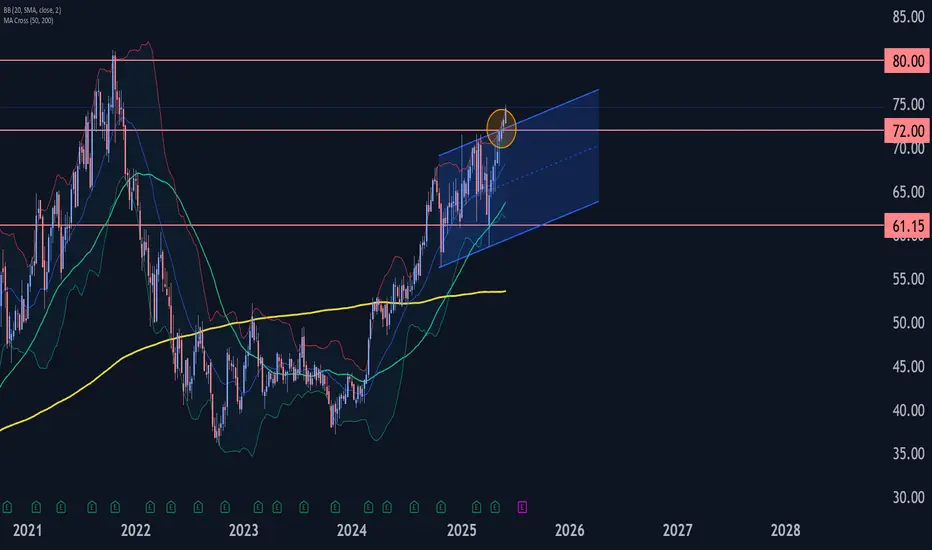
Ebay Wave Analysis – 2 June 2025
- Ebay broke resistance zone
- Likely to rise to resistance level 80.00
Ebay recently broke the resistance zone between the key resistance level 72.00 and the resistance trendline of the daily Up Channel from last year.
The breakout of this resistance zone accelerated the active weekly impulse wave 3, which belongs to the intermediate impulse wave (3) from 2024.
Given the multiyear uptrend, Ebay can be expected to rise to the next resistance level 80.00 (which stopped the weekly uptrend in 2021).
BSE Ltd – Completion of a 5-Wave ImpulseBSE Ltd appears to have completed a five-wave impulsive advance following a prior flat correction. Wave 5 has reached the 1.618 Fibonacci extension of Wave 1 and touched the upper boundary of a well-defined ascending channel — suggesting a potential short-term top.
If a correction unfolds from here, it may take the form of a zigzag or a flat. Key Fibonacci retracement levels to watch:
Target 1: 2,159 – 0.382 retracement
Target 2: 1,981 – 0.5 retracement
Target 3: 1,803 – 0.618 retracement
The invalidation level for this setup is around 2,736.20 . A sustained move above this would indicate that the uptrend may still be in progress.
Price action in the coming sessions will be key to confirming the next direction.
Disclaimer: This analysis is for educational purposes only and does not constitute investment advice. Please do your own research (DYOR) before making any trading decisions.

META : Old Peak can be TestedMeta platform has lost altitude from the channel it has formed since 2023, but has gained momentum and re-entered the channel. The possibility of testing the old peak contains a good RR rate.Of course, with a stop-loss close to the 200-period moving average.( Risk/Reward Ratio : 2.48)
Stop-Loss: 605.47
Target : 740.10

EURUSD Follow Ascending channel bullish strong from supportFX:EURUSD Technical Outlook – 1H Time Frame
✨ By Livia
FX:EURUSD has been respecting a strong ascending channel, demonstrating bullish momentum from the key support level at 1.12600. Price action continues to make higher highs and higher lows, confirming buyer control within the current structure.
📈 Key Highlight:
The pair is steadily approaching the 1.14000 level, a notable supply zone where previous selling pressure emerged. This level marks the next potential target for bulls, with possible resistance or profit-taking interest around that area.
💡 Outlook:
As long as price remains above the midline of the channel and holds above 1.12600, the bullish bias remains intact. Watch for potential consolidation or reaction at 1.14000.

GOLD → Correction after distribution. Bullish trendFX:XAUUSD is testing the liquidity zone at 3350 and forming a false breakout of resistance within the uptrend. A correction is possible before growth continues.
The fundamental background is quite controversial in the market. In the current situation, the focus is on relations between Russia and Ukraine, especially after the escalation that took place over the weekend. Everyone is watching the ongoing negotiations in Turkey. In addition, we should not forget about the situation with tariffs, which is still quite tense.
Gold has been rallying since the opening of the session and has reached the order block. A false breakout of resistance is forming, which could trigger a correction to the zone of interest. The dollar is hitting support, which could form a local correction before continuing its movement. This could also affect the price of gold, which remains bullish in the market.
Resistance levels: 3350, 3365, 3409
Support levels: 3303, 3264
The price has broken out of consolidation, with resistance tested and liquidity above 3350 realized. Relative to the current level, a correction is possible with the aim of retesting support before continuing to rise.
Best regards, R. Linda!

Nifty Bounces from Channel Bottom. Amidst escalation in Ukraine and Russia tussle with Ukraine going on major Drone offensive and Russia likely to respond anytime this week. The escalation can lead to NATO involvement and this can spell a major downside for Global market. The above is just speculation and things can take a different trajectory as well. During such global negative news Indian markets made a low of 24526 but recovered 190 points to close near 24716. This shows the strength of Indian market and shows that we are quiet buoyant.
Resistance for Nifty Remain near: 24763 (Mother Line of Hourly Chart), 24887, 25041 (Mid channel resistance and 25151.
Supports For Nifty Currently remain at: 24637, 24519 (Parallel Channel Bottom) and 24474 (Father Line of Hourly Chart).
If we get a closing below 24474 Bears will have an upper hand and can drag market further down we give the downside levels if we reach there. If we get a closing above 25151 Bulls Will have an Upper hand and can pull the index further upwards we give further upside levels once we reach there.
Disclaimer: The above information is provided for educational purpose, analysis and paper trading only. Please don't treat this as a buy or sell recommendation for the stock or index. The Techno-Funda analysis is based on data that is more than 3 months old. Supports and Resistances are determined by historic past peaks and Valley in the chart. Many other indicators and patterns like EMA, RSI, MACD, Volumes, Fibonacci, parallel channel etc. use historic data which is 3 months or older cyclical points. There is no guarantee they will work in future as markets are highly volatile and swings in prices are also due to macro and micro factors based on actions taken by the company as well as region and global events. Equity investment is subject to risks. I or my clients or family members might have positions in the stocks that we mention in our educational posts. We will not be responsible for any Profit or loss that may occur due to any financial decision taken based on any data provided in this message. Do consult your investment advisor before taking any financial decisions. Stop losses should be an important part of any investment in equity.

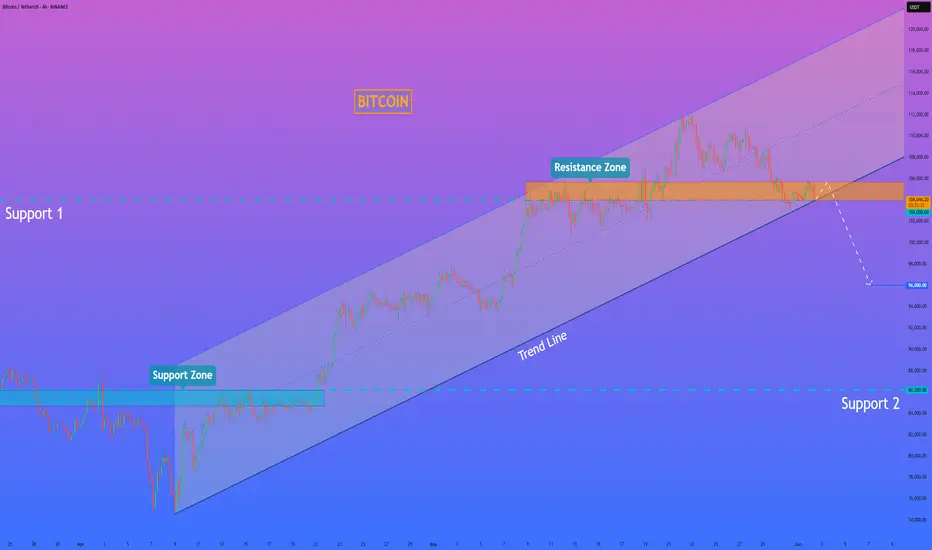
HelenP. I Bitcoin can exit break trend line and continue to fallHi folks today I'm prepared for you Bitcoin analytics. After looking at the chart, we can see how the price declined and broke support 2, which coincided with the support zone. Then the price rose to the support zone but turned around and dropped to the trend line. After this movement, BTC started to grow inside an upward channel, where it soon rose to support 2, which soon broke it and continued to move up. In the channel, price rose to support 1 and some time traded near this level. Later, BTC broke it and rose to the resistance line of the channel and turned around, and dropped to support 1. And at the moment, it traded inside the resistance zone, which coincided with the support level. So, I expect that BTCUSDT will break the support level, which coincides with the trend line, and continue to decline, thereby exiting from upward channel. That's why I set my goal at 96000 points. If you like my analytics you may support me with your like/comment ❤️
GOLD (XAUUSD): Sense of Fear?!
As the Russia-Ukraine peace talks are going today,
Gold shows clear signs of worry.
The market turned bullish after the opening and is currenty
breaking a resistance line of a bullish flag pattern on a daily
that we discussed earlier.
To confirm the violation, we will need a daily candle close above that.
As the results of the talks are still unknown, more moves may occur today.
So the today's close will be very important.
Let's patiently wait.
❤️Please, support my work with like, thank you!❤️

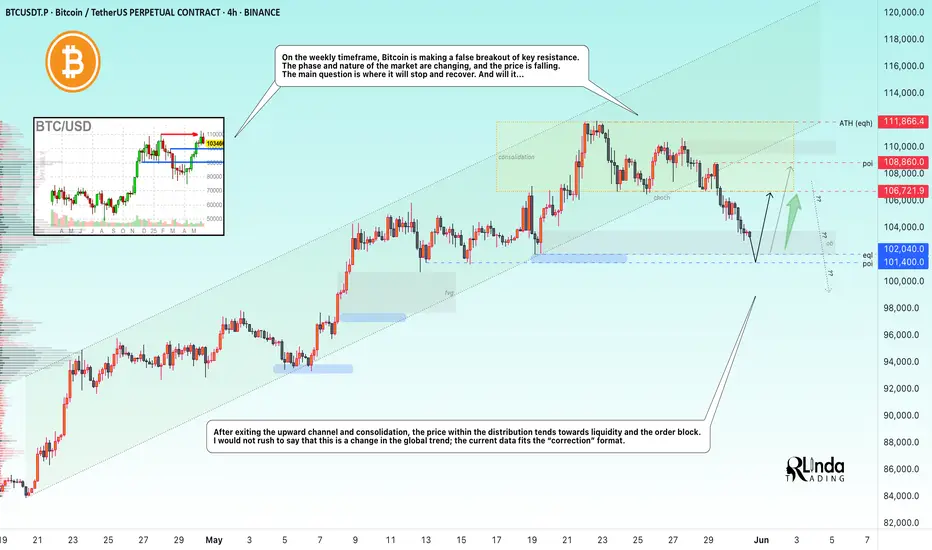
BITCOIN → Correction or trend reversal? Why is 101K important?BINANCE:BTCUSDT.P is exiting the upward channel after a false breakout of the key resistance level of 110K (previous ATH). Liquidation?
Quite an interesting situation with James Wynn. As they say, money loves silence, especially when it comes to a highly manipulated market... A week after the whale's actions, Trump decided to play the market again by creating emotional swings: he announced tariffs on the EU, canceled them, then made claims against China and is now ready to reintroduce tariffs on the EU. Things didn't end well with James... Liquidation before the rally?
On the weekly timeframe, Bitcoin is making a false breakout of the key resistance level of 110K. The phase and nature of the market are changing, the price is falling, breaking the structural support of 106500. The main question is where the stop and recovery will be. And will there be one...
After exiting consolidation and the upward channel, the price within the distribution is moving towards liquidity and the order block. I would not rush to say that this is a change in the global trend; the current data fits the “correction” format.
Support levels: 102000, 101400
Resistance levels: 106700, 108800
102-100K is a fairly important zone for the market; a breakout in this area could open the way to a (local) bottom. Bulls may not be able to hold the market, in which case a global sell-off could form. Therefore, I believe that retesting the 102000 level will end with a liquidity grab and a correction along the trend, during which the price may test the 106K - 108K level, which will determine the future of the market: consolidation, growth, or decline...
Best regards, R. Linda!
GOLD (XAUUSD): Support : Resistance Analysis For Next Week
Here is my latest structure analysis and
important supports & resistances for Gold for next week.
Horizontal Structures
Support 1: 3238 - 3286 area
Support 2: 3122 - 3179 area
Support 3: 2957 - 2982 area
Resistance 1: 3353 - 3366 area
Resistance 2: 3427 - 3425 area
Resistance 3: 3483 - 3501 area
Vertical Structures
Vertical Support 1: falling trend line
Vertical Resistance 1: falling trend line
Consider these structures for pullback/breakout trading.
❤️Please, support my work with like, thank you!❤️
I am part of Trade Nation's Influencer program and receive a monthly fee for using their TradingView charts in my analysis.

Long - 4H Channel Down – Bullish Break on the Horizon?Price has been respecting a descending channel structure, tapping key support zones with weakening bearish momentum. Eyes on a clean breakout to the upside. Confirmation above the trendline could open up bullish continuation — waiting for volume and retest.

GBPCAD Wave Analysis – 30 May 2025
- GBPCAD reversed from resistance zone
- Likely to fall to support level 1.8275
GBPCAD currency pair recently reversed down from the resistance zone lying between the resistance level 1.8720 (which stopped the previous impulse wave (3) and the resistance trendline of the weekly up channel from 2023.
This resistance zone was further strengthened by the upper daily and the weekly Bollinger Bands.
GBPCAD currency pair can be expected to fall to the next support level 1.8275, former weekly low from the start of May.
