USDCAD Makes Retest At 200 EMA After Bull Trap BreakoutOANDA:USDCAD here on the 1Hr Chart has printed an Ascending Channel and Bears have made a Breakout!
Price currently looks to be on its way to retesting the Breakout of the Channel with the 200 EMA and Upper Bollinger Bands sitting at the Rising Support adding some heavy Bearish Pressure.
Fundamentally, BOC will be releasing GDP m/m ( Gross Domestic Product ) numbers tomorrow morning at 0730 AM CST with analysts forecasting a .3% Increase at .1% with Previous being -0.2%.
Parallel Channel

USDCAD: Bearish After the News 🇺🇸🇨🇦
USDCAD looks bearish after a release of today's fundamental news.
A bearish breakout of a rising channel on a 4h time frame
and a strong selling reaction after its retest provide
a reliable bearish continuation.
I think that the price may drop to 1.3743 support.
❤️Please, support my work with like, thank you!❤️
I am part of Trade Nation's Influencer program and receive a monthly fee for using their TradingView charts in my analysis.

GOLD (XAUUSD): Detailed Daily Time Frame Analysis
Gold is officially in correction now.
Analysing a price action on a daily time frame,
we can see a valid bullish flag pattern.
A minor trend that we see within the boundaries of the flag
reflects a global overbought state of the market.
The upper boundary of the flag is a strong vertical resistance
that concentrates a selling interest.
An accurate signal of a resumption of a bullish trend will be
a breakout and a candle close above that.
A bullish wave will be expected at least to 3420 then.
Remember that we can not predict how long the market will
keep trading within the flag. Also, the market may easily
drop lower within that, updating the low.
If a correction continues below the low of a flag pole,
that may signify a global bearish reversal.
Of course, from a current geopolitical and economic perspective
it is a low-probability scenario.
❤️Please, support my work with like, thank you!❤️

Quick Short expected until reaching the support areaHi Family. Here is a quick Short expectation from my perspective, until reaching the support area arount 165-164.
Please trade carefully using stop loss
Big up, no financial advice ! Make your own decision and risk management

$BTC Hits Key Support Will the Bulls Defend?Bitcoin2025 is currently testing a key support zone at $104,800, where the ascending trendline and horizontal support intersect.
This level is crucial, holding here could trigger a bounce back toward the $117K–$121K zone within the rising channel.
However, a breakdown below this support may lead to a drop toward the $101K fair value gap or even lower supports around $97K and $88K.
BTC is at a decision point.
Watch this level closely for the next move.
DYRO, NFA

BITCOIN (BTCUSD): A Deeper Correction?!
After Bitcoin updated the All-Time High, the market became
weak and exhausted.
A violation of a support line of a rising channel and a breakout
of a key horizontal support indicate a highly probable continuation
of a correction.
Our closest demand zone is 103200. It can be the goal for the sellers for now.
❤️Please, support my work with like, thank you!❤️

GBPJPY - Bearish Control, Again!Hello TradingView Family / Fellow Traders. This is Richard, also known as theSignalyst.
📉As per our last GBPJPY analysis (attached on the chart), it rejected the upper red trendline and traded lower.
What's next?
GBPJPY is currently retesting the upper bound of the falling red channel again.
Moreover, the green zone is a strong structure and resistance.
🏹 Thus, the highlighted red circle is a strong area to look for sell setups as it is the intersection of structure and upper red trendline acting as a non-horizontal resistance.
📚 As per my trading style:
As #GBPJPY is around the red circle zone, I will be looking for bearish reversal setups (like a double top pattern, trendline break , and so on...)
📚 Always follow your trading plan regarding entry, risk management, and trade management.
Good luck!
All Strategies Are Good; If Managed Properly!
~Rich
Disclosure: I am part of Trade Nation's Influencer program and receive a monthly fee for using their TradingView charts in my analysis.

GBPUSD - SO MANY BULLISH SIGNS ! confirmed TPs HIT GBPUSD- Market is moving in a Bullish Channel since long. Market has formed Bullish continuation pattern and that's how we can predict a projection of TPs which is also well within a channel. Market has also retraced and bounced back from the FIB LEVEL of 0.382 which is also a good support level followed by the 3 white soldiers pattern.
ENTRY POINT & STOPLOSS with TPs :
we plan entry on the break out of resistance level (market has instant entry point) which is break of HH and keeping our SL below the HL / FIB 0.382 level or the resistance level.

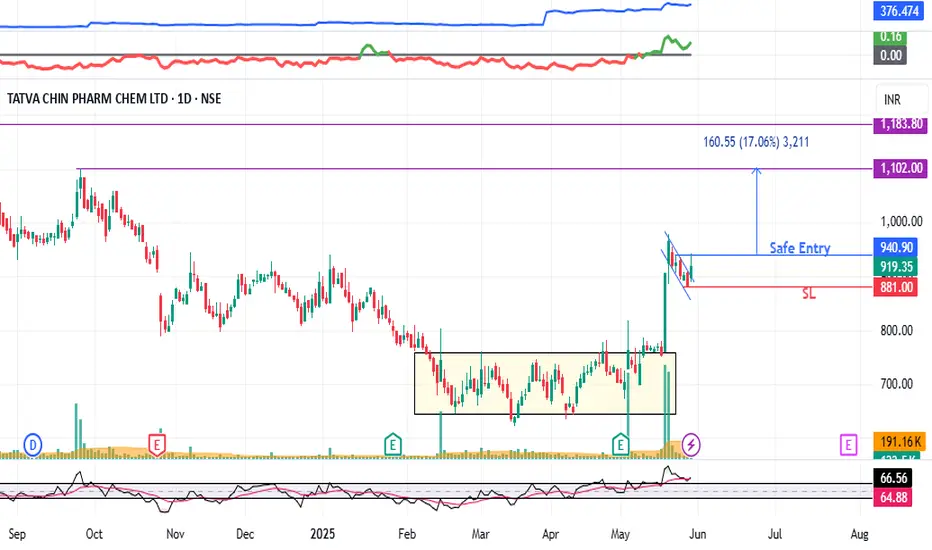
TATVA : Chart Pattern Breakout (Swing Pick)#TATVA #chartpatternbreakout #breakoutstock #flagbreakout
TATVA : Swing Trade
>> Chart Pattern Breakout
>> Flag & Pole Breakout Visible
>> Trending stock
>> Good Strength in stock
>> Volumes Driedup, Expansion imminent
>> Good Upside Potential
Swing Traders can lock profit at 10% and keep trailing
Disc : Stock charts shared are for Learning purpose and not a Trade recommendation.
Do your own analysis or Consult a SEBI Registered Advisior for taking positions
IGL : Breakout Stock (Swing Pick)#IGL #breakoutstock #parallelchannelbreakout #Trendingstock
IGL : Swing Trade
>> Parallel Channel Breakout
>> Momentum stock
>> Good Strength & Volumes Dried up
>> Good Upside Potential
>> It could go and Retest the GAP area
Swing Traders can lock profit at 10% and keep trailing
Disc : Stock Charts shared for Learning purpose and not a Trade recommendation. Do your own Research and analysis or Consult your Financial advisor or a SEBI Registered Advisor before taking position

ZAGGLE : Chart Pattern Breakout ( Swing Pick )#ZAGGLE #breakoutstock #flagbreakout #chartpatternbreakout #flagandpole
ZAGGLE : Swing Trade
>> Chart pattern Breakout
>> Flag and pole breakout visible
>> Trending stock
>> Low Risk , High Reward Trade
>> Good Strength & Decent Volumes Building up
Swing Traders can Lock Profit at 10% and keep trailing
Disclaimer : Stock Charts shared are for Learning Purpose and not a Trade Recommendation. Do your Own Analysis or Consult ur Financial advisor or a SEBI Registered Advisor

EURO - Price can make movement up and then drop to $1.1100 levelHi guys, this is my overview for EURUSD, feel free to check it and write your feedback in comments👊
Some time ago price declined inside a falling channel, where it fell to $1.0735 points and then made an upward impulse.
Price exited from channel and reached $1.1100 level, which it soon broke it and continued to move up.
Later Euro rose to $1.1425 points, and then made a correction, after which, in a short time, price rose higher this level.
After this movement, price turned around and started to decline, breaking $1.1425 level again and entered to flat.
In flat, Euro bounced from $1.1100 level and started to grow inside a flat, and later rose to resistance level.
Recently price started to decline, so I expect that Euro can rise a little and then continue to decline to $1.1100 level.
If this post is useful to you, you can support me with like/boost and advice in comments❤️
Disclaimer: As part of ThinkMarkets’ Influencer Program, I am sponsored to share and publish their charts in my analysis.

Bitcoin will fall to support line of channel and then rebound upHello traders, I want share with you my opinion about Bitcoin. Bitcoin spent a considerable period trading within a horizontal range, bounded by the buyer zone around 92000 - 93000 points and the upper boundary just below 103000 points. Throughout this phase, the price respected both limits, bouncing between support and resistance, forming a stable consolidation base. Eventually, BTC broke out of this range with a strong bullish impulse, entering a clearly defined upward channel. Since then, price action has been guided by the structure of this rising channel, consistently forming higher highs and lows. Multiple clean retests of the support line confirm the integrity of the trend, and recent movement shows BTC pulling back from mid-channel after a short-term correction. Now the price is approaching the support area between 102000 - 103000, which aligns with the channel’s lower boundary. Given the pattern’s consistency and strength in previous rebounds, I think BTC can correct to the support line and continue to grow. For this case, I set my TP at 113000 points, near the resistance of the upward channel. Please share this idea with your friends and click Boost 🚀

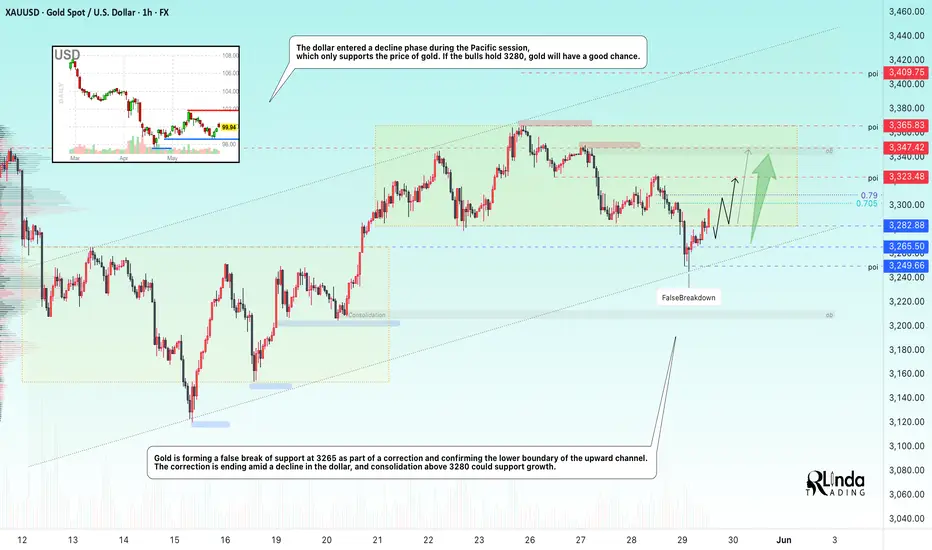
GOLD → False breakdown and support from the falling DXYFX:XAUUSD , as part of a correction, confirms the upward trend line and returns to the consolidation (range), making a false breakdown of support amid the dollar's correction...
The US dollar remains stable thanks to the Fed's hawkish minutes and the court's decision to block Trump's tariffs. Investors are waiting for Friday's inflation data (PCE), which could weaken the dollar and give gold a chance to rebound. Additional influence will come from US GDP data, jobless claims, and geopolitical news.
On D1, gold is rebounding from strong support and heading towards resistance at the rising trend line. If economic risks remain high, gold could continue its rally despite conflicting bearish patterns...
Resistance levels: 3300, 3310, 3325
Support levels: 3290, 3285, 3265
Gold is forming a false breakdown of support at 3265 as part of a correction and confirming the lower boundary of the upward channel. Consolidation above 3280 will confirm that bulls are holding the market amid high economic risks. Gold may test 3300-3310 and form a correction before continuing its growth towards 3325.
Best regards, R. Linda!
DOGEUSDT → Long squeeze before growth?BINANCE:DOGEUSDT.P is consolidating. A range with clear boundaries has formed. Before a possible breakout, a liquidation (false breakdown) may form
On D1, the structure is quite positive. Earlier, the price tested the downward resistance, but there was no reaction (fall) as such. Instead, the price is consolidating within the range of 0.211 (0.205) - 0.23 - 0.253.
Bitcoin, like the entire crypto market, is consolidating within fairly clear boundaries. Based on the current situation, it would be logical to wait for one part of the market to be liquidated before the price can move in either direction. Based on the bullish market, there may be a retest of support in the form of a false break...
Resistance levels: 0.2308, 0.253
Support levels: 0.213, 0.2116, 0.205
DOGE is consolidating with a focus on the 0.23–0.211 range. Against the backdrop of a bullish trend, a liquidation (long squeeze) relative to the lower boundary of the 0.23–0.205 range is possible before growth continues. A false break of support and liquidity capture would be useful maneuvers before implementation. However, if the market is aggressive enough and resistance at 0.23 is broken with subsequent consolidation above this level, it could trigger premature growth.
Best regards, R. Linda!

EURJPY: Move Up Ahead! 🇪🇺🇯🇵
EURJPY is going to rise more after breaking
a resistance line of a tiny horizontal consolidation range
that was formed on a retest of a recently broken daily structure.
Goal - 164.8
❤️Please, support my work with like, thank you!❤️
I am part of Trade Nation's Influencer program and receive a monthly fee for using their TradingView charts in my analysis.

CADJPY - NEW BREAKOUT !Hello Traders !
The CADJPY price formed a descending channel.
Currently, The resistance line is broken !
So, I expect a bullish move🚀
_______________
TARGET: 105.390🎯

GBPJPY Ascending channel breakdown selling from supply zone📉 GBPJPY Analysis – 4H Timeframe
by Livia 😜
We’ve seen GBPJPY break below the ascending channel, confirming downside momentum. Price has already completed a textbook retest of the supply zone around 196.000, showing strong rejection.
🟢 Sell Entry Activated: 195.800
This level aligns perfectly with the breakdown structure and prior support turned resistance.
🎯 Technical Targets:
1️⃣ First Target – 192.600 (key structural support)
2️⃣ Second Target – 190.600 (major swing low & potential demand area)
🔍 Outlook:
Bias remains bearish while price holds below 196.200. Expect increased volatility near 193.000 but momentum favors continued downside.
Risk wisely, trade smart.
Let’s ride this wave 🌊
#GBPJPY #ForexTrading #PriceAction #TechnicalAnalysis #LiviaTrades

Tesla Ascending Parallel Channel for Trend ContinuationTesla Ascending Parallel Channel for Trend Continuation
Stop Loss: 333.21
Buy Stop: 389.34
TP1: 443.32
TP2: 495.54
No Divergence

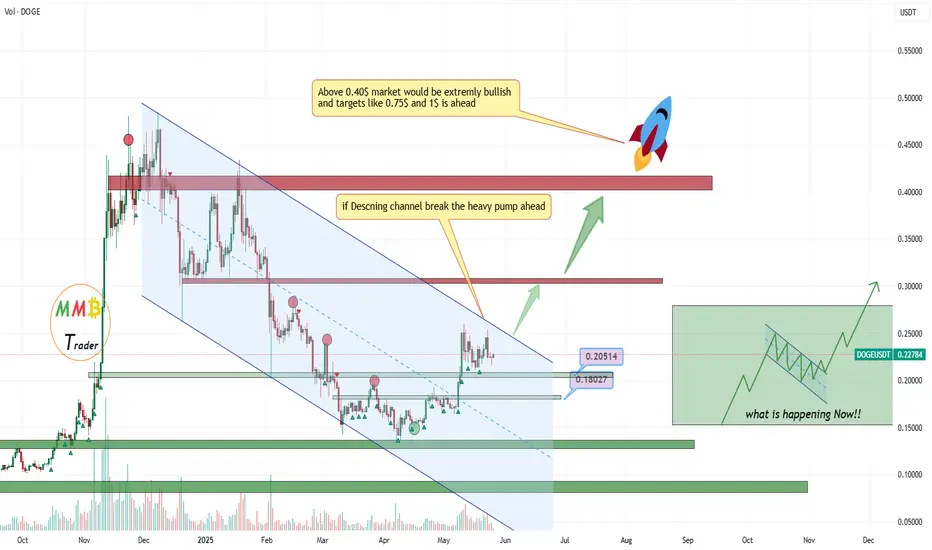
DOGEUSDT Above channel resistance will pump non stop get readyAs we can see price is getting ready for a breakout to the upside which cause DOGEUSDT pump non stop and even maybe will lead DOGE to new ATH.
All is needed which will happen soon is price break blue channel resistance and price above 0.27$ is sign of that.
DISCLAIMER: ((trade based on your own decision))
<<press like👍 if you enjoy💚
XAU Channel breakoutXAU currently breaking out of the channel
Confirmation would be a 4H close above the channel
SL at 3300
Wide SL can be 3275 if you prefer wide SL
Target at 3563
TP however at Fib circle 3538

UNI. Movement.You can call it sideways movement or a movement in a global ascending channel - imo, both options will be valid for BME:UNI you can expect 60% up move - to the middle of the channel

EURO - Price can rise a little and then start to declineHi guys, this is my overview for EURUSD, feel free to check it and write your feedback in comments👊
Some time ago, price entered a falling channel, where it broke through $1.1310 level at once, but soon broke it again.
Price traded near this level for some time, after which it reached resistance line and continued to decline.
Then price broke $1.1310 level and dropped to $1.1065 level, after which it turned around and started to grow within the channel.
In the rising channel, Euro broke $1.1140 level and continued to grow, but later made a correction to this level.
After this, price continued to grow and later broke $1.1310 level, then rose to the resistance line of the channel.
I expect that Euro will rise to resistance line and then start to decline to the $1.1310 support level.
If this post is useful to you, you can support me with like/boost and advice in comments❤️
Disclaimer: As part of ThinkMarkets’ Influencer Program, I am sponsored to share and publish their charts in my analysis.
