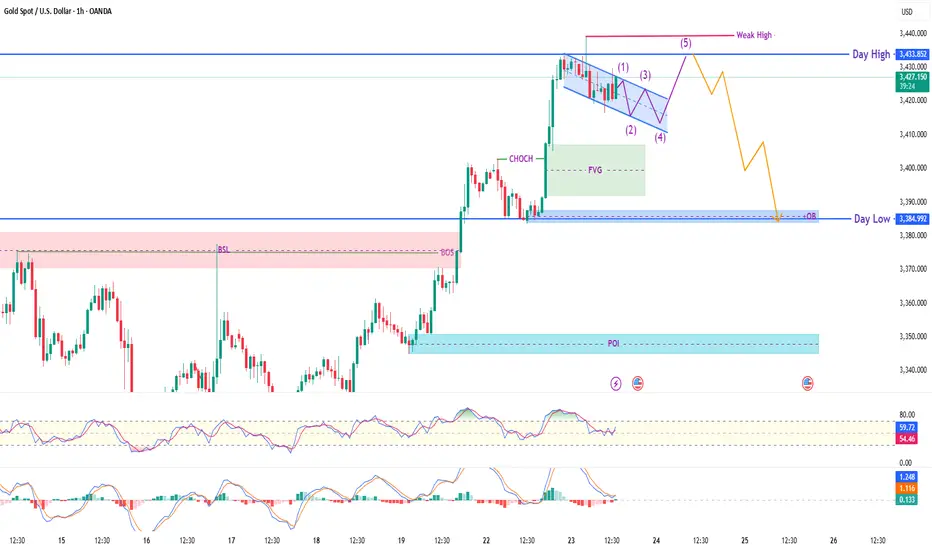
XAU/USD (Gold) – Smart Money Reversal Setup | 1H Breakdown🔹 Current Price: $3,423.98
🔹 Session Range: Day High $3,433.85 | Day Low $3,384.99
🔍 Smart Money Narrative:
Clean bullish impulse followed by CHoCH + Fair Value Gap (FVG) creation
Price forming Ending Diagonal / Rising Wedge (5-wave structure) into weak high
Expecting liquidity sweep above the weak high followed by bearish reversal
📐 Key Technical Highlights:
🟣 CHoCH confirms potential reversal
🟩 FVG + OB Zone acting as mitigation base
🔻 Day Low + 1H OB marked as key bearish target
🔺 Day High = weak liquidity likely to be swept before drop
📈 Trade Idea (Bearish Plan):
Let price complete wave (5) and sweep the weak high
Look for confirmation (MSS, FVG, lower TF BOS)
Short entry target: OB near $3,385 (Day Low zone)
Optional swing target = $3,360–3,345 POI zone
⚠️ Risk Note:
This is a smart money concept-based idea focused on liquidity, CHoCH, and mitigation logic. Use lower timeframe confirmations before entry. Manage risk wisely.
#XAUUSD #SmartMoney #ICT #LiquiditySweep #CHoCH #FVG #MarketStructure #ForexGold #ReversalSetup
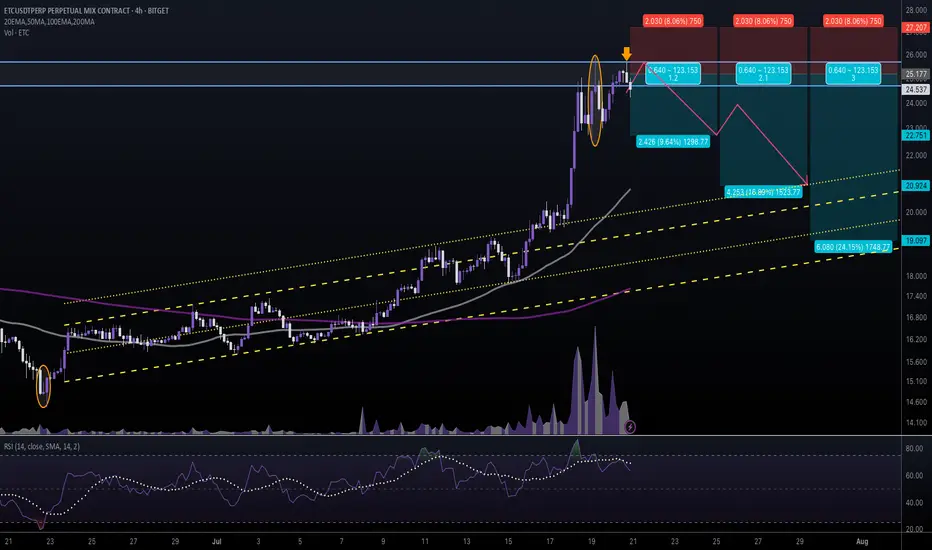
Parallel Channel
#ETCUSDT #4h (Bitget Futures) Ascending channel retestEthereum Classic printed two evening stars in a row, looks locally topped and ready for correction towards 50MA & 200MA supports.
⚡️⚡️ #ETC/USDT ⚡️⚡️
Exchanges: Bitget Futures
Signal Type: Regular (Short)
Leverage: Isolated (5.0X)
Amount: 5.0%
Entry Zone:
24.679 - 25.675
Take-Profit Targets:
1) 22.751
2) 20.924
3) 19.097
Stop Targets:
1) 27.207
Published By: @Zblaba
CRYPTOCAP:ETC BITGET:ETCUSDT.P #4h #EthereumClassic #PoW #L1 ethereumclassic.org
Risk/Reward= 1:1.2 | 1:2.1 | 1:3.0
Expected Profit= +48.2% | +84.5% | +120.7%
Possible Loss= -40.3%
Estimated Gaintime= 1-2 weeks
Dollar Index (DXY): Strong Bearish Price Action
Dollar Index broke and closed below a support line
of a bullish flag pattern on a daily.
Because the market is trading in a bearish trend,
this violation provides a strong bearish signal.
I expect a bearish movement to 96.75
❤️Please, support my work with like, thank you!❤️

USDJPY → Hunting for liquidity before the fallFX:USDJPY is changing its local trend and succumbing to global pressure. The market is seeing a change in price movement following the decline in the dollar index...
The trend has broken and the price movement has turned bearish. The fall in the dollar index is allowing the Japanese yen to strengthen, which is generally negative for the currency pair. The decline may continue after a slight correction.
Fundamentally, the dollar is correcting amid uncertainty due to the tariff war, as well as expectations of interest rate cuts.
Resistance levels: 147.20, 147.89
Support levels: 145.85, 145.23
As part of the correction, the price may test the liquidity zone of 147.7 or 0.7f. A false breakout and consolidation of the price in the selling zone may trigger a further decline in both the short and medium term.
Best regards, R. Linda!

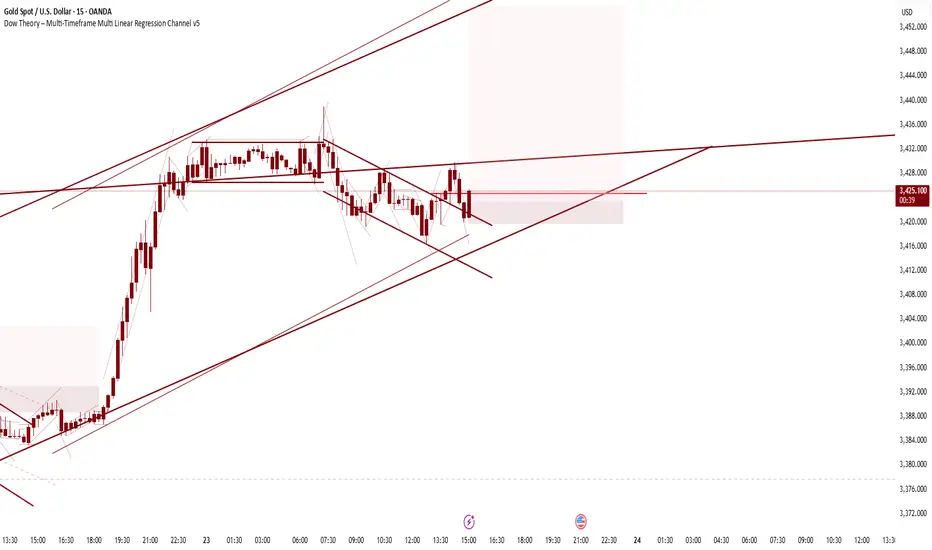
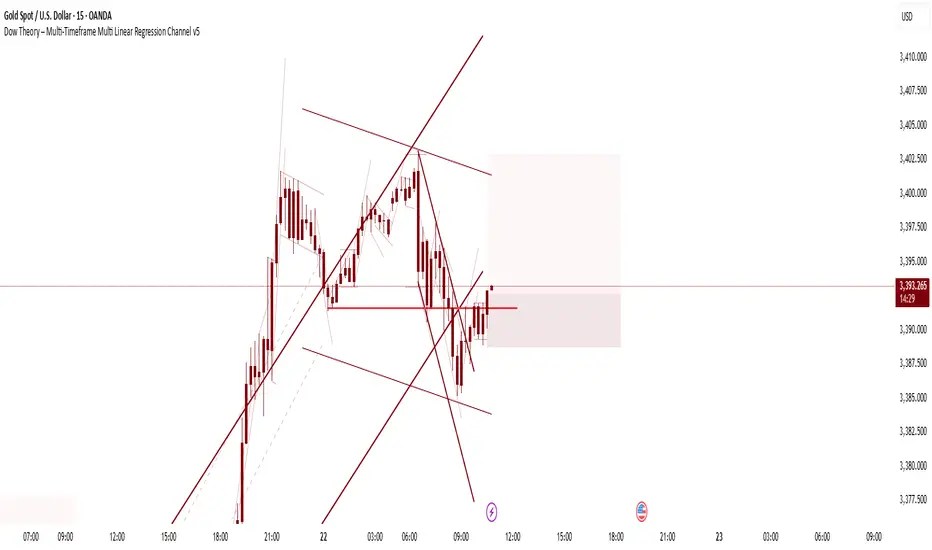
LONG XAUUSDI observe that the overall trend is up — both the secondary and primary trends are bullish. This pullback has created a failed swing high but hasn’t formed a new lower low, and price has now entered a value zone for buying.
I'm waiting for this candlestick to break the minor trend, which would provide bullish confluence across the primary, secondary, and minor trends according to Dow Theory
EURCAD - Follow the Bears!Hello TradingView Family / Fellow Traders. This is Richard, also known as theSignalyst.
📈EURCAD has been overall bearish , trading within the falling red channel and it is currently retesting the upper bound of the channel.
Moreover, it is rejecting a weekly resistance marked in blue.
📚 As per my trading style:
As #EURCAD is around the red circle zone, I will be looking for trend-following sell setups on lower timeframes. (like a double top pattern, trendline break , and so on...)
📚 Always follow your trading plan regarding entry, risk management, and trade management.
Good luck!
All Strategies Are Good; If Managed Properly!
~Rich
Disclosure: I am part of Trade Nation's Influencer program and receive a monthly fee for using their TradingView charts in my analysis.

USDJPY Ascending channel bullish strong from support 📊USDJPY Analysis – 4H Timeframe
USDJPY is giving full respect to the bullish ascending channel, maintaining higher highs and higher lows with clean structure
📍 Key Support Zone:
Strong buying interest seen near 147.200 — potential long opportunity from this zone
Watching for bullish confirmation or entry setups at this level
🎯 Next Target / Supply Zone:
🔹149.000 – marked as the next resistance / supply zone where price may react or slow down
Bullish Order Block (OB) sits deeper at 143.000 – a strong area of interest if price pulls back further
🧠Stay patient and let price action lead — clean structure, smart levels, and risk-managed entries
What’s your take on USDJPY right now? Drop your thoughts
#usdjpy

EURUSD major resistance breakout bullish strong Readmore...📊EURUSD Analysis – 1H Timeframe
EURUSD has broken out of the descending channel with strength, shifting structure and showing clear bullish intent
📌 Breakout Confirmed:
✅ Major resistance at 1.16900 broken with strong momentum — now acting as support
Buy position activated from the 1.16900 breakout level
🎯 Next Resistance Targets / Supply Zones:
🔹 1.17200
🔹 1.17500
🔹 1.17600
Watching for reaction at these levels — trend continuation likely as long as structure holds
🧠Always follow your trading plan and risk rules — markets don’t promise, they move!
What’s your take on EURUSD’s breakout? Drop your thoughts below
#eurusd
👋Regards from expert Team

XAUUSD major resistance breakout below 3375 level Readmore...📊XAUUSD Gold Analysis – 4H Timeframe
Gold is respecting the bullish ascending channel on the 4H, with strong momentum continuing after a breakout above 3375 – a major resistance now turned into key support.
Retracement Entry Activated:
✅Entry taken at the 3375 breakout level – now acting as strong demand
🛑Stop Loss:
Placed below at 3323, aligned with the bullish order block (OB) for added protection
🎯Next Resistance Targets / Supply Zones:
🔹 3392
🔹 3404
🔹 3440 [ /b]
📌Watching price reaction at each level for signs of exhaustion or continuation
🧠Always manage risk and follow your plan – no guarantees in the market!
Share your thoughts below!
#gold #xauusd
👋Regards from _expert Team_

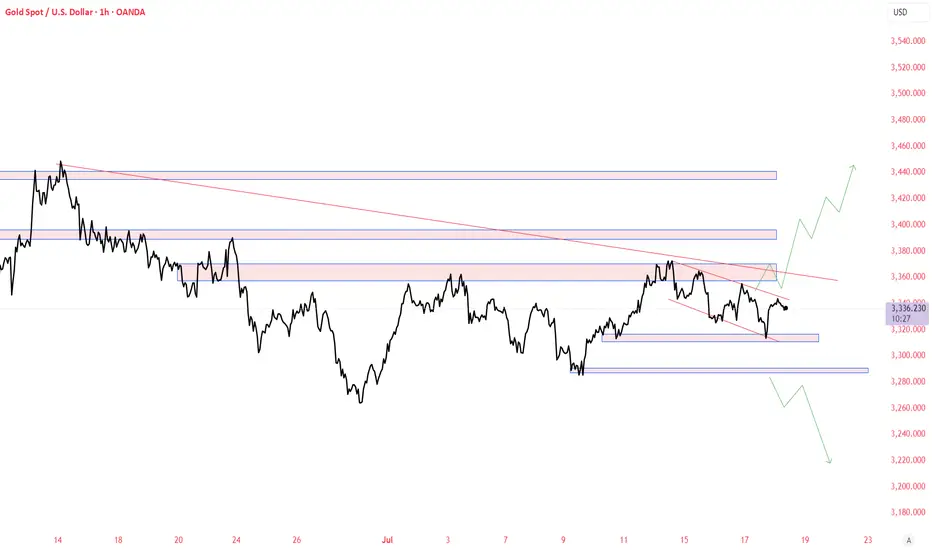
XAUUSD - Falling Wedge Parallel ChannelGold Volatility being more. Banks increasing the gold inventories, may surge to new highs. Sharing Some idea it may go either way some big rally or big correction.
This chart is only for educational purpose, Do your own study before taking any trades
Bitcoin Wave Analysis – 22 July 2025
- Bitcoin reversed from support level 116065.00
- Likely to rise to resistance level 122775.00
Bitcoin cryptocurrency recently reversed up from the key support level 116065.00, which also stopped the earlier minor correction 2 at the start of June.
The support level 116065.00 was further strengthened by the support trendline of the daily up channel from June and the 38.2% Fibonacci correction of the upward impulse from July.
Given the strong daily uptrend, Bitcoin cryptocurrency can be expected to rise further to the next resistance level 122775.00 (which stopped the previous impulse wave 1).

BNB Wave Analysis – 22 July 2025- BNB rising inside sharp impulse wave C
- Likely to rise to resistance level 792.00
BNB cryptocurrency continues to rise inside the sharp upward impulse wave C, which previously broke through the 3 strong resistance levels 693.00, 720.00 and 740.00.
The breakout of the resistance level 720.00 coincided with the breakout of the daily up channel from June – which accelerated the active impulse wave C.
Given the strong daily uptrend, BNB cryptocurrency can be expected to rise further to the next resistance level 792.00 (former multi-month high from last December).

GOLD → Correction before continuing the rally to 3450FX:XAUUSD updates its local maximum to 3401.5 and enters a consolidation phase ahead of news. The dollar correction gives speculators a chance...
The price of gold is correcting from 3400. The reason is profit-taking ahead of Powell's speech at 12:30 GMT and waiting for clarity on US trade negotiations with the EU and Japan before August 1.
Gold remains sensitive to the progress of negotiations and the dynamics of the dollar, which is weakening amid political uncertainty, declining yields, and pressure on the Fed from Trump.
Technically, after exiting consolidation and retesting 3400, the price is entering a local consolidation phase.
Focus on key levels: 3401, 3382, 3375. A false breakdown of support could trigger a recovery phase.
Resistance levels: 3402, 3393
Support levels: 3382, 3375, 3362.75
The distribution phase has been halted by resistance, and the price has moved into a countertrend correction due to uncertainty. Markets are waiting for positive signals from the Fed. Local and global trends are bullish, which may support the price overall...
Best regards, R. Linda!

S&P500 INDEX (US500): Bullish Trend Continues
US500 updated a higher high this week, breaking a resistance
of a bullish flag pattern on a daily time frame.
I think that the market will rise even more.
Next goal for the bulls - 6359
❤️Please, support my work with like, thank you!❤️
I am part of Trade Nation's Influencer program and receive a monthly fee for using their TradingView charts in my analysis.

GBPUSD new breakout from descending channel bullish strong 📊GBPUSD Analysis – 4H Timeframe
GBPUSD has broken out of the descending channel with a strong bullish candle, signaling a potential shift in structure and bullish momentum
📍 Key Support Zone:
✅ Buy activated from 1.34400 – now acting as a solid demand area after breakout
🛑 Stop Loss:
Set below at 1.33800, aligned with the bullish order block for added protection
🎯 Next Resistance Levels / Profit Zones:
🔹 1.36000 – first supply zone
🔹 1.36700 – short-term resistance
🔹 1.37500 – major bullish OB target zone
🧠Trade with structure, manage risk, and follow your plan – no emotions, just execution
Share your view on GBPUSD below
#gbpusd

GOLD → Breakthrough accumulation. Correction before growthFX:XAUUSD has been strengthening since the session opened and is heading towards the 3374 zone of interest. The price has previously broken through the consolidation resistance and may test this boundary before moving further.
Gold is rising amid trade risks and dollar weakness. After falling to $3310, gold resumed its growth, seeking to break through the $3368 level. Support for prices was provided by uncertainty surrounding Trump's tariff policy and expectations for Fed Chairman Powell's speech. The US dollar weakened temporarily as investors sought refuge in gold amid trade disputes with the EU, political instability in Japan, and criticism of the Fed from the White House.
Technically, the price is in a realization phase after breaking out of consolidation, but it has encountered resistance at 3368, which could lead to a correction. The focus is on the 3350-3355 zone. If the bulls hold their ground above this zone, the market may return to the realization phase.
Resistance levels: 3368, 3374
Support levels: 3345, 3332
The market is bullish and feels support, especially against the backdrop of a weak dollar. Traders are watching Trump and Powell. If the latter decides to cut rates, for example tomorrow at 12:30 GMT, gold could rally...
Technically, gold could test 3350 before rising.
Best regards, R. Linda!

BITCOIN → Consolidation, retest of 120K. Correction of dominanceBINANCE:BTCUSDT , after a rapid rally and touching 123K, rolled back and entered consolidation, giving altcoins a chance. At the same time, Trump signed new crypto laws, but will these laws open new doors?
On June 18, the GENIUS Act was signed. Information can be found in the sources, but there is no direct reference to BINANCE:BTCUSDT.P , except perhaps indirectly: increased confidence in the crypto market, increased liquidity, possible new rules, and pressure on decentralized assets. Bitcoin has not always grown on positive news; more often it has been a deep pullback and liquidation before the momentum.
Technically, Bitcoin is currently consolidating, and I would highlight several key areas: the upper range is 120K-120.9K. The zone between these levels is particularly important, as this is where buyers were previously liquidated and sellers gathered (liquidation is possible).
The bottom is 117K (confirmed) - 116.2K. There is a liquidity pool on the support side.
additional scenario if the market does not reach resistance and decides to form a long squeeze before growth
Theoretically, I am not yet expecting a breakout and growth of Bitcoin. I think that consolidation may continue for some time, especially against the backdrop of a pullback in altcoins and a deep correction in the dominance index.
Resistance levels: 120100, 120850
Support levels: 117000, 116230
Since the opening of the session, the price has been working off the liquidity capture from 117K. There is a reaction - growth, which could bring the price to the zone of interest at 120K. But the question is: will the price hold in the 120K zone? A false breakout of resistance could trigger a correction to 117-116K. Thus, I expect the market to remain in consolidation for some time or even expand the current trading range...
Best regards, R. Linda!

EURUSD - Parallel channel in play!The following chart offers a closer look at the current structure of the EUR/USD pair on the 4-hour timeframe. Price action has been respecting a well-defined bearish parallel channel, which has provided clear boundaries for both resistance and support. Based on the ongoing reaction to these levels, we outline both bullish and bearish scenarios that could unfold in the coming sessions.
Bearish Parallel Channel
Since June 30, EUR/USD has been consistently moving within a downward-sloping bearish parallel channel. Each attempt to break above the upper boundary of the channel has been rejected, while the lower boundary continues to act as dynamic support. This sustained rejection from the upper trendline confirms the strength of the bearish momentum currently at play. The pair remains structurally weak unless a clean breakout to the upside occurs, accompanied by strong bullish confirmation.
Bullish Scenario
A potential bullish reversal could materialize if EUR/USD manages to hold above the 4-hour Fair Value Gap (FVG) located between 1.1620 and 1.1600. This zone may provide the necessary support for the bulls to step in. If the price maintains strength within or just above this FVG and buyers begin to show dominance, a rebound toward the upper boundary of the channel could occur. A successful breakout above the channel could then trigger a stronger rally, possibly targeting the 1.1750–1.1800 region, marking a clear shift in short-term momentum.
Bearish Scenario
Conversely, if the pair fails to hold the 4-hour FVG between 1.1620 and 1.1600 and closes a strong bearish 4-hour candle below this zone, the market may be setting up for further downside. This would suggest a rejection of the FVG as resistance and open the path for a drop toward the lower end of the channel. Interestingly, this area also aligns with a previously established larger 4-hour FVG. A move into this deeper FVG could present a more favorable zone for a longer-term bullish reversal, as it offers a stronger liquidity pool and potential demand area.
Final Thoughts
The EUR/USD pair is at a critical juncture. Price is hovering near a key support zone within a bearish channel that has defined its movement for several weeks. Whether bulls can hold this support and break above the channel, or bears take control and push it lower toward the broader 4-hour FVG, will determine the next major directional move. Traders should closely monitor price action around the 1.1620–1.1600 level for clues on the likely breakout direction.
--------------------------
Disclosure: I am part of Trade Nation's Influencer program and receive a monthly fee for using their TradingView charts in my analysis.
Thanks for your support. If you enjoyed this analysis, make sure to follow me so you don't miss the next one. And if you found it helpful, feel free to drop a like and leave a comment, I’d love to hear your thoughts!

ACT TOKEN - Price can fall to support area and then bounce upHi guys, this is my overview for ACTBUSD, feel free to check it and write your feedback in comments👊
The price was trading within a descending channel for a considerable period.
The asset consistently found support at the lower boundary of this formation, within the 0.0590 - 0.0570 price zone.
Recently, a strong upward impulse allowed the price to break out from the upper boundary of the channel.
Following the breakout, the price executed a corrective move back to the broken resistance line, successfully retesting the 0.0730 - 0.0750 area.
This zone is now acting as a new support level, and the price has begun to move upwards from it, showing renewed buyer strength.
I expect that the asset will continue its growth from this support. My first target is set at the 0.0860 level, with the second target at 0.0970 points.
If this post is useful to you, you can support me with like/boost and advice in comments❤️

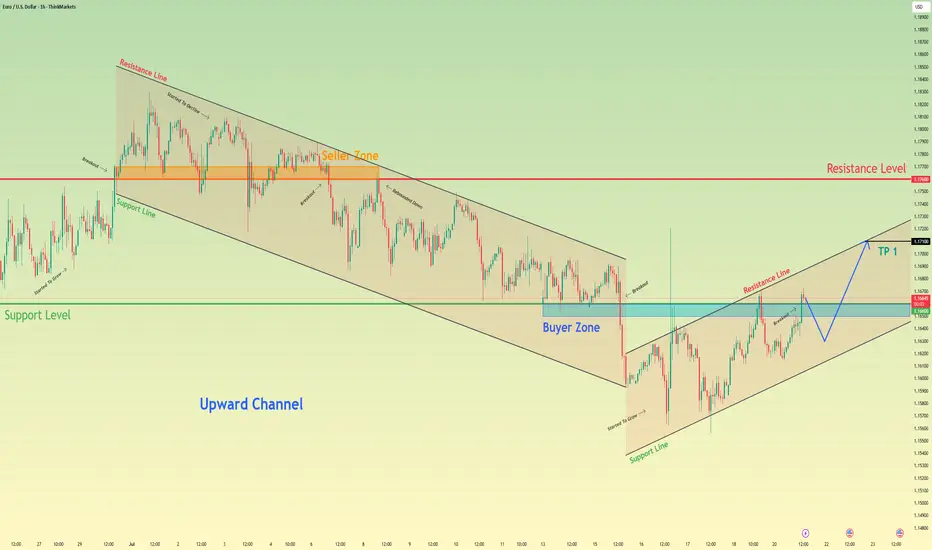
Euro may correct a little and then continue to rise in channelHello traders, I want share with you my opinion about Euro. Observing the recent price action, we can map out a clear transition in market structure. Previously, the pair was contained within a well-defined downward channel, where the seller zone around the 1.1760 resistance level consistently capped rallies, leading to multiple breakdowns and correctional movements. However, after a final push lower, the dynamic shifted, with the price action showing a clear downtrend-to-uptrend reversal. Currently, the euro has established a new upward channel, finding solid ground in the buyer zone around the 1.1660 support level. The price is now engaged in a constructive upward movement within the boundaries of this new channel. The prevailing hypothesis is that after a potential minor correction towards the channel's support line, the pair will resume its ascent. Therefore, the take-profit target for this scenario, tp 1, is strategically placed at 1.1710, as this level directly corresponds with the resistance line of the current upward channel, representing a logical point for price to react. Please share this idea with your friends and click Boost 🚀
Disclaimer: As part of ThinkMarkets’ Influencer Program, I am sponsored to share and publish their charts in my analysis.
GBPAUD: Bullish Movement Continues 🇬🇧🇦🇺
GBPAUD is going to rise more, following a confirmed intraday bullish reversal:
first, the price violated a resistance line of a falling channel.
It started to consolidate within an inverted head & shoulders pattern then.
Its neckline violation is another strong bullish signal.
Next resistance - 2.0685
❤️Please, support my work with like, thank you!❤️
I am part of Trade Nation's Influencer program and receive a monthly fee for using their TradingView charts in my analysis.

