EURJPY → False breakout of resistance. Reversal?FX:EURJPY is testing the resistance of the trading range as part of a distribution movement, but the situation ends with a false breakout and price consolidation within the flat.
Against the backdrop of the falling dollar, the Japanese yen is strengthening and thus exerting a corresponding influence on the currency pair. EURJPY is forming a false breakout of resistance within a distribution movement formed after a retest the support of the flat. The price returns to the channel. After a false breakout of resistance and a return of the price below a strong key level, a base is forming in the form of support at 163.2 (trigger).
Resistance levels: 163.4, 163.6
Support levels: 163.2, 162.7
A breakdown of the 163.2 trigger and price consolidation below the key level could intensify the sell-off, triggering a further decline.
Best regards, R. Linda!
Parallel Channel

Solana Wave Analysis – 27 May 2025
- Solana rising inside daily up channel
- Likely to reach resistance level 186.10
Solana cryptocurrency recently reversed up from the support trendline of the daily up channel from the start of April (coinciding with the 20-day moving average).
The upward reversal from this support trendline continues the active impulse wave 3 of the intermediate impulse wave (3) from last month.
Solana cryptocurrency can be expected to rise to the next resistance level 186.10, which stopped the previous impulse wave 1 in the middle of May.

GOLD → Correction before possible growthFX:XAUUSD entered a liquidation phase (rally) within the trading range at the opening of the session. The dollar's rise is to blame. The focus is on supporting consolidation...
Investors remain interested in gold as a safe haven asset amid geopolitical risks and declining demand for US assets.
The key drivers remain news about tax reform in the US, trade negotiations, and upcoming macro data.
Gold is consolidating, but since the opening of the session, the price has been heading towards support. Against the backdrop of an upward trend, a trigger for bearish liquidity is likely to form before growth.
Against the backdrop of the dollar's growth, gold is entering a correction phase. At the moment, all attention is on support and the liquidity zone of 3265. A false breakdown will trigger a price buyback.
Resistance levels: 3322
Support levels: 3282, 3265
Since the price is still within the range and a countertrend correction is forming in the market, in our case, it is worth considering an intraband trading strategy. A false breakdown of support could trigger growth to intermediate resistance or to the upper border of the channel.
Best regards, R. Linda!

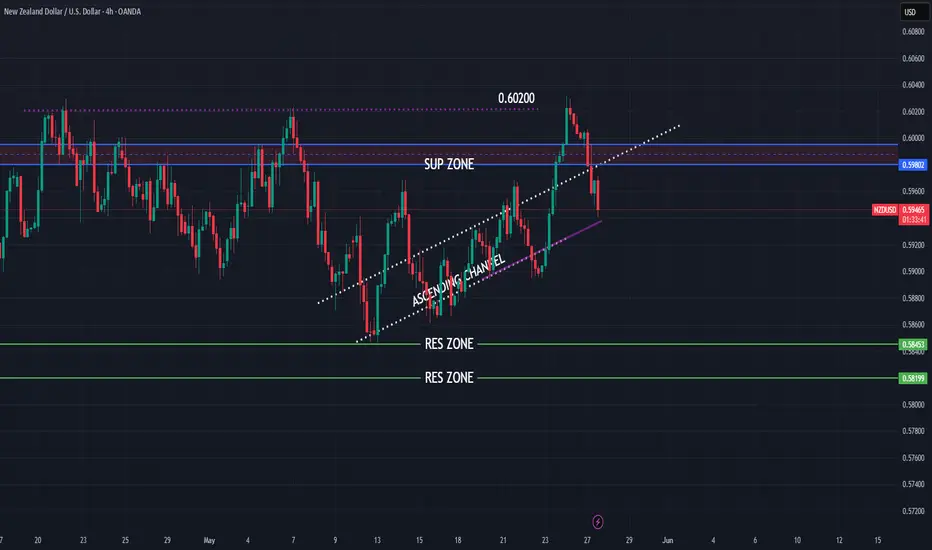
NZDUSD higher falls expecting
OANDA:NZDUSD ASCENDING CHANNEL visible, we are have break of same on 23.5, price is start pushing but on first res zone (0.60200), price is start making reverse.
Currently again in ASCENDING CHANNEL expectations for this week are to see break and bearish push.
SUP zone: 0.59800
RES zone: 0.58450, 0.58200
USDCAD: Strong Bearish Confirmation ?! 🇺🇸🇨🇦
I see an important sign of strength of the sellers on USDCAD
on an hourly time frame after a release of the today's US fundamentals.
The price violated a support line of a horizontal range and is retesting
that at the moment.
I believe that the price may drop at least to1.374 level soon.
❤️Please, support my work with like, thank you!❤️
I am part of Trade Nation's Influencer program and receive a monthly fee for using their TradingView charts in my analysis.

Bitcoin can continue to grow inside upward channelHello traders, I want share with you my opinion about Bitcoin. If we looks at this chart we can see how the price, after a healthy correction, the price started rising steadily within an upward channel. Along the way, price broke through the first key level and, after some consolidation, managed to overcome the second one as well. Currently, the price is trading just below the resistance line of the ascending channel. This structure shows that buyers remain in control, and bullish momentum is holding strong despite occasional pullbacks. The overall trend remains upward, and the asset respects the lower boundary of the channel as dynamic support. At the moment, I expect a minor downward move as a short-term correction. This would allow BTC to retest the local support area, strengthening the base before the next leg up. After that, I anticipate further growth, and a breakout toward the upper boundary of the channel is likely. That’s why my TP 1 is set at 115800 points - a potential new ATH aligned with the resistance line of the current structure. Please share this idea with your friends and click Boost 🚀

GOLD - Price can continue to fall and exit from triangle patternHi guys, this is my overview for GOLD, feel free to check it and write your feedback in comments👊
Some days ago, price entered to rising channel, where it turned around and made a correction to the support line.
Then it continued to grow and rose to the $2975 level, which continued with a support area, and continued to grow.
Later price rose to the resistance line, but then made a correction movement, thereby exiting the channel.
Next, Gold turned around and started to trade inside the triangle, where it at once made an upward impulse.
Price broke $3265 level, rose to resistance line, after which in a short time declined to this level.
But recently it has come back, so I expect that Gold can continue to fall to $3150, breaking the support level.
If this post is useful to you, you can support me with like/boost and advice in comments❤️
Disclaimer: As part of ThinkMarkets’ Influencer Program, I am sponsored to share and publish their charts in my analysis.

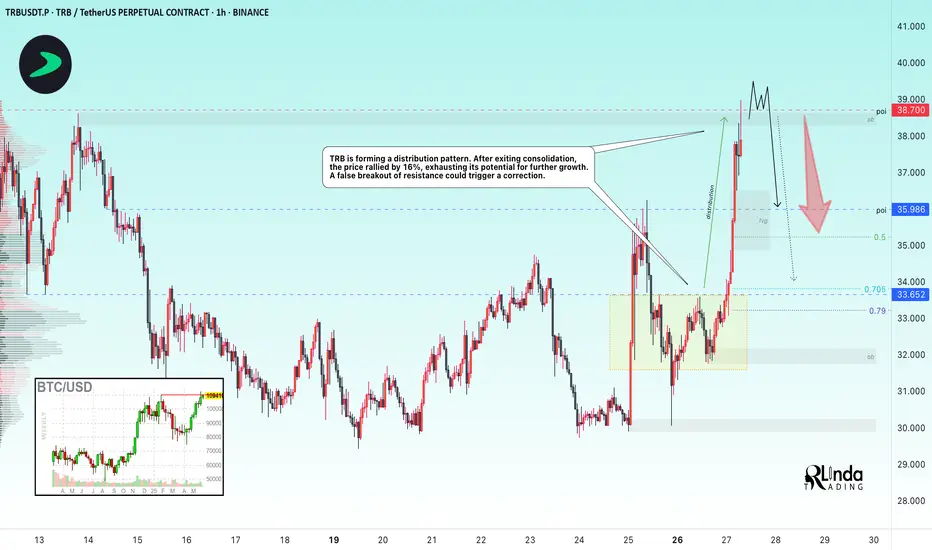
TRBUSDT → High probability of a false breakoutBINANCE:TRBUSDT.P is testing resistance in the 38,700 range as part of a rally. The current strong movement may end in a false breakout...
TRB is forming a distribution pattern. After exiting consolidation, the price rallied 16%, exhausting its potential for further growth.
A false breakout of resistance could trigger a correction.
Bitcoin looks controversial in the overall situation. After a false breakout of the 110K resistance, the price is consolidating below the level. If the flagship correction begins, it may also trigger a correction in altcoins...
Resistance levels: 38,700
Support levels: 35.98, 33.65
If the price fails to consolidate above the level and continue to rise, this will confirm the absence of bullish potential. A false breakout and price consolidation below 38.700 will trigger a correction to 36 - 33
Best regards, R. Linda!
BNB will rest after reaching 1000BNB has successfully bounced back from the support area and heading towards the next resistance which is around 900-1000. This target is easily achievable for BNB since is fundamentally strong and BNB ecosystem is heavily used.
I'm expecting BNB to reach 1000 in 3rd of this year.
Follow Our TradingView Account for More Technical Analysis Updates, | Like, Share and Comment Your thoughts.
Cheers
GreenCrypto

USDCAD: Bearish Outlook For This Week Explained 🇺🇸🇨🇦
USDCAD will likely continue a bearish trend that the market
established in February.
A bearish breakout of a support line of a horizontal parallel
channel on a daily provides a strong confirmation.
Next goal - 1.3655
❤️Please, support my work with like, thank you!❤️
I am part of Trade Nation's Influencer program and receive a monthly fee for using their TradingView charts in my analysis.

GOLD → Consolidation. Retest of support before growthFX:XAUUSD is strengthening due to a complex fundamental backdrop. A false break of support at 3285 allows the price to update its local high to 3365.
Gold fell moderately from a high of $3365 amid weak activity due to holidays in the US, despite the weak dollar. Investors are taking profits ahead of US inflation data.
Pressure is also linked to hopes for a trade agreement between the US and Japan. However, the decline in prices is limited — geopolitical tensions, US budget problems, and instability in the Middle East are keeping demand for gold as a safe-haven asset.
Support levels: 3321, 3308, 3300
Resistance levels: 3363
Technically, gold is making a false breakout of consolidation resistance and is entering a correction phase, during which the price may test liquidity below 3320-3303 before continuing to rise.
Best regards, R. Linda!

USDCHF → Retest support with the aim of breaking throughFX:USDCHF is also losing ground amid the dollar's decline. The price is testing the support of the range, a break of which could open the way to 0.811
USDCHF is consolidating, but at the same time, a local downward channel is forming. The currency pair is retesting support within the current downward movement. A pre-breakdown consolidation is forming relative to 0.819. The fall of the dollar is having a corresponding effect on the price.
Before continuing its decline, the currency pair may form a retest of 0.5 Fibonacci or close the FVG
Resistance levels: 0.825, 0.8275
Support levels: 0.819, 0.8117
The downward structure will break down when the price leaves the downward channel. However, at the moment, while the price is consolidating at the bottom of the trading range, I expect a breakdown of support in the short term, followed by a continued decline to 0.811 - 0.805
Best regards, R. Linda!

GOLD → Descending Channel and Triangle Appear on H4 Gold Technical Analysis
EMA 200
Last Thursday, gold broke below the 200 EMA, signaling a potential trend reversal to bearish, followed by a rejection at 3,128.00 — an H4 order block area. However, on Tuesday, price action pushed back above the 200 EMA and held, indicating a return to bullish momentum.
Chart Pattern
Price movement is currently constrained by several trendlines, forming a descending channel and triangle pattern, creating a sideways market structure.
Order Block Mapping
A new H4 order block has formed, representing a key area to look for potential buy entries. If this zone is broken, it may offer a strong opportunity for a sell entry.
🟢 Bullish Scenario
If gold reaches the 3,318.00 level — an H4 order block area — it may present a potential buying opportunity. A breakout above the upper trendline would confirm bullish continuation, with the first target at 3,366.00 (TP1), followed by a second target at 3,440.00 (TP2), which is also an H4 order block area.
🔴 Bearish Scenario
If gold breaks below the H4 order block at 3,290.00 and breaches the lower trendline, it may offer a selling opportunity, with the next downside target at 3,055.00 — a key daily order block level.
Best Regard

XMRUSDT broke resistance, waiting for consolidation XMRUSDT is consolidating against the background of an upward (bullish) trend. The coin reacted weakly to yesterday's bitcoin pullback and is testing consolidation resistance with the aim of continuing growth
Scenario: at the moment the price makes a breakout of 401.65. Consolidation of the price above the level will confirm the intentions of buyers to go to the intermediate target of 440.0. Price consolidation above the consolidation will strengthen buying, which may trigger growth

EURUSD - Important Breakout !Hello Traders !
The EURUSD price formed a descending channel.
Currently, The resistance line is broken !
So, I expect a bullish move🚀
______________
TARGET: 1.14095🎯

AU Bulls Make A Break For Higher Prices! Time To Long??OANDA:AUDUSD has practically been caught in an Ascending Channel for most of this year but that might not be for "Long"!
A few key things to point out:
- Early April delivered a False Breakout where Price reached the Previous 5 Year Low @ .5980 and was immediately sent back up into the Channel! (Liquidity Sweep??)
- Most of the Price Action that's occurred in this range has been contained to the Upper Chamber of the Channel between the Rising Resistance and Linear Regression.
- Price Consolidated tightly into a Pennant Pattern underneath the Rising Resistance for the past few weeks before delivering a Bullish Break just earlier this evening.
If Bulls are able to sustain Price outside the Channel, this could generate potential Long Opportunities on the Retest of the Break of the Ascending Channel!
Once a Breakout is validated and Retest is successful, the Price Target would be the Next Swing High @ .66875 where Bears were able to push Price down last.
Fundamentally, RBA will be releasing CPI y/y numbers on Tuesday, May 27th with analysts forecasting a .1% Decrease in Inflation from 2.4% to 2.3% after last week having made a 25 basis point rate cut from 4.1% to 3.85%.

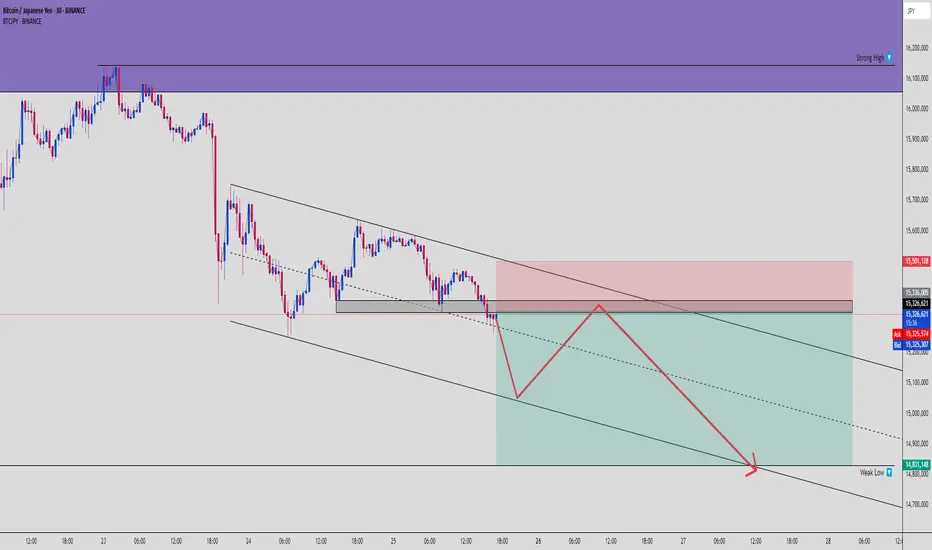
BTCJPY Bearish Channel Setup – OB Rejection to Weak Low Sweep🧠 Bitcoin vs Yen (BTCJPY) | 30M Smart Money Breakdown
BTCJPY is painting the same story we’ve seen before: liquidity builds → OB rejection → channel continuation → weak low sweep. This is how the markets bleed slow then drop fast. Let’s break it down.
🧱 1. Bearish Channel Structure
We’re inside a clear descending channel, where price:
Forms consistent lower highs (supply zones)
Prints lower lows (liquidity grabs)
Shows rejections at channel tops = perfect confluence
This structure supports a continuation downward move.
🧊 2. Order Block + Supply Rejection
Price recently tapped into a clean Bearish Order Block (OB) within the premium zone just under 15.5M.
OB was respected with a sharp reaction
Immediate sell pressure confirms Smart Money entry
Red zone = OB + supply + channel midline
No candle closes above OB = bias confirmed bearish.
🧲 3. Smart Money Flow vs Retail
Retail likely went long on the mini bounce.
Smart Money waited for:
Price to tap into the OB
Retail to stack longs
Opportunity to fill imbalance and dump
This gives us an ideal Sell-to-Buy-to-Sell structure forming.
🕯️ 4. Projected Move: Weak Low Sweep
🧨 Target = 14,831,148
Why?
That’s a marked Weak Low
It aligns with channel support
It’s a known liquidity magnet
Expect acceleration into this zone.
⚔️ 5. Trade Plan (Short Setup)
📍 Entry Zone: 15.315M – 15.33M
🔐 Stop Loss: Above OB → ~15.50M
🎯 Targets:
TP1: 15.200M
TP2: 15.000M
TP3: 14.831M
⚖️ RRR: ~1:4+ depending on execution precision
🧠 Summary:
This chart screams:
“Trap the liquidity, respect the OB, ride the channel.”
These setups repeat. Same pattern, different chart, every week.
📣 Engage Call:
💬 Comment “BTCJPY SHORT SNIPER” if you caught this one
👥 Tag your trading partner – don’t let them miss this play
🔄 Save this chart to study the OB entry mechanics
Total3 Crypto Market CapWe know very well that Trump, at the moment, is able to move markets overnight. We also know well that such a market is difficult to navigate.
Nevertheless, we do have chart indications, as in this case:
- volatility, money inflow and others are in the middle.
- on the weekly, Total3 has bounced from the underlying structure, which may signify strength.
- the candle resting on the weekly FVG will be closed later.
- the indicators look good but not too good. Based on some altcoins (weekly), I see hope there.
- gray and delicate situation.
- best strategy: scalp, small profits, buy the dip and hold. Little or no leverage. Don't get hurt.
I will update to keep you posted on developments.

KRDI Egypt is expected to target 0.750 after crossing 0.608Daily chart,
The stock EGX:KRDI is rebounding to enter the rising channel. Once above the rising trend line (around 0.607), the target will be 0.750 to 0.760 passing through resistance level at 0.658
Technical indicators:
RSI: positive
MACD: About to cross up the signal line
Entry (buy) can be made now at 0.590 - 0.597, and consider a stop loss below 0.580
Safer to enter above 0.608 after the breakout (crossing up) confirmation.

Nifty50 – Wave IV Unfolding Within the Grand SupercycleFrom the Grand Supercycle perspective on the monthly chart, we can observe a consistent pattern — every major a-b-c corrective phase has unfolded as a form of flat correction before the next rally. Based on this historical rhythm, and the current market structure, I believe we are still in the process of completing Wave V of the Grand Supercycle.
This long-term view is overlayed on the chart to help contextualize what’s happening now.
Zooming In – The Weekly Breakdown Within Wave IV and V:
Within this broader Grand Supercycle, the weekly chart captures a five-wave subdivision between Supercycle’s Wave IV and the yet-to-be-completed Wave V.
Wave III has completed after achieving a 100% projection of Wave I from Wave II , respecting classic Fibonacci symmetry.
After the Wave III high, we’ve entered a correction phase , where sub-wave b is currently unfolding.
Flat Correction in Play?
For the current move to qualify as a Flat correction:
Wave b must retrace at least 90% of Wave a .
This requirement is crucial to maintain the “Flat” identity of the structure.
Depending on the nature of the flat:
If it’s a Regular Flat or Expanding Flat, Wave c must break below the bottom of the rising parallel channe l, and end below the low of Wave a .
If it’s a Running Flat , Wave c can stay above Wave a’s low, and price may remain within or near the channel’s lower boundary.
Also, as per EW guidelines, Wave c must unfold in 5 waves — which will be the next key structure to monitor.
Where Are We Now?
As long as Wave b is progressing toward 90% retracement , the near-term bias remains bullish.
But once Wave b completes, the market may enter Wave c, which could result in a deeper correction — either towards the lower end of the channel or even below, depending on which flat structure plays out.
What Next?
This unfolding Wave c will likely complete Wave IV within the Grand Supercycle, setting the stage for the final upward move — Wave V of both the internal 5-wave structure and the Grand Supercycle itself.
Disclaimer: This is not a buy or sell recommendation. The analysis shared is purely my personal view for educational purposes only.

BITCOIN - Price will continue to grow inside rising channelHi guys, this is my overview for BTCUSDT, feel free to check it and write your feedback in comments👊
Price started to grow inside rising channel, where it declined to support line and then bounced up to $93100 level.
BTC broke this level at once and then some time traded near, after which bounced and continued to grow.
Soon BTC made a correction, but quickly turned around and later rose to $104900 level, after which started to decline.
After price fell a little, it made an upward impulse to resistance line of channel, breaking $104900 level.
But not long time ago, BTC bounced from this line and started to decline, so I think that price can continue to fall.
Also, I expect that price will fall to support area and then turn around and continue to grow in channel to $113700
If this post is useful to you, you can support me with like/boost and advice in comments❤️

USDCAD: Bearish Continuation Ahead 🇺🇸🇨🇦
USDCAD completed a consolidation within a horizontal range.
A violation of its support and a daily candle close below that
is a strong bearish signal.
I believe that the price may drop lower next week
and reach at least 1.3655 level.
❤️Please, support my work with like, thank you!❤️
I am part of Trade Nation's Influencer program and receive a monthly fee for using their TradingView charts in my analysis.

Intel Breakdown Alert! Bearish Setup with High R:R Opportunity !📉 Intel Corporation (INTC) – Bearish Setup Analysis
Timeframe: 4H | Ticker: NASDAQ:INTC | Exchange: NASDAQ
🔍 Technical Breakdown
We are currently observing a potential bearish reversal on Intel Corp. following a clear breakdown from a rising parallel channel on the 4H chart.
🟦 Pattern Observed
Price was previously moving within a rising channel, forming higher highs and higher lows – a typical short-term bullish structure.
Recently, price broke down below the lower boundary of this channel, signaling a potential shift in momentum from bullish to bearish.
📌 Trade Setup
Entry Zone: Between $20.22 – $20.06
Price is currently trading in this zone, presenting a potential short entry opportunity following the channel breakdown.
Stop Loss: $21.77
Placed above the previous resistance zone and the broken channel. If the price reclaims this level, the bearish thesis is invalidated.
Final Target: $17.70
This level represents a key support zone from previous price action and aligns with potential measured move from the channel breakdown.
✅ Why This Setup?
Channel Breakdown
A break below a well-defined channel often marks a change in trend. This gives a high-probability setup for trend reversal traders.
Bearish Momentum Confirmation
After the breakdown, price failed to reclaim the channel, and is now trading below the prior support, flipping it into resistance.
Risk/Reward Ratio
This setup offers an excellent R:R ratio, with downside potential toward $17.70 and a relatively tight stop just above the failed structure.
Market Structure Alignment
Lower highs and lower lows now appear to be forming post-breakdown, further confirming a potential bearish move ahead.
📉 Bias: Short
📈 Invalidation: Break and close above $21.77
🎯 Target: $17.70
🧠 Disclaimer: This is not financial advice. Always do your own research and manage your risk accordingly. Trade safe!
