DOGE/USDT Potential UpsidesHey Traders, in today's trading session we are monitoring DOGE/USDT for a buying opportunity around 0.22000 zone, DOGE/USDT is trading in an ascending channel and currently is in a correction phase in which it is approaching the ascending channel support.
Trade safe, Joe.
Parallel Channel

Attention: A big dump may occurWhen you examine the monthly or weekly graph, you can observe that similar patterns may occur. It is useful to be careful.

HelenP. I Bitcoin may continue to grow inside upward channelHi folks today I'm prepared for you Bitcoin analytics. In this chart, we can see how the price has been steadily moving within a well-defined upward channel, respecting its trend structure with clean rebounds from the lower boundary. The price has shown signs of a minor pullback after reaching the upper part of the consolidation range. However, it remains well-supported above the 102700 - 104700 zone, which aligns closely with both the trend line and a previous accumulation area. This confluence strengthens the case for a bullish continuation. Given the consistently higher lows, strong reaction from buyers near the channel support, and the overall bullish momentum, I believe this correction will be short-lived. The market appears to be gathering liquidity before attempting another leg upward. If the current structure holds, BTCUSDT is likely to continue climbing along the lower edge of the channel, gradually pushing toward the next significant target. My current goal remains at 117000 points, a level that aligns with the channel’s upper resistance and reflects the natural extension of the ongoing bullish movement. If you like my analytics you may support me with your like/comment ❤️

Euro will start to grow from support and then leave pennantHello traders, I want share with you my opinion about Euro. Previously, price was moving confidently inside an upward channel, forming steady higher highs and higher lows. After a clear breakout from that structure, the price started consolidating inside a new pattern, an upward pennant. This formation usually appears as a continuation structure, where the market builds pressure before a new impulse. Currently, the price is trading near the middle of the pennant, after rolling down from the resistance line and rebounding up from the support area. The structure is compressing, and a retest of the support line near 1.1155 may occur before a breakout happens. Given the confluence of the pennant structure, the strong support area, and the previous bullish momentum, I expect the Euro to rebound again from the lower trend line and initiate an upward breakout. That’s why I set my TP 1 at the 1.1500 level, a logical target aligned with the upper boundary of the pattern and next key resistance. Please share this idea with your friends and click Boost 🚀
Disclaimer: As part of ThinkMarkets’ Influencer Program, I am sponsored to share and publish their charts in my analysis.

CME Gap Aligns with 4h 200 EMAThe CME Gap around 5710-5730 is beginning to align with the 4h 200 EMA.
4h RSI has been diverging bearish 3 times with each leg up within the channel above.
Also, a breakdown of that channel has measured moves down that align with both the 4h 50 and 200 EMA:
- 50 EMA an 0.5x measured move down
- 200 EMA a 2.5x measured move down
Pre-req on targeting the gap is a breakdown of the parallel channel shown above, and then loss of the 4h 50 EMA.
Good luck!

Gold will continue to rise after a false breakdown The price is trying to consolidate above the key support zone 3290 - 3300. As part of the correction, gold makes a false breakdown and the market starts to show a bullish reaction.
The only confusing thing is the coming news. If the buyers are able to keep the price above 3300, the gold will surely continue its upward trend
Scenario: price consolidation above 3300 after a false breakdown of support will be a good signal for a swing impulse towards the intermediate high of 3345.

#GOLD Friday May 23, 2025Reasons for entering the trade:
1- Confluence of static resistance and the channel top
2- Bermuda Kumo
3- Divergence in MACD and RSI
Entry: 3370
TP: 3295
SL: 3395

GOLD → Consolidation amid a bullish trendFX:XAUUSD is trading in consolidation. As expected, the retest of the 3290 support level will end with a strengthening. The price is heading towards the resistance of the range.
The dollar is falling, which is supporting gold. The local trend is set by the fundamental background. The price of gold is strengthening and heading towards the resistance of the trading range, with the zone of interest being the liquidity located above 3346. The fundamental background is on the buyers' side, but since today is Friday, there is no strong news and the market is unlikely to seek a breakout from consolidation due to the lack of a driver. Thus, we can expect a correction from resistance before growth resumes, which may form next week.
Resistance levels: 3346, 3360
Support levels: 3308, 3290, 3282
Consolidation after the break of the local downtrend amid a falling dollar means that bulls are building up potential before a possible continuation of growth. But at the moment, an intraday trading strategy can be considered.
Best regards, R. Linda!

GOLD → Consolidation (correction) ahead of newsFX:XAUUSD is testing resistance at 3346 and forming a correction, leaving liquidity above the level as the current target. The correction was influenced by the dollar. What can we expect next?
Gold is rising for the fourth day in a row and is approaching $3350, awaiting US PMI data. The dollar remains weak amid geopolitical risks, US-China disputes, and concerns about the US budget. The passage of Trump's tax bill could increase the deficit and pressure on the dollar. Weak PMI data could support gold by heightening expectations of a Fed rate cut
Technically, with the dollar falling, gold has every chance of continuing its rise. But now we are seeing a correction forming. I would say that the relevant areas of interest are 3288 and 0.5 Fibo
Resistance levels: 3346, 3360, 3409
Support levels: 3288, 3275, 3265
As part of the correction, gold may enter a consolidation phase, during which the price will gather liquidity relative to key areas of interest before continuing its growth. A retest and false breakout of 3288 - 3275 is possible before the growth continues.
Best regards, R. Linda!

XLMUSDT → Consolidation above 0.300 will provide an opportunityBINANCE:XLMUSDT.P is returning to the buying zone relative to strong resistance as part of a local uptrend. The market backdrop is favorable, but Bitcoin poses risks...
Bitcoin is updating its historical high and continuing its bullish trend, which is a favorable backdrop for altcoin growth. However, risks are posed by the fact that BTC may form a false breakout of resistance, which would trigger a correction across the entire market.
XLMUSDT is returning to the buying zone relative to strong resistance as part of a local uptrend.
If the bulls hold their ground above 0.3000, growth may continue in the short and medium term.
Resistance levels: 0.318, 0.324
Support levels: 0.300, 0.2975, 0.2799
The focus is on 0.3000, which is a fairly important and key (psychological) level. If the bulls manage to hold their ground above this point, the price will continue to rise, but it is necessary to monitor the behavior of the bitcoin.
Best regards, R. Linda!

NZDJPY → Pre-breakdown consolidation. Readiness for a declineFX:NZDJPY is under pressure from a global downtrend. Locally, a flat (range) and pre-breakdown consolidation relative to support are forming on the chart...
After a false breakdown of support on May 16, the price failed to reverse and grow. Instead, the currency pair entered a consolidation phase, during which it continues to test support. Each subsequent retest of 85.25-85.30 only increases the chances of a breakout with the aim of continuing the decline. Another important nuance is the elimination (short squeeze) of local resistance at 85.95.
Pressure on the price is also being exerted by the falling dollar index, which is strengthening the Japanese yen, which is generally reflected in the price of NZDJPY...
Support levels: 85.300, 85.25, 84.195
Resistance levels: 85.7, 85.95
The continuation of the current consolidation and the compression of the price towards support only increases the chances of a breakdown of the 85.30 support level. A break and consolidation of the price below 85.25 could trigger a further decline.
Best regards, R. Linda!

NZDJPY will continue to fall after false breakout NZDJPY is correcting after the support breakout. The purpose of such correction is to provoke bullish liquidity before the fall. There is a magnet on the market - liquidity in the zone 85.08 - 85.27. False breakout will return the market to the downward phase
Scenario: growth to local resistance, retest of the zone 85.08 - 85.27, false breakout, consolidation below 85.08 and continuation of the fall. Target - support and order-block 84.2

Altcoin Season Brewing?Hi,
The OTHERS/BTC pair represents the collective market capitalization of altcoins relative to Bitcoin. This ratio is a critical indicator of altcoin strength or weakness against Bitcoin. The weekly chart reveals a prolonged bearish phase for altcoins, with Bitcoin dominance persisting. However, recent data suggests potential inflection points worth monitoring.
Key Technical Elements:
- Ascending Channel: The pair is moving within a well-defined macro upward channel. It is currently sitting at the bottom boundary, suggesting a potential reversal point.
- Support Zone: The lower boundary of the channel (purple line) aligns with previous bounce points (2019, 2020, mid-2023), reinforcing its validity.
- RSI Indicator: The RSI has shown bullish divergence with price making lower lows while RSI forms higher lows.
My Opinion:
This chart suggests we are near the bottom for altcoins vs BTC, and the risk/reward is heavily tilted in favor of a bounce, especially going into a potential Q3-Q4 altseason. It’s a classic accumulation zone where smart money tends to position.
And what to do?
- scale into altcoin positions cautiously.
- Use the channel low as a stop-loss zone.
- Look for confirmation over the next 1–2 weeks with bullish candles or increased volume.
Happy Trading,

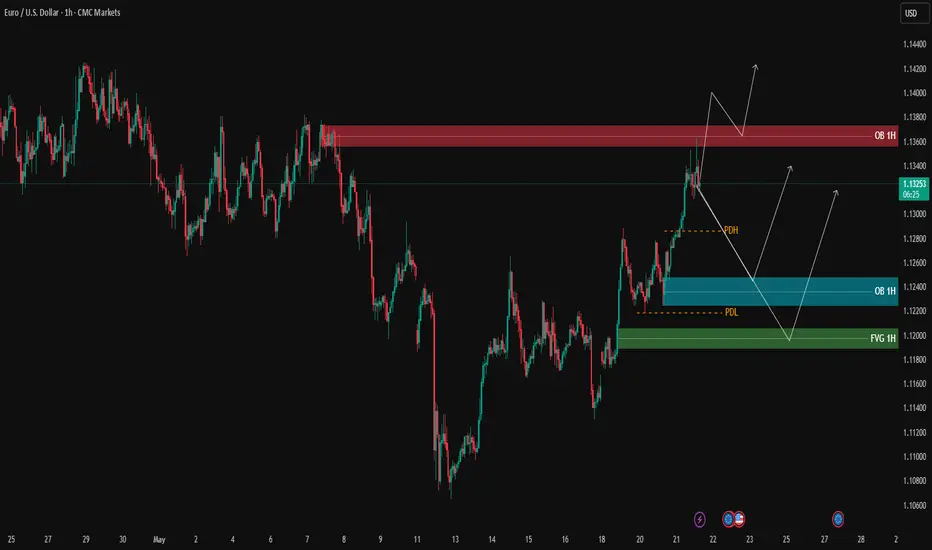
EURUSD – Testing 1H Supply Zone, Awaiting Confirmation | ProfitaAfter a strong bullish rally breaking previous highs, EURUSD is now reacting to the 1H supply zone (OB 1H) marked in red.
We’re seeing an initial bearish rejection from this zone. If sellers maintain control, price may retrace toward the lower demand areas:
Blue OB 1H zone (1.12200 – 1.12450)
Green FVG 1H further below
However, if buyers manage to push price above the red OB and close a candle above it, continuation to the upside remains a valid scenario.
📌 Key Levels
🟢 Support Zones:
1.12200 – 1.12450
1.11780 – 1.12000
🔴 Resistance:
1.13500 – 1.13800
⚠️ Note:
Watch for lower-timeframe (M5/M3) confirmations for entry. Only act on clear setups inside the zones.
🔍 Insight by ProfitaminFX
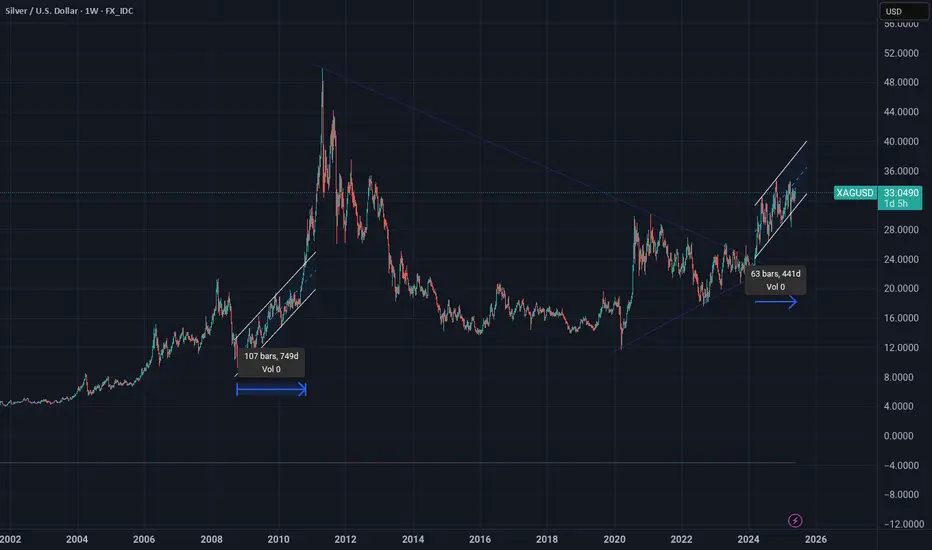
Silver following a similar channel back in 2008I was looking at silver and noticed that it's currently in a channel similar to one that started in late 2008 and went on for about 749 days before it rocketed to new highs.
USDCHF - Bulls Are Almost Ready! Are You?Hello TradingView Family / Fellow Traders. This is Richard, also known as theSignalyst.
📈USDCHF has been overall bullish trading within the rising channel marked in blue.
Moreover, the green zone is a strong support and structure!
🏹 Thus, the highlighted blue circle is a strong area to look for buy setups as it is the intersection of support and lower blue trendline acting as a non-horizontal support.
📚 As per my trading style:
As #USDCHF is around the blue circle zone, I will be looking for bullish reversal setups (like a double bottom pattern, trendline break , and so on...)
📚 Always follow your trading plan regarding entry, risk management, and trade management.
Good luck!
All Strategies Are Good; If Managed Properly!
~Rich
Disclosure: I am part of Trade Nation's Influencer program and receive a monthly fee for using their TradingView charts in my analysis.

EURUSD - The Bears Are Getting Started!Hello TradingView Family / Fellow Traders. This is Richard, also known as theSignalyst.
📈EURUSD has been bullish trading within the rising blue channel.
However, it is currently retesting the upper bound of both red and blue channels.
🏹 The highlighted red circle is a strong area to look for sell setups as it is the intersection of the upper trendlines and orange resistance zone.
📚 As per my trading style:
As #EURUSD is around the red circle zone, I will be looking for bearish reversal setups (like a double top pattern, trendline break , and so on...)
📚 Always follow your trading plan regarding entry, risk management, and trade management.
Good luck!
All Strategies Are Good; If Managed Properly!
~Rich
Disclosure: I am part of Trade Nation's Influencer program and receive a monthly fee for using their TradingView charts in my analysis.

EURGBP new fall expecting
OANDA:EURGBP whats next, we are have break of DESCENDING TRIANGL, then its be created DESCENDING CHANNEL, which also is be breaked, now we have breaked and trend line.
Price currently is in zone. Expectations are to see break of zone and higher bearish fall.
SUP zone: 0.84600
RES zone: 0.83500, 0.83200

Cryptocurrency: Analyzing the Digital Asset RevolutionSince Bitcoin’s creation in 2009, cryptocurrencies have evolved from a niche tech experiment into a dynamic sector disrupting global finance. Grounded in decentralization and blockchain technology, cryptocurrencies aim to remove intermediaries and redefine money.
Key Characteristics
Decentralization: Operate on peer-to-peer networks, free from central authority.
Blockchain Technology: Immutable, transparent ledger ensures trust and security.
Tokenization: Real-world assets like real estate or art can be turned into digital tokens.
Market Dynamics
As of 2024, total crypto market cap exceeded $2.5 trillion.
Bitcoin remains the dominant asset, but Ethereum’s smart contract ecosystem has catalyzed massive growth across DeFi and NFTs.
Opportunities and Risks
Opportunities:
Financial Inclusion: Access for the unbanked via mobile wallets and stablecoins.
Innovation: Enabling decentralized apps, automated lending, and cross-border payments.
Risks:
Regulatory Uncertainty: Governments are actively evaluating oversight frameworks.
Volatility: Sudden price swings create high risk for investors.
Security: Hacks and scams continue to plague the sector, especially in DeFi.
Conclusion
Cryptocurrencies have launched a financial paradigm shift, but for mass adoption to take root, regulation, user protection, and scalability must mature.

GBPJPY - Important BreakdownHello Traders !
The GBPJPY failed to create a new higher high.
The price broke the support line!
So, I expect a bearish move📉
________________
TARGET: 190.680🎯

TAQA Arabia Egypt - To target 13.2 after crossing ResistanceDaily chart,
the stock EGX:TAQA is trading in a rising channel, the price reached the support and is supposed to rebound upwards to target the Resistance line R at around 13.25
Consider the new entry Buy above 12.25 (2 days close) for more safety, or buy in parts down to 12.0
Stop loss below 12.00 (for 2 days) should be considered.
Note:
Closing above the Resistance line R for 2 days, the next target will be 14.3 passing through resistance level at 13.5

4H, resistance and a little rebalance3350 is a n important zone if broken we may see more pumps, if rejected we continue cannel down. trendline alins with the imbalance ence rejectin will be very impactful

