CHANNAL PATTERN - KAJARIACERTechnical Analysis:
Current Price: ₹1,003.9
Target: ₹4,000. This is a very ambitious long-term target, implying a substantial increase.
"History Repeat Based": Identified a historical pattern that, if repeated, could lead to such a significant price move.
Time Frame: 1 Year to 3 Year (indicates a long-term investment horizon for the target).
Trendline Support and Parallel Channel Pattern: These are bullish technical indicators. Trendline support suggests that the stock is finding buyers at a certain level, preventing further declines. A parallel channel typically indicates a sustained trend within defined upper and lower boundaries; a breakout from such a channel can signify an acceleration of the trend.
Fundamental Analysis :
Market Cap: ₹15,984 Cr.
Current Price: ₹1,004
Stock P/E: 46.8 (Higher than the Industry P/E, indicating a premium valuation)
Key Fundamental Observations:
Valuation Premium: Kajaria Ceramics trades at a P/E of 46.8, which is higher than the industry P/E of 40.2. It is also significantly above its intrinsic value and Graham Number. This suggests the market is pricing in substantial future growth or recognizing its brand strength/market position.
Declining Profitability: The negative profit growth of -17.9% and the decline in EPS from the preceding year (₹26.5 down to ₹18.5) and also from the previous quarter (₹4.88 down to ₹2.67) are significant concerns. This indicates a recent slowdown or reversal in earnings.
Strong Financial Health: Very low Debt to Equity (0.10) is a positive sign of strong balance sheet management. ROCE (16.8%) and ROE (12.8%) are decent, but could be better given the high valuation.
Shareholding Pattern:
Promoters: Stable around 47.49% as of Mar 2025.
FIIs: Have decreased their stake from 23.38% (Mar 2017) to 15.79% (Mar 2025), with some fluctuations.
DIIs: Have consistently increased their stake from 5.76% (Mar 2017) to 27.68% (Mar 2025). This strong DII buying is a positive sign.
Public: Decreased from 23.47% (Mar 2017) to 9.06% (Mar 2025).
No. of Shareholders: Increased from 37,855 (Mar 2017) to 89,567 (Mar 2025), indicating increasing retail participation.
Balance Sheet:
Consistent Growth: Total Assets have steadily increased from ₹1,176 Cr (Mar 2014) to ₹3,756 Cr (Mar 2025). Total Liabilities have also grown but seem managed.
Reserves: Growing steadily from ₹514 Cr (Mar 2014) to ₹2,728 Cr (Mar 2025), indicating reinvested profits.
Borrowings: Have fluctuated but remained relatively low compared to overall size, reaching ₹274 Cr in Mar 2025.
Corporate Action & Latest News:
Recent news would primarily focus on the company's latest quarterly results (which, as per your data, show a decline in EPS and profit growth).
Any announcements regarding capacity expansion, new product launches, or market share gains would be relevant.
Given its position in the building materials sector, news on real estate demand, construction activity, and government infrastructure spending would impact its outlook.
Overall Assessment:
Technical analysis of Trendline Support and Parallel Channel Pattern suggests a bullish outlook for Kajaria Ceramics. However, the fundamental picture shows some conflicting signals:
Positive: Strong balance sheet with low debt, increasing DII participation, growing shareholder base, and a history of growth in assets/reserves.
Negative: High valuation (P/E above industry, above intrinsic value), and importantly, a significant negative trend in profit growth and EPS (both year-on-year and sequentially in the latest quarter).
Target of ₹4000 (1-3 years): This is an extremely ambitious target, requiring a nearly 4x increase from the current price. While "history repeat" can be a valid technical argument, it would require a significant turnaround in the company's profitability to fundamentally support such a valuation in the long term, especially given the current negative profit growth.
Conclusion:
While the technical patterns you've identified could indicate short to medium-term upward movement, the long-term target of ₹4000 seems very aggressive given the recent fundamental trends of declining profit and EPS. For such a target to be plausible, Kajaria Ceramics would need to demonstrate a strong and sustained turnaround in its earnings performance in the coming quarters/years.
Considerations:
Confirm Technical's: Ensure the trendline support and parallel channel patterns are clearly established and holding on the chart.
Monitor Fundamentals Closely: Pay very close attention to upcoming quarterly results. A reversal of the negative profit growth trend is essential to support higher valuations.
Risk vs. Reward: Evaluate the risk involved, especially with a stock trading at a premium valuation while showing declining profitability.
Parallel Channel

AUDCHF: Bearish Reversal Confirmed! 🇦🇺🇨🇭
AUDCHF may return to a global bearish trend.
A breakout of a support line of a rising parallel channel,
bearish CHoCH and a lower high on a daily indicate a changing market sentiment.
I think that the pair may drop lower soon.
Goal - 0.53
❤️Please, support my work with like, thank you!❤️
I am part of Trade Nation's Influencer program and receive a monthly fee for using their TradingView charts in my analysis.

GOLD - Price can rise a little and then fall to support areaHi guys, this is my overview for XAUUSD, feel free to check it and write your feedback in comments👊
Some days ago price grew in a rising channel, where it broke $2975 level and then rose to $3160 level, but next it corrected.
Price exited from channel and entered to triangle, where it made a strong impulse up.
Gold broke $3160 and $3345 levels, reached resistance line, and then made a correction movement, also making a first gap.
Next, price some time traded below $3345 level, and later it at the last time rose to resistance line and then drop.
After this, Gold made a second gap and then exited from triangle, after which it bounced from support level and started to grow.
Possibly, price can bounce from support line of triangle and then fall to $3125 support area.
If this post is useful to you, you can support me with like/boost and advice in comments❤️
Disclaimer: As part of ThinkMarkets’ Influencer Program, I am sponsored to share and publish their charts in my analysis.

Educational Video: Nifty Outlook-How Technical analysis is done.We have tried to draw a parallel channel on Nifty hourly chart. The chart indicates that we are just below the mid channel line. The mid channel line will act as a resistance if the price is below the same and will act as a support if the price is above it. Right now it is acting as a resistance. Top of the channel always acts as a resistance and bottom of the channel always acts as a support. Additionally there are historic resistances and supports which indicate the other levels which may act as support or resistance. There are also Mother and Father lines (50 and 200 EMA)(EMA = Exponential Moving Average).
To understand in detail how parallel channel works or how supports and resistance are derived or what is Mother, Father and Small Child theory. I would recommend you my book The Happy Candles Way to Wealth creation. By reading this book you can understand all these concepts with ease. You can additionally understand what is fundamental and technical analysis and how to do it. You will also get to understand the dos and the don'ts of investment in equity by reading various chapters on Behavioural Finance. Overall it is a value for money book available on Amazon in Paperback and Kindle version. The book is also available on Google play book and other E-book stores. You can also contact us for getting the copy of it. The Happy Candles way is one of the highest rated books in the category and you can go through the reviews of the book on Amazon before purchasing it.
Based on Parallel Channel, Supports and Resistances, Mother Father and Small child theory resistances and supports of Nifty remain at.
Nifty Resistances Remain at: 24815, 24909, 24977, 25045 and 25116. The channel top resistance for the current parallel channel is around 25372.
Nifty Supports Remain at: 24780 (Mother Line Support), 24679 and 24537. The Channel Bottom support is currently around 24396. 24247 is the most important Father line support.
Shadow of the candles currently is neutral. Indicating Nifty can still go in any direction. A pennant like structure (Triangle is also formed). This indicates that Breakout or Breakdown of this triangle or pennant can take Nifty a long way on either side. Nifty is currently squeezing in the pennant with limited space. Usually when the space is limited a Breakout can happen in either direction.
Disclaimer: The above information is provided for educational purpose, analysis and paper trading only. Please don't treat this as a buy or sell recommendation for the stock or index. The Techno-Funda analysis is based on data that is more than 3 months old. Supports and Resistances are determined by historic past peaks and Valley in the chart. Many other indicators and patterns like EMA, RSI, MACD, Volumes, Fibonacci, parallel channel etc. use historic data which is 3 months or older cyclical points. There is no guarantee they will work in future as markets are highly volatile and swings in prices are also due to macro and micro factors based on actions taken by the company as well as region and global events. Equity investment is subject to risks. I or my clients or family members might have positions in the stocks that we mention in our educational posts. We will not be responsible for any Profit or loss that may occur due to any financial decision taken based on any data provided in this message. Do consult your investment advisor before taking any financial decisions. Stop losses should be an important part of any investment in equity.

Parallel Channel and other Technicals Explained on a Nifty ChartWe have tried to draw a parallel channel on Nifty hourly chart. The chart indicates that we are just below the mid channel line. The mid channel line will act as a resistance if the price is below the same and will act as a support if the price is above it. Right now it is acting as a resistance. Top of the channel always acts as a resistance and bottom of the channel always acts as a support. Additionally there are historic resistances and supports which indicate the other levels which may act as support or resistance. There are also Mother and Father lines (50 and 200 EMA)(EMA = Exponential Moving Average).
To understand in detail how parallel channel works or how supports and resistance are derived or what is Mother, Father and Small Child theory. I would recommend you my book The Happy Candles Way to Wealth creation. By reading this book you can understand all these concepts with ease. You can additionally understand what is fundamental and technical analysis and how to do it. You will also get to understand the dos and the don'ts of investment in equity by reading various chapters on Behavioural Finance. Overall it is a value for money book available on Amazon in Paperback and Kindle version. The book is also available on Google play book and other E-book stores. You can also contact us for getting the copy of it. The Happy Candles way is one of the highest rated books in the category and you can go through the reviews of the book on Amazon before purchasing it.
Based on Parallel Channel, Supports and Resistances, Mother Father and Small child theory resistances and supports of Nifty remain at.
Nifty Resistances Remain at: 24815, 24909, 24977, 25045 and 25116. The channel top resistance for the current parallel channel is around 25372.
Nifty Supports Remain at: 24780 (Mother Line Support), 24679 and 24537. The Channel Bottom support is currently around 24396. 24247 is the most important Father line support.
Shadow of the candles currently is neutral. Indicating Nifty can still go in any direction. A pennant like structure (Triangle is also formed). This indicates that Breakout or Breakdown of this triangle or pennant can take Nifty a long way on either side. Nifty is currently squeezing in the pennant with limited space. Usually when the space is limited a Breakout can happen in either direction.
Disclaimer: The above information is provided for educational purpose, analysis and paper trading only. Please don't treat this as a buy or sell recommendation for the stock or index. The Techno-Funda analysis is based on data that is more than 3 months old. Supports and Resistances are determined by historic past peaks and Valley in the chart. Many other indicators and patterns like EMA, RSI, MACD, Volumes, Fibonacci, parallel channel etc. use historic data which is 3 months or older cyclical points. There is no guarantee they will work in future as markets are highly volatile and swings in prices are also due to macro and micro factors based on actions taken by the company as well as region and global events. Equity investment is subject to risks. I or my clients or family members might have positions in the stocks that we mention in our educational posts. We will not be responsible for any Profit or loss that may occur due to any financial decision taken based on any data provided in this message. Do consult your investment advisor before taking any financial decisions. Stop losses should be an important part of any investment in equity.

GOLD → Breaking of the downward trend structure...FX:XAUUSD is breaking out of the downward price channel and heading towards the zone of interest at 3346. A false breakout of resistance could trigger a correction before growth continues.
Gold is rising for the third day in a row and trading above $3,300 amid a weakening dollar and heightened geopolitical tensions. Investors are seeking refuge due to concerns about US fiscal policy, trade disputes with China, and a possible Israeli strike on Iran. Gold is also supported by expectations of a Fed rate cut and weak prospects for the dollar.
Technically, the price is heading towards the order block and resistance at 3345-3360. Since the opening of the session, the price has exhausted all its potential, and a retest of the key level may end in a false breakout and correction. However, based on the fundamental background, gold's growth may continue after the correction...
Resistance levels: 3346, 3360, 3409
Support levels: 3288, 3265, 3245
Gold has returned to the buy zone, but the fundamental background is unstable, and any weakening of economic risks could send gold back south. At the moment, the focus is on 3346-3360, with a false breakout likely to trigger a correction.
Best regards, R. Linda!


NZDCAD bearish expectations after RBA
OANDA:NZDCAD price action visible, price currently in ascending channel, moving zig-zag last two weeks, here after yesterday RBA, having bearish expectations.
Break of violet doted line can be taked for confirm.
SUP zone: 0.82700
RES zone: 0.81500

CADCHF: Pullback From Support 🇨🇦🇨🇭
There is a high chance to see a pullback from the underlined
daily horizontal support on CADCHF.
A formation of a high momentum bullish candle
after its test and a consolidation on an hourly time frame confirms
the strength of the buyers.
Goal - 0.595
❤️Please, support my work with like, thank you!❤️
I am part of Trade Nation's Influencer program and receive a monthly fee for using their TradingView charts in my analysis.

GBPUSD may correct after false breakout The currency pair has overcome a huge 0.8% or 110 points since the opening of the session, having wasted all the potential and is trying to test the resistance. The potential for breakout and continuation of growth may not be enough and the price may make a false breakout and correction before the second impulse to the intermediate high, where the scenario with correction may be repeated
Scenario: Breakout of 1.3402. No possibility to continue growth, return under the level and consolidation below the level - further sales.
It is possible that the price will consolidate above 1.34 and will head towards the far, strong level of 1.34425 from which a false breakout and correction can also be considered.

Long for a few pips to resistanceLong for a few pips to resistance before shorting if not broken if we see sine of breakout we might be heading to the ATH

$ADSK to $340 in Early Q2NASDAQ:ADSK is already a 100-Bagger stock.
A 16 year and 10 year linear regression channel show nearly identical baselines for NASDAQ:ADSK , indicating that the baseline - and deviations from the baseline - have been respected for that period of time, and whose boundaries are likely to continue to be respected.
Depending on the channel, NASDAQ:ADSK has either crossed above the baseline, or has reached it. Will it crash back down, or use it as support? Using the Multi VWAP indicator we see that over the past month the stock has blasted through every Anchored VWAP initiating from every major gap over the past year, as well as the biggest gaps of the past 3 years. This is bullish.
To crash back through the baseline of the regression channels and the anchored VWAPs considering that Autodesk has just recently recovering from a major crash seems less likely. Should the stock continue its trajectory and go to the top of the channel, it could hit $340 before in early Q3.

EURUSD Wave Analysis – 20 May 2025- EURUSD broke daily down channel
- Likely to rise to resistance level 1.1370
EURUSD currency pair continues to rise inside the minor impulse wave (3), which started earlier from the strong support level 1.1130 intersecting with the support trendline of the daily down channel from April.
The support level 1.1130 was strengthened by the 50% Fibonacci correction of the sharp upward impulse 5 from March.
Given the clear daily uptrend, EURUSD currency pair can be expected to rise to the next resistance level 1.1370 (which stopped the previous correction B).

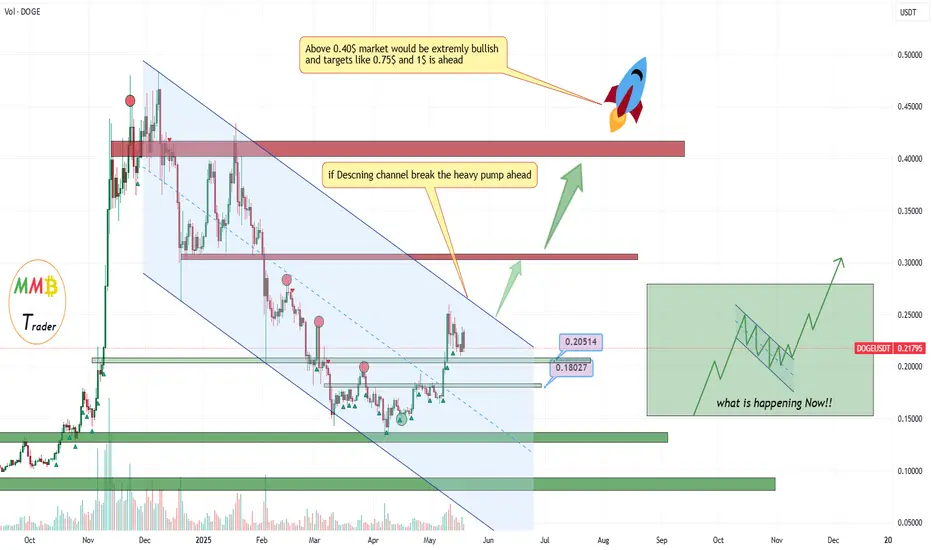
DOGEUSDT in Descending channel soon breakout and Pump As we know the descending channel in bull market appear and let the price rest for a while but this one dump the price as we can see and soon it will break to the upside and then more gain and even new high here is expected because market gain the power needed in this channel.
DISCLAIMER: ((trade based on your own decision))
<<press like👍 if you enjoy💚
Bitcoin vs Resistance Zones | Fake Breakdown Below the Channel!Bitcoin ( BINANCE:BTCUSDT ) has been moving up and down with high momentum over the past 24 hours and finally fell below the lower line of the ascending channel . Is this break of the lower line of the ascending channel valid?
Bitcoin is trading near the Resistance zone($105,100-$104,140) , Cumulative Short Liquidation Leverage($104,478-$103,941) . Since the volume of breaking of the lower line of the ascending channel is NOT high, the probability of a fake break is very high (in my opinion).
In terms of Elliott Wave theory , the structure of the main wave 4 seems to be an Expanding Flat(ABC/3-3-5) . The main wave 5 could lead to the formation of a new All-Time High(ATH ).
One of the reasons why I think we saw a Fake Break below the lower line of the ascending channel is that I think the S&P500 Index ( SP:SPX ) will trend upward , and given the high correlation between Bitcoin and S&P500 Index these days, we can expect Bitcoin to increase .
I expect Bitcoin to start rising again AFTER breaking the Resistance zone($105,100-$104,140) and touch the targets I have indicated on the chart.
Note: If Bitcoin touches $101,800, we can expect more dumps.
Please respect each other's ideas and express them politely if you agree or disagree.
Bitcoin Analyze (BTCUSDT), 1-hour time frame.
Be sure to follow the updated ideas.
Do not forget to put a Stop loss for your positions (For every position you want to open).
Please follow your strategy and updates; this is just my Idea, and I will gladly see your ideas in this post.
Please do not forget the ✅' like '✅ button 🙏😊 & Share it with your friends; thanks, and Trade safe.

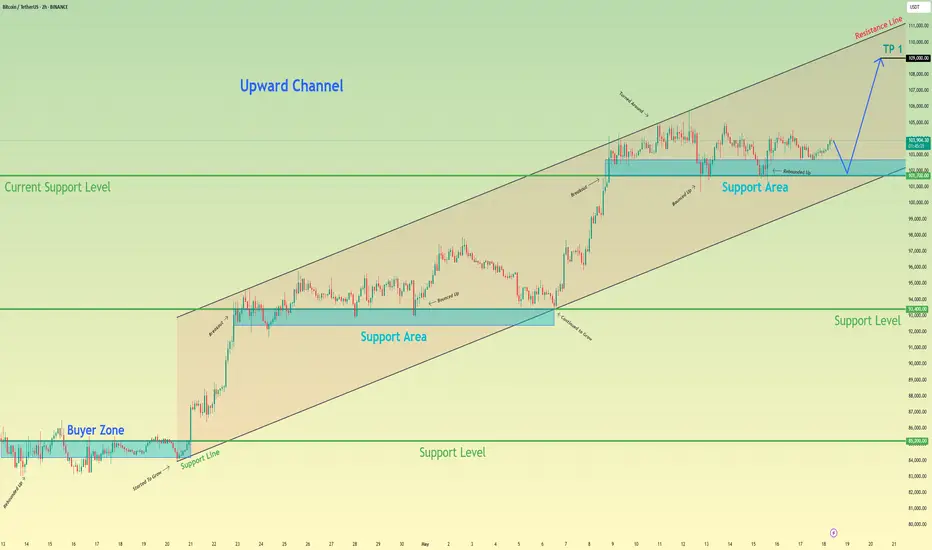
Bitcoin can continue grow in channel, after small correctionHello traders, I want share with you my opinion about Bitcoin. In this chart, we can see how the price remains inside a clear upward channel, respecting both support and resistance boundaries. After breaking above the 93400 - 92400 support area, the price continued to grow and formed a new support zone between 101700 - 102700 points. This area has been tested several times, showing strong buyer interest and keeping the bullish structure intact. Right now, BTC is hovering just above this support area. A minor correction down to this zone would be healthy and could provide fuel for the next upward leg. The market structure shows higher highs and higher lows, typical of a stable channel-driven trend. As long as the price stays above 101700 points, I expect it to move toward the upper channel boundary. That’s why my current target is set at 109000 points, which is the next key resistance and the top of the channel. This move would align with the current trend and follow the previous impulse-retracement pattern we’ve seen throughout this structure. Please share this idea with your friends and click Boost 🚀
EURO - Price can make small correction and then bounce upHi guys, this is my overview for EURO, feel free to check it and write your feedback in comments👊
Recently, price entered to falling channel, where it at once fell to $1.1330 level and then not long time traded near this level.
Next, price rose to resistance line of channel, and some time traded near, after which dropped.
Price broke $1.1330 level and started to traded below this level, and later it continued to decline in channel.
Later, Euro made a gap and then exited from channel, after which turned around and started to grow in a rising channel.
In this channel, price broke $1.1140 level and continued to move up until it reached resistance line.
Then price corrected, and now I expect that Euro can bounce up from support area to $1.1280 inside channel.
If this post is useful to you, you can support me with like/boost and advice in comments❤️
Disclaimer: As part of ThinkMarkets’ Influencer Program, I am sponsored to share and publish their charts in my analysis.

GOLD → Short squeeze before a drop to 3150?FX:XAUUSD is consolidating. The market needs a driver, but due to the unstable fundamental background, traders have switched to a wait-and-see mode. Consolidation could turn into strong movement at any moment. But in which direction?
Gold under pressure: the market is waiting for signals from the Fed and negotiations. The dollar is putting pressure on the market amid expectations of trade negotiations with India, South Korea, and Japan, as well as statements from the Fed.Earlier, the metal was supported by the weak dollar after Moody's downgraded the US credit rating, but growing interest in risky assets and hopes for peace between Russia and Ukraine reduced demand for gold. Key factors — negotiations and comments from the Fed — will continue to influence the dynamics of the dollar and gold.
Technically, the price is in a downtrend and within consolidation. A breakout from consolidation could be accompanied by strong momentum, but I believe that there will be no countertrend movement and that a retest of resistance could end in a decline...
Resistance levels: 3265.5, channel resistance
Support levels: 3206, 3153
The most likely scenario within the bearish trend is a short squeeze and a downward breakdown from the triangle (the fundamental background and economic risks are slowly but surely declining, and gold may lose value). A false breakout of 3250-3265 could trigger a continuation of the trend towards 3150-3120.
Best regards, R. Linda!

MarketBreakdown | USDJPY, EURAUD, NZDJPY, CADCHF
Here are the updates & outlook for multiple instruments in my watch list.
1️⃣ #USDJPY daily time frame 🇺🇸🇯🇵
The pair demonstrates clear strength of the sellers.
The price went way below a recently broken resistance.
With the absence of impactful fundamental news,
the market may continue falling for now.
2️⃣ #EURAUD daily time frame 🇪🇺🇦🇺
The market is trading within a wide falling parallel channel on a daily.
Its upper boundary is a strong vertical resistance.
I will look for selling from that.
Alternatively, its bullish breakout may push the prices much higher.
3️⃣ #NZDJPY 4H time frame 🇳🇿🇯🇵
Before an Australian interest rate decision at night,
the pair acted strongly bullish, following our plan.
I see a nice double bottom pattern and a confirmed bullish Change of Character CHoCH.
I think that growth will resume soon
4️⃣ #CADCHF 4H time frame 🇨🇦🇨🇭
The price formed a nice bullish flag pattern.
I am waiting for its bullish breakout to confirm a start
of a new bullish wave.
A candle close above its upper boundary will validate the violation.
Do you agree with my market breakdown?
❤️Please, support my work with like, thank you!❤️

PENDLEUSDT → Resistance retest. One step away from distributionBINANCE:PENDLEUSDT is preparing for distribution after a prolonged consolidation. The price is testing a key resistance level, which, if broken, will trigger a rally...
The coin is breaking through the flat resistance and consolidating above the upper border of the range. The key level is 4.400. If the bulls hold their ground above this level, the growth may continue.
Bitcoin is showing bullish dynamics, which supports the altcoin market. The bullish trend may continue in altcoins as well. Pendle may move from consolidation to distribution.
Resistance levels: 4.32, 4.400
Support levels: 4.024, 3.622
If the coin manages to consolidate above the key resistance level, thereby confirming the breakout, the price may move to aggressive growth. In this case, the target could be 4.800.
Best regards, R. Linda!

AVAX/USDT Potential UpsidesHey Traders, in today's trading session we are monitoring AVAX/USDT for a buying opportunity around 21.00 zone, AVAX/USDT is trading in an uptrend and currently is in a correction phase in which it is approaching the trend at 21.00 support and resistance area.
Trade safe, Joe.

Ripple is Nearing The Daily TrendHey Traders, in today's trading session we are monitoring XRPUSDT for a buying opportunity around 2.28 zone, Ripple is trading in an uptrend and currently is in a correction phase in which it is approaching the trend at 2.28 support and resistance area.
Trade safe, Joe.

GOLD → Retest of trend resistance before declineFX:XAUUSD is recovering amid uncertainty, but there is a fairly strong resistance zone ahead that could hold back growth and trigger a decline...
Since the opening of the session, the price has recovered slightly after a week-long decline. Growth is being held back by two-sided risks: on the one hand, pressure on the dollar and Moody's downgrade of the US credit rating are supporting the metal, while on the other hand, high bond yields and possible US trade agreements are limiting growth.
Investors are awaiting new statements from the Fed and are monitoring US negotiations with key partners. Amid concerns about fiscal stability and weak economic data, gold may remain in positive territory, but positive trade news could turn it down again.
Resistance levels: 3257, 3265
Support levels: 3206, 3153
A false breakout of the specified resistance will confirm the inability to continue growth. Consolidation after a false breakout of 3257 - 3265 below 3257 could trigger a reversal and a fall to areas of interest...
Best regards, R. Linda!
