CPNG (South Korean Amazon)Sitting above IPO anchored VWAP and Daily/Weekly key moving averages (50,200) and is currently in an uptrend if we can get a weekly close above the previous resistance zone at 27.12 it is looking pretty bullish. If we break the $27.12 the next target would be 30.80 where previous weekly rejections. If close above the next target is 1.618 fib of $38.31
Parallel Channel

EURUSD - Shift In Momentum Confirmed!Hello TradingView Family / Fellow Traders. This is Richard, also known as theSignalyst.
📈After breaking below the structure marked in orange, EURUSD's momentum has been shifted from bullish to bearish.
EURUSD is currently rejecting the upper bound of its falling channel marked in red.
Moreover, it is retesting the orange structure.
🏹 Thus, the highlighted red circle is a strong area to look for sell setups as it is the intersection of structure and upper red trendline acting as a non-horizontal resistance.
📚 As per my trading style:
As #EURUSD is around the red circle zone, I will be looking for bearish reversal setups (like a double top pattern, trendline break , and so on...)
📚 Always follow your trading plan regarding entry, risk management, and trade management.
Good luck!
All Strategies Are Good; If Managed Properly!
~Rich
Disclosure: I am part of Trade Nation's Influencer program and receive a monthly fee for using their TradingView charts in my analysis.

HelenP. I Bitcoin will fall to support zone and then start riseHi folks today I'm prepared for you Bitcoin analytics. This chart shows how the price continues to trade inside a rising channel, with the price currently hovering just above the support zone around 101000. After forming a clean consolidation phase near the upper boundary of the structure, the market is showing signs of a potential pullback toward this zone. However, the broader trend remains bullish, and as long as price holds within the ascending formation, this correction may act as a base for the next move higher. The consolidation structure formed at the top indicates that buyers are not rushing in aggressively, but they are also not allowing prices to drop sharply, a classic sign of accumulation. This aligns well with the previously confirmed trend line and horizontal support zone. If BTC holds this area and finds renewed momentum, I expect a breakout from the consolidation range to the upside. My goal remains at 107000 points, which sits a little higher than the projected top of the current channel. Given the strength of the structure, the higher lows, and the recent defense of support, I maintain a bullish bias and anticipate another upward wave from this level. If you like my analytics you may support me with your like/comment ❤️

Gold can correct to support line of channel and then start growHello traders, I want share with you my opinion about Gold. In this chart, we can see how the price, after forming a triangle structure and breaking out to the upside, Gold entered a downward channel, where it has been consistently respecting both the resistance and support lines. Each bounce from the lower boundary of this channel signals local buyer interest, especially near the support level around 3060, which also overlaps with the buyer zone. Recently, the price rebounded from this support line, indicating a potential start of a bullish correction inside the channel. This move is consistent with past price behavior, strong impulses from the bottom boundary followed by gradual movement toward the upper resistance line. Given the structure and the ongoing bounce, I expect Gold can correct the support line of the channel, after which it turns around and starts to grow to the 3290 resistance level, which aligns with the upper boundary of the pattern and the beginning of the seller zone. That’s why my TP 1 is set at 3290 points - a reasonable technical target within the current channel formation. Please share this idea with your friends and click Boost 🚀
Disclaimer: As part of ThinkMarkets’ Influencer Program, I am sponsored to share and publish their charts in my analysis.

Lower Parallel Channel/Trendline tested again, 3rd time a charm?NOTE : I am not an expert trader by any means, I am open input and sharing my ideas. I am still learning this is my second time.
*************************************
DAILY
Price is consolidating or ranging
*************************************
4 HOUR
- Price seen between support and resistance
(DOWN/BEAR)
- Parrallel channel seen:
---- its height is around 5000 pips. a little more. (that i was able to measure)
---- with this being the 3rd test to its bottom line,, still hoovering in the lower channel, which could be bearish. however, it is looking like a rejection (as it is loosing momentum, and a doji is forming and likely to close as so.
---- yet, the channel is sell/short pattern. so next few candles may come with the moment and still turn, to go down
*************************************
In contrast (UP/ BULLS)
- Ukraine is about to begin to use btc as its national assest and an answer for that is pending soon. ( price will go up b/c this is good for this pair)
- two fake-outs seen at support
- the channel could continue sideways and actually go up
- or the channel will soon be invalidated, moving up, breaking thru top channel line.
*************************************
Right now, most technical indications are neutral, a this time for this pair. So lets wait and see.
*************************************
Happy trading.
Open to comments and advice.
*************************************

BDP. Deep Underrated Value.Market veteran and remains in business - building, researching for five years. The chart is global - weekly and a global downward channel is visible, in which the price can move x50 - amazing. Possible channel breakout will send the price to x360 and capitalization to 500 million, which is not unattainable given the niches in which the project positions itself. Me in game, sirs, prepare.

EURCAD: Another Bearish Pattern 🇪🇺🇨🇦
Earlier, we spotted a head & shoulder pattern on EURCAD on a daily
and a confirmed breakout of its neckline.
Analysing a price action, I spotted another bearish formation today.
The price formed a bearish flag pattern, and it is retesting a broken
trend line at the moment.
I think that the pair may drop lower soon.
Next support - 1.5503
❤️Please, support my work with like, thank you!❤️
I am part of Trade Nation's Influencer program and receive a monthly fee for using their TradingView charts in my analysis.

XRP is so BACK!Hello TradingView Family / Fellow Traders. This is Richard, also known as theSignalyst.
As per our last XRP idea, attached on the chart, it rejected the lower green structure and surged by over 25%.
📈XRP is now bullish long-term trading within the rising channel marked in blue.
Moreover, the upper green zone is a strong structure!
🏹 Thus, the highlighted blue circle is a strong area to look for buy setups as it is the intersection of structure and lower blue trendline acting as a non-horizontal support.
📚 As per my trading style:
As #XRP retests the blue circle zone, I will be looking for bullish reversal setups (like a double bottom pattern, trendline break , and so on...)
📚 Always follow your trading plan regarding entry, risk management, and trade management.
Good luck!
All Strategies Are Good; If Managed Properly!
~Rich

NZDJPY may end its rally with a correctionNZDJPY almost without pullbacks, with one impulse forms a strong fall. The potential is starting to run out and the market will need a breather. The current wave may test the zone of interest at 85.268 and move into the correction phase
The price is ready to test the strong support at 85.268, the limit level is most likely still in the market and may hold the support area and thus trigger a correction and pullback to 0.5 fibo
Scenario: fall to 85.268, false breakdown and rebound to the first zone of interest (imbalance) 86.500

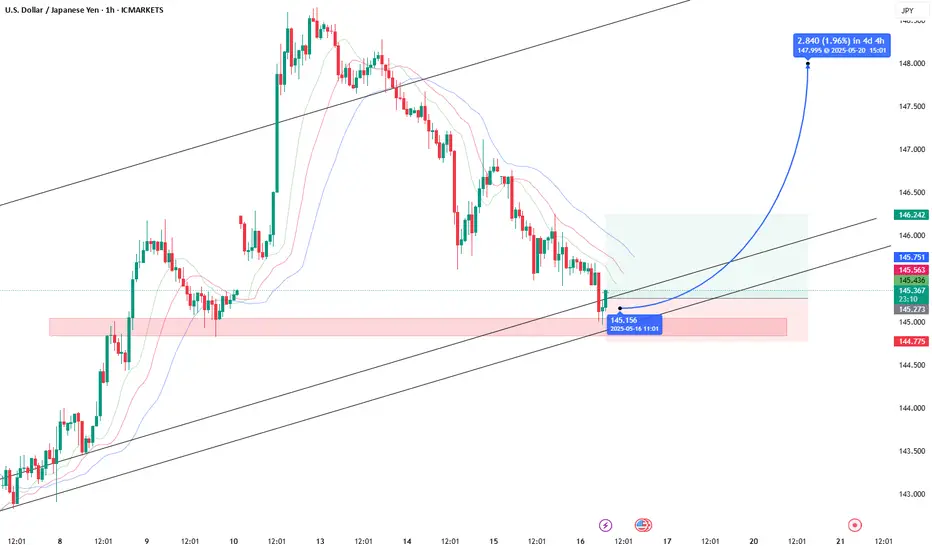
USD looks performing against JPYUSD looks to be performing against JPY, I expect it to go up to 147-148
Bitcoin at PRZ! Is This the Calm Before a Drop?As I expected in yesterday's idea , Bitcoin ( BINANCE:BTCUSDT ) started to rise from near the Support line and hit the Target .
Bitcoin is trading near the Potential Reversal Zone(PRZ) , the upper line of the ascending channel(minor) , and the Resistance line .
In terms of Elliott Wave theory , it seems that Bitcoin has successfully completed the microwave B of the main wave 4 in the ascending channel(minor). A break of the lower line of the ascending channel(minor) could be a sign of the completion of this wave. The corrective structure of the main wave 4 so far could be a Zigzag(ABC/5-3-5) .
I expect Bitcoin to drop to at least $100,923 AFTER breaking the lower line of the ascending channel(minor) and breaking the Support line, the next target could be the lower line of the ascending channel(major) .
Cumulative Short Liquidation Leverage: $106,943-$105,913
Cumulative Short Liquidation Leverage: $105,525-$104,500
Cumulative Long Liquidation Leverage: $100,763-$99,774
Note: If Bitcoin goes above $105,300, we can expect more pumps.
Note: If Bitcoin touches $99,400, we should expect further declines.
Please respect each other's ideas and express them politely if you agree or disagree.
Bitcoin Analyze (BTCUSDT), 1-hour time frame.
Be sure to follow the updated ideas.
Do not forget to put a Stop loss for your positions (For every position you want to open).
Please follow your strategy and updates; this is just my Idea, and I will gladly see your ideas in this post.
Please do not forget the ✅' like'✅ button 🙏😊 & Share it with your friends; thanks, and Trade safe.

GOLD → Correction ahead of news. Will the decline resume?FX:XAUUSD has been buying back all the losses from the Asian and Pacific sessions since the opening of the European session, but this looks more like a catapult being loaded...
GOLD broke through the global consolidation base of 3200, which only confirmed the bearish market structure. Investors are waiting for PPI and retail sales data in the US, as well as Fed Chair Powell's speech.
Expectations of fewer Fed rate cuts and optimism surrounding trade talks with China and South Korea continue to weigh on gold. However, weak macro data and a growing US budget deficit could revive interest in this safe-haven asset.
GOLD is in a correction phase and is heading towards the zone of interest: the liquidity zone and previously broken support of global consolidation.
Resistance levels: 3187-3190, 3200
Support levels: 3123, 3100
Gold may test the indicated resistance, but based on the nature of the market, this situation may end in a false breakout and a fall. Target 3123 - 3100.
However, unpredictable data may temporarily change the market, which could lead to momentum towards 3220-3230.
Best regards, R. Linda!

History repeats itselfOANDA:EURUSD
Here’s a technical analysis of the higher timeframes, specifically the monthly chart for EUR/USD.
As clearly visible, price action is currently moving within a respected descending channel. The saying "history repeats itself" seems particularly relevant here, especially in the context of Trump’s presidency. While this topic has been discussed frequently, I wanted to highlight the striking similarities once again.
The current market cycle closely mirrors the previous one from 2016-2017 — in terms of structure, timing, and volume. At present, we appear to be in the distribution phase, which is far from complete.
It’s quite plausible that we may see further downside before another significant move to the upside begins. If we take the 2017 distribution phase as a reference (lasting approximately 300 days), the current phase has only been unfolding for around 80-100 days.
Of course, there is no guarantee that price will rise again — but I consider it very likely that this market cycle has not yet fully played out. Technical analysis on higher timeframes often provides stronger probabilities and a clearer picture of the overall trend.
On the right-hand side of the chart, I’ve marked a weekly imbalance (not directly visible on the monthly chart), which aligns with the 50% retracement level of the Fibonacci tool. I view this confluence as a strong potential entry for a swing trade targeting the upper boundary of the descending channel.
This outlines my current trading outlook.

GOLD → One step away from a bullish trend reversalFX:XAUUSD is emerging from the local corrective channel “flag.” Pre-breakdown consolidation relative to the base of the reversal pattern continues. All eyes are on 3200...
Gold is losing ground amid trade optimism and a strong dollar. The price is falling at the start of Wednesday as traders take profits after a rise from weekly lows. Weaker-than-expected US inflation has not justified expectations, but the Fed's refusal to cut rates soon is weighing on the metal. Optimism surrounding new trade agreements between the US and China, the UK, and other countries, as well as hopes for peace talks between Russia and Ukraine, are reducing demand for gold as a safe-haven asset.
Technically, the overall situation looks bearish. There is no deep pullback from support, which means pressure from sellers in the market. Consolidation is forming before an attempt to break through the 3200 level.
Resistance levels: 3243, 3257, 3269
Support levels: 3222, 3200
If the price continues to consolidate in the current local range and continues to attack support at 3222-3200, then in the short and medium term, we can expect the decline to continue. However, knowing the tricks of MM, the price may form a short squeeze relative to local resistance zones before falling further.
Best regards, R. Linda!

NZDJPY → Countertrend correction and false breakoutFX:NZDJPY is testing resistance within a global downtrend. The currency pair is not yet ready to continue its growth and is forming a local reversal pattern.
Within the global downtrend, the currency pair is forming a countertrend correction and testing resistance at 87.400. The liquidity pool formed above this level is not yet ready to let the price move further. Without the possibility of continuing growth, the price returns to the range and forms a false breakout of resistance. However, since we are in the range and the price has returned inside it, if the bears hold the line (the upper limit of the trading range) at 87.400, this could trigger a further decline, thereby continuing the global downtrend.
Resistance levels: 87.400
Support levels: 86.5, 85.26
Consolidation of the price below 87.400 will confirm that the price is not yet ready to continue the trend. The falling dollar index is provoking a rise in the Japanese yen, which may also put pressure on the currency pair.
Best regards, R. Linda!

EURO - Price can continue to decline in falling channelHi guys, this is my overview for EURO, feel free to check it and write your feedback in comments👊
Not long ago, price entered to pennant, where it at once made an impulse up and broke $1.0820 level.
Then price rose to resistance line of a pennant and then corrected to support area, where it later reached the support line.
Next, Euro made an upward impulse, thereby exiting from the pennant pattern and breaking $1.0820 level again.
Price made a small correction and then rose higher than $1.1270 level, breaking it, but later started fall in falling channel.
In channel, Euro broke $1.1270 level one more time and fell to support line, after which rose almost to this level.
Now, I expect that price can rise to the resistance line and then continue to fall in a falling channel to $1.0960
If this post is useful to you, you can support me with like/boost and advice in comments❤️

W / USDT Main trend. 23 03 2025Logarithm. Time frame 3 days. Descending channel, price in local clamping in consolidation at dynamic support of the internal channel. From listing -94% at the moment.
Local percentages, medium-term and long-term to key zones of chart logic and liquidity, are shown on the chart as a guide for building your tactics and risk control.
🔴 There is potential for a decline to external support of a large descending channel (optional). I showed this option for building tactics and money management. Such assets in terms of liquidity, as a rule, decrease by 96-98%
🟢 If, from this price clamp, the price goes up , then the first resistance is the dynamic resistance of the internal channel (from which there may be a local reversal). Then the external (similarly). If the trend breaks and exits the descending channel, then strong resistance is the previous consolidation of 0.24-0.36
Locally, this clamping zone looks like this.

USDCHF 30min | Fibonacci + Order Block Combo Reversal Setup💵 USDCHF 30-Min Smart Money Breakdown — May 14, 2025
This is a prime example of a multi-confluence reversal trade. Let’s walk through this sniper setup:
🔍 1. Market Structure & Context
Price has been flowing within a solid descending channel
We just witnessed a sharp impulse leg downward, now reacting from a key demand area
Channel bottom + OB + fib = confluence stacker heaven
🧱 2. Zone Confluence
Price taps into a high-probability Order Block (highlighted purple)
Lining up with the 61.8% fib retracement, one of the most powerful golden pockets
Immediate reaction seen with bullish wick rejection — evidence of smart money stepping in
📈 3. Entry Logic
Entry: Around 0.83350
SL: Below 0.83200 (protected under 70.5%)
TP: Near 0.84700
RRR ≈ 1:5+ — perfect for prop firm funded traders or swing-style scalpers
🔁 Management & Outlook
Key confirmation = break above midline channel
Scale out at 0.83700 (50% fib), then trail SL for runners
If price rolls back under 0.83200, it may seek the 79% or deeper liquidity zone
💡This type of setup is what separates reactive traders from anticipatory Smart Money traders. You’re not chasing—you're waiting in the kill zone.
💬 Comment “🔥” if you’d take this setup.
🔁 Repost if you love OB + Fib sniper logic.
📲 Follow @ChartNinjas88 for next-level breakdowns.

TIA SIGNALSHello friends
As you can see, this currency has a beautiful chart and the technical analysis we did is that if the valid resistance is broken, we can open a buy trade with capital and risk management and move with it to the specified targets.
*Trade safely with us*

GOOD POINT Hello friends
As you can see, the price has fallen to the bottom of the next channel with the channel break and now the important point is to see if the price is supported considering reaching the bottom of the channel and the important Fibonacci support?
To solve this issue, we suggest you buy stepwise, of course with capital and risk management...
*Trade safely with us*

EURUSD LIVE TRADEHello friends
Given the formation of an ascending channel and the price rebounding from the bottom of the channel, we can trade with risk and capital management.
*Trade safely with us*

USOIL UPDATEHello friends
Given the recent growth in oil prices, it is natural for the price to correct. Now we have obtained the most important price support areas for you and we have also specified the target. If you are willing to enter the transaction, be sure to observe capital management.
*Trade safely with us*

GOLD (XAUUSD): Detailed Technical Outlook & Trading Plan
As we discussed on the yesterday's live stream,
Gold is currently in a consolidation stage.
The price is stuck within a wide horizontal channel on a daily
and we see a test of its support at the moment.
With the absence of high impact news in the economic calendar,
I assume that a consolidation will continue and there is a high
chance to see a pullback.
Your confirmation signal will be a bullish breakout and a 4H candle close
above 3271 - upper boundary of the intraday horizontal range.
There will be a strong possibility of a rise to at least to 3320 level.
Alternatively, a bearish violation of a support of the range on a daily
and a daily candle close below that may trigger a further decline.
❤️Please, support my work with like, thank you!❤️
I am part of Trade Nation's Influencer program and receive a monthly fee for using their TradingView charts in my analysis.
