GOLD → Retest resistance before fallingFX:XAUUSD is forming a correction and retesting a strong resistance and liquidity zone within a downtrend. The global trend is one step away from a reversal...
Gold stabilized ahead of the release of US inflation data. After falling 3%, gold is holding steady at around $3,200, consolidating against a weaker dollar. Investors are awaiting US CPI data, which could set a new direction.
Optimism about the US-China trade agreement, geopolitical détente, and profit-taking on the dollar are holding back the price decline. The market is assessing how inflation data will affect Fed policy and demand for safe-haven assets.
Globally, the market doubts that the upward trend will continue, and there are reasons to look for points from which the price could start to fall sharply...
Resistance levels: 3269, 3284
Support levels: 3246, 3200, 3167
The news may cause a shake-up, but if there are no surprises, a false breakout of 3260-3270 and consolidation of prices in the selling zone could trigger a decline to 3200-3150.
Best regards, R. Linda!
Parallel Channel

SUIUSDT → False breakdown of support before growthBINANCE:SUIUSDT has entered a consolidation phase within a bullish trend. The chart shows a zone of interest and a trigger area that are worth paying attention to...
The coin looks quite positive. An upward trend is forming, which is also supported by the growth of Bitcoin and a relatively positive fundamental background.
Technically, SUI is consolidating between 4.110 and 3.811. Below the support level, a huge liquidity pool has formed, which has not yet been tested. There is a high probability of a false breakdown before the growth continues, but if the market turns out to be more aggressive, buyers may not let the price fall to 3.811, in which case we can consider a breakout of the resistance at 4.11-4.275 and consolidation of the price above these levels with the aim of continuing growth.
Support levels: 3.811, 3.667
Resistance levels: 4.11, 4.275
The movement of Bitcoin shows that the market is gathering liquidity as part of a local correction against the backdrop of a bullish trend. Yesterday, we all witnessed a local liquidation, but there are no reasons for a decline yet. SUI, in an ideal scenario, may test support at 3.811 and form a false breakdown before continuing to grow.
Best regards, R. Linda!

SOLUSDT may rise to 200.0 after long-squeezeMarket maker collected liquidity from 168.5 (liquidation of buyers, entry of sellers and subsequent liquidation of sellers)
After a false breakdown the price went up on a light wave
After the long squeeze, the price is already going to continue the trend with peace of mind.
Ahead is a strong resistance from D1 180 - 180.3.
A break of the level will attract buyers. The target may be 200 - 205
Scenario: a retest of the resistance may end in a small correction. If there is no reversal and the price continues to test 180-180.3, we can expect a breakout, which may attract buyers and further growth to 200 - 205.

BTC - New Short-Term Long!Hello TradingView Family / Fellow Traders. This is Richard, also known as theSignalyst.
📈BTC has been overall bullish trading within the rising channel marked in blue.
Moreover, the green zone is a strong demand and structure.
🏹 Thus, the highlighted blue circle is a strong area to look for buy setups as it is the intersection of structure and lower blue trendline acting non-horizontal support.
📚 As per my trading style:
As #BTC retests the blue circle zone, I will be looking for bullish reversal setups (like a double bottom pattern, trendline break , and so on...)
📚 Always follow your trading plan regarding entry, risk management, and trade management.
Good luck!
All Strategies Are Good; If Managed Properly!
~Rich

HelenP. I Bitcoin will continue to grow inside upward channelHi folks today I'm prepared for you Bitcoin analytics. The price has recently shown another confident bullish impulse, pushing higher within a clean ascending channel. The key moment was the breakout above the resistance zone, which had previously acted as a ceiling for the price. This breakout marked the continuation of a higher-high, higher-low sequence that confirms the strength of the ongoing trend. Then the market returned to retest this former resistance, now acting as support, and immediately bounced, reinforcing buyer control and validating the area as a foundation for the next move. Now BTC is holding firm in the upper half of the channel, maintaining its position above the trend line with little sign of weakness. This combination of sustained bullish structure, well-respected technical levels, and steady volume behavior suggests that the market is still preparing for higher levels. With the current structure and momentum, I expect BTCUSDT will continue its upward path within the channel. My goal is 108700 points, which aligns almost with the resistance line of the upward channel. If you like my analytics you may support me with your like/comment ❤️

Long. 1H Broke through Resistance retest and rally??Price just broke above resistance with strong momentum. There’s a Fair Value Gap (FVG) below that might get filled on a pullback. With CPI data out today, volatility could spike—watch for a potential retest before continuation either way.

Ethereum Is Quietly Preparing for a Massive Move !Hello Traders 🐺
In this idea, I want to show you one of the coolest charts I’ve ever seen in my life — seriously!
These kinds of patterns, especially on the monthly time frame, take multiple years to form, and that’s exactly why they are extremely valid. When a structure develops on higher time frames, we can rely on it more confidently and make smarter decisions 📊
As you can see on the chart, ETH price is moving inside a very clear ascending channel, and its reactions to the channel lines are simply beautiful. Let’s take a closer look:
In addition to the top and bottom of the channel, we also have a “make or break” level, shown by the blue dotted line (which is the middle line of the channel).
Price reactions to this line throughout different time periods have been amazing. And here's the more interesting part:
👉 Price is currently above the middle line, and on its way up, it’s approaching one of the most critical resistance levels — the orange descending trendline.
If we zoom out, we’ll see that ETH is actually squeezed between this descending resistance and the ascending channel's middle line, forming a beautiful triangle 🔺
If ETH can break above this triangle, we could see a massive surge, possibly taking price all the way up to the top of the channel, which in my opinion is somewhere around $15,000 🚀
Now let’s talk about RSI:
If you take a closer look at the RSI below the chart, you’ll notice a repetitive pattern.
Each time ETH enters a major bull run or makes a new all-time high, RSI touches the upper resistance in the overbought zone.
We’re still in the early stage of this cycle — and both technically and indicator-wise, there seems to be plenty of room to grow.
Hope you enjoy this idea — I’ll be happy to answer your questions in the comments below 👇
And as always, remember our golden rule:
🐺 Discipline is rarely enjoyable, but almost always profitable 🐺
🐺 KIU_COIN 🐺

Macro Group Egypt is expected to target 2.70 then 2.92Daily chart,
the stock EGX:MCRO price is drawing a rising channel pattern.
I expect the price will break out the resistance line R1; to target the line R2, then the line R3 at around 2.92
Some intermediate resistance levels are shown on the chart.
A new entry (buy) should be made after closing above 2.30
Stop loss below 2.20
Technical indicators:
RSI has a bullish trend line
MACD is positive

Is $BTCUSDT going to 91k ??This BINANCE:BTCUSDT chart reveals that Bitcoin has been trading within a clear ascending channel. This pattern typically suggests bullish momentum, with price making higher highs and higher lows. However, the most recent price action shows a decisive break down below the lower trendline of this channel. This breakdown suggests a potential shift in the short-term bias from bullish to bearish.
The setup strongly suggests a short trading opportunity. The breakdown from the ascending channel, coupled with the potential supply zone above, provides a bearish setup.
Entry: A potential entry point would be a retest of the broken lower trendline of the channel or within the highlighted red supply zone.
Target 1: The immediate target is the horizontal purple support level around 96,000.
Target 2: If the 96,000 support breaks, the next target would be the stronger horizontal yellow support level around 91,000.
Kindly support this analysis to enable it reach to other people, and do comment your thoughts.

USDJPY Wave Analysis – 12 May 2025- USDJPY broke the resistance area
- Likely to rise to resistance level 150.00
USDJPY currency pair continues to rise strongly inside the c-wave, which recently broke the resistance area between the resistance level 146.00 (top of the previous wave a), 50% Fibonacci correction of the downward impulse from March and the resistance trendline of the daily down channel from January.
The breakout of this resistance area accelerated the minor c-wave of the active ABC correction (2) from the end of April.
USDJPY currency pair can be expected to rise to the next resistance level 150.00 (target price for the completion of the active c-wave).

USDJPY / 1 DAY / BULLHello Guys;
My USDJPY target level is 147,500.
My target may come a bit late because this trade is a swing trade.
I would appreciate it very much if you do not miss your likes within the framework of Respect for Labor Thank you very much in advance

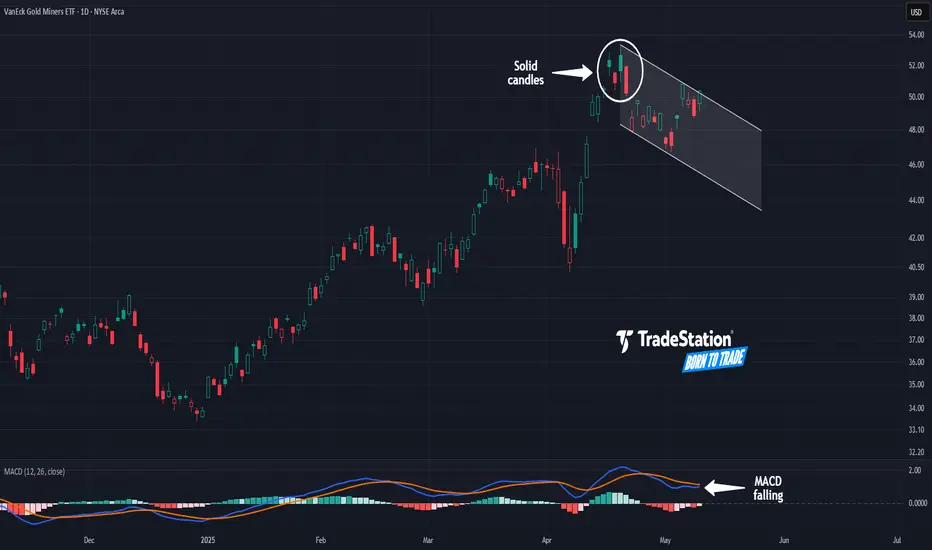
Gold Miners May Be FatiguedThe VanEck Gold Miners ETF had a major breakout in March, but some traders may think it’s getting fatigued.
The first pattern on today’s chart is the series of candles on April 16-22. Those bars occurred at the highest levels in almost four years. They’re also solid, illustrating that price wasn't able to hold the peaks.
Second, GDX fell sharply afterwards and made a lower high last week. That could mean April represented a peak. It could additionally suggest a new downward channel is taking shape.
Third, MACD is falling.
Next, gold and gold miners have benefited from the uncertainty caused by tariffs. Now, with signs of the trade war easing, some traders may find less appeal in the yellow metal.
Finally, GDX is an active underlier in the options market. (It averages more than 140,000 contracts per session, according to TradeStation Data.) That could help traders take positions with calls and puts.
Standardized Performances for the ETF mentioned above:
VanEck Gold Miners ETF (GDX)
1-year: +47.93%
5-years: +51.92%
10-year: +143.71%
(As of April 30, 2025)
Exchange Traded Funds ("ETFs") are subject to management fees and other expenses. Before making investment decisions, investors should carefully read information found in the prospectus or summary prospectus, if available, including investment objectives, risks, charges, and expenses. Click here to find the prospectus.
TradeStation has, for decades, advanced the trading industry, providing access to stocks, options and futures. If you're born to trade, we could be for you. See our Overview for more.
Past performance, whether actual or indicated by historical tests of strategies, is no guarantee of future performance or success. There is a possibility that you may sustain a loss equal to or greater than your entire investment regardless of which asset class you trade (equities, options or futures); therefore, you should not invest or risk money that you cannot afford to lose. Online trading is not suitable for all investors. View the document titled Characteristics and Risks of Standardized Options at www.TradeStation.com . Before trading any asset class, customers must read the relevant risk disclosure statements on www.TradeStation.com . System access and trade placement and execution may be delayed or fail due to market volatility and volume, quote delays, system and software errors, Internet traffic, outages and other factors.
Securities and futures trading is offered to self-directed customers by TradeStation Securities, Inc., a broker-dealer registered with the Securities and Exchange Commission and a futures commission merchant licensed with the Commodity Futures Trading Commission). TradeStation Securities is a member of the Financial Industry Regulatory Authority, the National Futures Association, and a number of exchanges.
Options trading is not suitable for all investors. Your TradeStation Securities’ account application to trade options will be considered and approved or disapproved based on all relevant factors, including your trading experience. See www.TradeStation.com . Visit www.TradeStation.com for full details on the costs and fees associated with options.
Margin trading involves risks, and it is important that you fully understand those risks before trading on margin. The Margin Disclosure Statement outlines many of those risks, including that you can lose more funds than you deposit in your margin account; your brokerage firm can force the sale of securities in your account; your brokerage firm can sell your securities without contacting you; and you are not entitled to an extension of time on a margin call. Review the Margin Disclosure Statement at www.TradeStation.com .
TradeStation Securities, Inc. and TradeStation Technologies, Inc. are each wholly owned subsidiaries of TradeStation Group, Inc., both operating, and providing products and services, under the TradeStation brand and trademark. When applying for, or purchasing, accounts, subscriptions, products and services, it is important that you know which company you will be dealing with. Visit www.TradeStation.com for further important information explaining what this means.
NZDUSD is preparing for a reversal and a fallNZDUSD is in consolidation and preparing to exit it. Ahead is possible breakout of trend support and fall to 0.5757
The reason is as follows: change of fundamentals background (positive signals on tariff war), dollar growth and market reversal.
Scenario: break of consolidation support at 0.5885, price consolidation below this level - this will be a signal ready to start distribution, i.e. downward movement.
Primary target 0.5 fibo, secondary target 0.7 fibo

GOLD - Price can break support level and continue to declineHi guys, this is my overview for XAUUSD, feel free to check it and write your feedback in comments👊
Recently price entered to triangle, where it at once bounced from support line, which coincided with support level.
Price rose to resistance line, breaking $3400 level, but soon turned around and dropped below, breaking this level again.
Next, Gold made a gap and continued to fall in a triangle, and later it reached $3215 level, after which bounced up.
Then price exited from triangle, rose to $3400 level and made fake breakout, after which started to decline in falling channel.
In channel, price fell to $3215 level, where at the moment continued to trades close and trying to break this level.
I think Gold can break this level and continue to fall in a falling channel to $3140
If this post is useful to you, you can support me with like/boost and advice in comments❤️

EURO - Price can break support level and continue to fallHi guys, this is my overview for EURUSD, feel free to check it and write your feedback in comments👊
A few moments ago price traded near $1.0835 level and then it made strong upward impulse, breaking this level.
Then it continued to move up inside an upward pennant, where it reached the next support level, which broke soon too.
After this movement, it reached the resistance line of the pennant and then corrected the support line.
Euro tried to grow more, but failed and started to decline inside falling channel, exiting from pennant pattern.
In falling channel, price declined to $1.1200 support level and then turn around and start to move up.
I think that Euro can grow a little and then fall to $1.1065 support line of channel, breaking support level.
If this post is useful to you, you can support me with like/boost and advice in comments❤️

MSTR (Strategy) coming up to $395, the smaller resistance levelNASDAQ:MSTR has rebounded from the bottom fairly fast compared to other stocks and indexes. It's even performed better than Bitcoin itself. However it should be hitting heavy resistance now near 395-400 and above is only heavier resistance. It's time for a pullback and a breather for MSTR. Target is the Point of Control near $350, before going higher. However we could turn bullish again before reaching $350
I personally know someone who played with fire by buying MSTR options calls while it was dropping before, meaning he was trying to catch a falling knife and got burnt finally. He lost nearly $500,000 because of it. So I don't mess with options personally, however I will margin trade with stocks and trade futures, forex and leverage trade cryptocurrencies.

BITCOIN TO $140KAccording to this weekly chart I have, bitcoin has a very important trendline that no one pay attention to, which gives us a very strong resistance about $134k to $140k , depends when bitcoin touch that, and I expect a big rejection from that area.

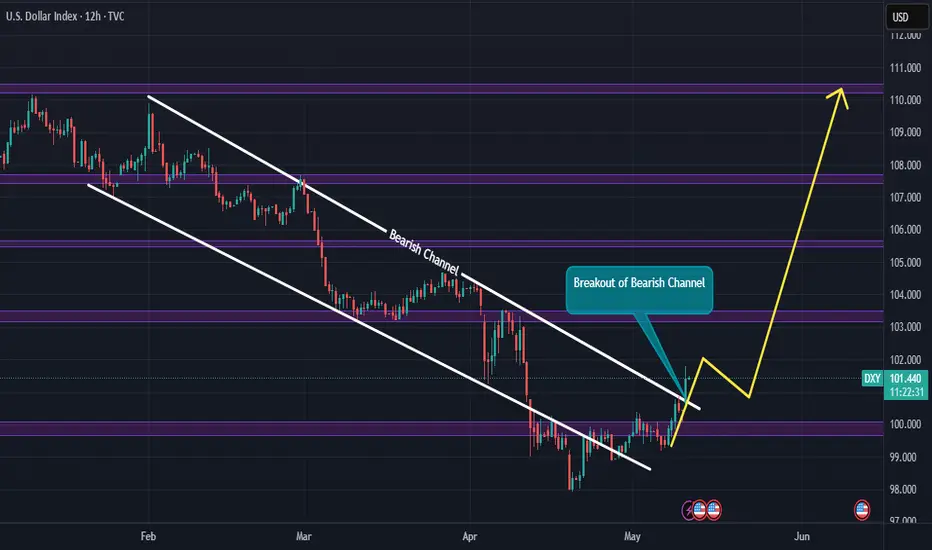
DXY Breaks out of long term Bearish ChannelThe Dollar Index TVC:DXY has finally broken out of a long term bearish channel and will most likely push back to top of the channel as Dollar Index strengthens. Expect a minor retracement to the bearish channel to gain momentum for the bullish move.
The financial market will likely experience many short positions/bearish moves on major FX pairs like AUDUSD, EURUSD, GBPUSD, NZDUSD, SGDUSD. Be on the lookout for such moves.
Kindly support this analysis to enable it reach to other people, and do comment your thoughts.
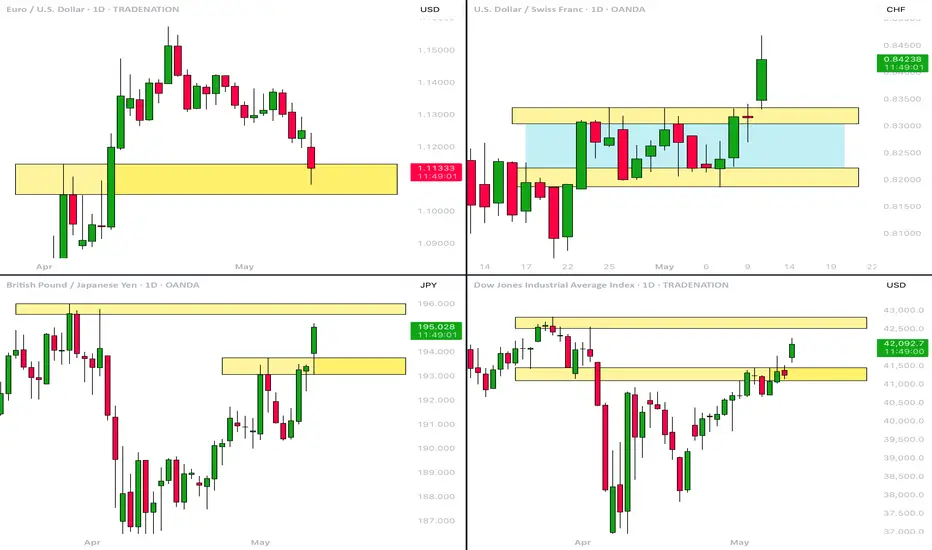
MarketBreakdown | EURUSD, USDCHF, GBPJPY, US30
Here are the updates & outlook for multiple instruments in my watch list.
1️⃣ #EURUSD daily time frame 🇪🇺🇺🇸
As I predicted, EURUSD dropped after the market opening.
The price is currently testing a significant daily demand zone.
Because the market looks relatively oversold after a selloff,
I think that there will be a high chance to see a pullback.
2️⃣ #USDCHF daily time frame 🇺🇸🇨🇭
The price completed a consolidation and a bullish accumulation
within a horizontal range on a daily.
Its resistance breakout is an important bullish signal.
Probabilities are high that the market will continue rising after a pullback.
3️⃣ #GBPJPY daily time frame 🇬🇧🇯🇵
The pair broke above a significant daily resistance cluster.
It opens a potential for more rise.
The market will most likely reach the underlined yellow resistance soon.
4️⃣ #US30 Index Dow Jones daily time frame 🇦🇺🇺🇸
The index successfully violated a major daily resistance.
Rise will continue and the market will reach the underlined
liquidity zone soon.
Do you agree with my market breakdown?
❤️Please, support my work with like, thank you!❤️
I am part of Trade Nation's Influencer program and receive a monthly fee for using their TradingView charts in my analysis.
AUD/USD On the weekly timeframe, AUD/USD approached a previously tested resistance zone around 0.63926, marked by prior price interactions. On the 1-hour chart, the price broke out above this level, signaling bullish momentum. On the 15-minute chart, a backtest of the breakout level occurred, with the price retesting the 0.63926 zone, now acting as support, before continuing upward.
Trade Plan:
Entry: Entered a buy trade at 0.64072 after the backtest confirmation.
Take Profit (TP): Targeting 0.64352, aligning with the next significant resistance level.
Stop Loss (SL): Placed at 0.63926, just below the breakout level, to protect against a false breakout.
Risk-Reward Ratio (RR): The distance to TP is 280 pips (0.64352 - 0.64072), and the distance to SL is 146 pips (0.64072 - 0.63926), yielding an RR of approximately 1:1.9.
This AUD/USD trade capitalizes on a breakout and backtest strategy, offering a structured setup with a favorable risk-reward ratio for potential upside.

EURJPY → Storming the resistance. Ready for the rallyFX:EURJPY is rising amid a stronger dollar and positive news about the de-escalation of the trade war. The currency pair is storming the resistance of the range.
The currency pair is forming a retest of resistance. A breakout and consolidation above 164.19 - 164.50 could support the market amid the dollar's growth.
The dollar is strengthening after positive news related to the de-escalation of the trade war. Against this backdrop, the Japanese yen is losing ground, which is generally affecting EURJPY.
A move above the key level will confirm a breakout of the resistance of consolidation, which could trigger a distribution phase...
Resistance levels: 164.19, 166.7
Support levels: 163.15, 162.38
The price has already entered the buying zone, meaning that resistance has been broken. All that remains is to wait for confirmation that the bulls are ready... Consolidation above 164.19 - 164.5 will confirm this, and in that case, we can expect distribution towards 166.7.
Best regards, R. Linda!


GJ ANALYSISGJ has been in a bearish channel for months. Currently price is bullish but it could still flip bearish based off where price is currently at. Also, I wouldn't be surprised if price retraces towards 195.600 area then flip bearish.
