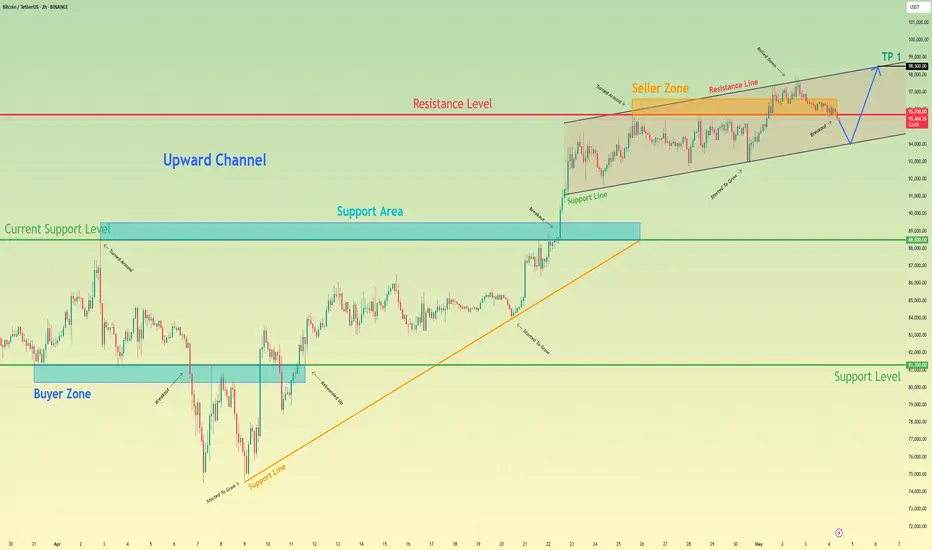
Bitcoin can bounce from support line of channel to 98500 pointsHello traders, I want share with you my opinion about Bitcoin. Looking at this chart, we can observe how the price of Bitcoin has been in recent price action. The asset had been confidently moving inside an upward channel, building structure through higher highs and higher lows. Each upward impulse was supported by pullbacks to the support line, showing continued buyer pressure. The latest breakout above the support area confirmed a bullish continuation, and the price entered the seller zone, where it faced resistance. Despite multiple attempts to break through, the price repeatedly turned around, forming a tight triangle pattern within the upper boundary of the channel. Currently, the price has broken down from the triangle, but it still holds above the channel's lower line. Given that the channel remains intact and there's no strong breakdown of the structure, I expect the price to rebound from the lower boundary and continue climbing toward my TP 1 at 98500, which aligns with the resistance line of the channel. Please share this idea with your friends and click Boost 🚀
Parallel Channel
HelenP. I Bitcoin may continue to grow inside upward channelHi folks today I'm prepared for you Bitcoin analytics. After bouncing from the lower boundary of the ascending channel and reacting strongly from the support zone near 92000, the price continues to respect the bullish structure. This level, which also aligns with the dynamic trend line, has acted as a powerful area of interest for buyers. Every touch to the trend line has resulted in a reversal to the upside, and this time may be no different. Previously, we saw a clear upward impulse that formed the base of the current trend channel. Then the market entered a consolidation with smaller pullbacks and held the 93000 zone with confidence. The recent retracement toward the trend line and support area is forming a higher low, which confirms buyer strength and sets the stage for another bullish leg. Given the strong support zone, the presence of an upward channel, and the steady bullish structure, I expect BTC to resume its upward move. My current goal is 99000 points. All elements signal bullish continuation. If you like my analytics you may support me with your like/comment ❤️

GOLD (XAUUSD): Your Plan to Buy
The recent fundamentals pumped Gold prices again.
The market is currently trading above a significant
daily resistance.
To confirm a validity of a breakout and to avoid a trap,
I suggest paying close attention to a minor horizontal
range on a 4H time frame.
Your signal to buy will be a 4H candle close above 3388.
It will confirm a breakout and increase the chances that the price will go up.
Goal will be 3435
❤️Please, support my work with like, thank you!❤️
I am part of Trade Nation's Influencer program and receive a monthly fee for using their TradingView charts in my analysis.

BTC is following a Rising Channle BTC is following a rising channel in the Daily timeframe, as shown in this chart.
BTC is also following a Cup n Handle Pattern in the Weekly timeframe.
I believe that before taking a bullish rally, it will take a small pullback up to 82K or 75 K.
At this stage, we will have to keep a keen eye on BTC movement to find a better bottom to enjoy this rally.
Please comment if you have a different idea or agree with me.

GOLD → Gold not ready to fall? What's going on?FX:XAUUSD is forming a local bottom and is not ready to continue falling. The price is breaking through the downward resistance amid a weakening dollar and a complicated fundamental backdrop.
At the beginning of the week, the price of gold stabilized above $3,250 as investors returned to defensive assets due to ongoing uncertainty surrounding US trade agreements with China and Japan, as well as growing geopolitical tensions in the Middle East and Ukraine.
The weakness of the dollar ahead of the Fed meeting and declining expectations of a rate cut are also supporting demand for gold. The focus remains on US trade news and the possible hawkish tone of the Fed this week.
Technically, the price is testing the bottom of the range as resistance. If there is no reaction to the false breakout and the price continues to storm 3268, then a breakout and consolidation above the level will allow it to strengthen to 3292-3314.
Resistance levels: 3269, 3294, 3314
Support levels: 3243, 3222, 3204
The price is forming a second retest of 3269 since the session opened. Buyers are testing resistance for a breakout. If the bulls break 3269 and consolidate above 3270, the chances for growth will be good. I do not rule out the possibility of a retest of the liquidity zone at 3243 before growth.
Best regards, R. Linda!

Your Move - All Time Quarterly Channel QQQNASDAQ:QQQ
Do we really have a setup allowing for tech to breakout out higher from this parallel channel?
Your call, I just draw the chart.

Price is on a downtrend - looking for selling opportunities...Price is currently on a downtrend and I'll be looking for selling opportunities at the descending resistance level - a breakout of this level may also push price higher to the main resistance level.

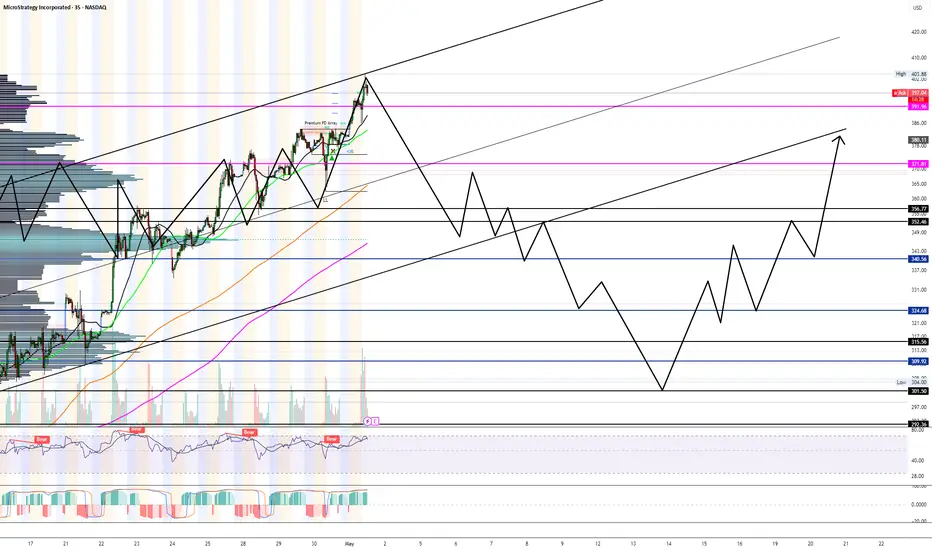
I think were due for bad earnings reaction for once.As seen in the chart, we are at the top of the range with highly over extended price movement and hitting the largest target number at $400 which has been sought after for months.
I think a snap down to $360-$350 is inevitable.
If we do pop up to $420+ then its a blow off top unless market reacts positively to government involvement to crypto.
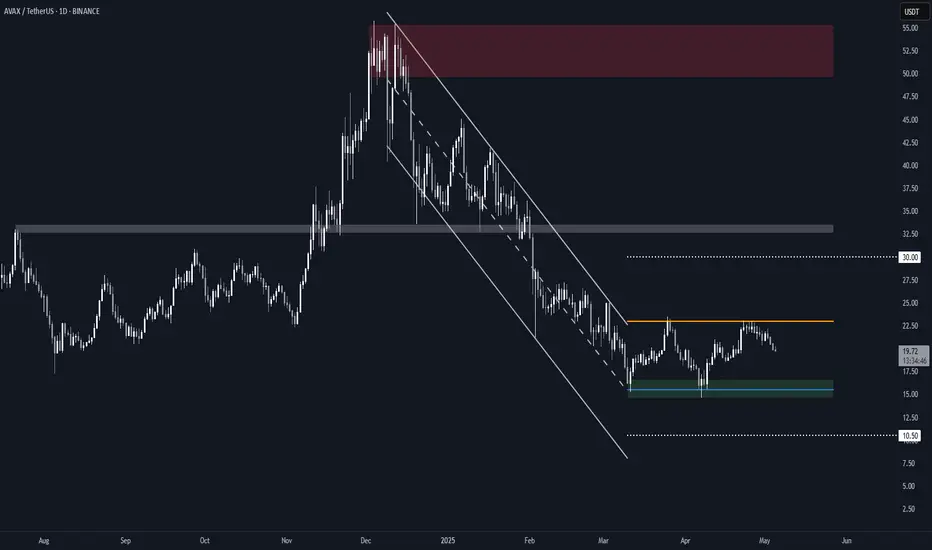
Avalanche (AVAX) RectangleBINANCE:AVAXUSDT is trading within a well-defined rectangle, after breaking out of a steep falling channel earlier this year.
Key Observations
• The current range has two clear touches on both support ($15.50) and resistance ($23.00), forming a valid rectangle structure.
• This follows a sideways channel breakout, suggesting a consolidation phase which is often a precursor to a larger move.
Range Levels
• Resistance – $23.00: Capped price twice in April, marking the upper bound of the rectangle.
• Support – $15.50: Held firmly on two separate pullbacks.
• Midrange Bias – As long as AVAX remains within this box, directional conviction remains limited.
Breakout/Breakdown Scenarios
• Bullish Breakout: If AVAX closes decisively above $23.00, the measured target would be ~$30, based on the rectangle height projected upward (linear scale).
• Bearish Breakdown: If it loses $15.50 support, the downside target becomes $10.50, calculated using the same rectangle height on log scale (to reflect proportional downside risk).
Until either side breaks, this remains a range-trading environment.
CRV Breakout Retest – Eyes on the Next Leg UpLSE:CRV has been trading within a well-defined ascending channel, showing a consistent bullish structure. Recently, the price broke above a key horizontal resistance level and is now retesting it—this is a classic breakout-retest scenario.
As long as CRV holds this support and remains within the channel, the bias stays bullish. A successful bounce from this zone could lead to a strong continuation toward the upper boundary of the channel or higher.
DYOR, NFA

BITCOIN → Correction to the risk zone. Rise or fall?BINANCE:BTCUSDT has updated its local maximum to 97,900, the market structure is quite positive, but still depends on the fundamental background and the behavior of the S&P 500.
The fundamental reasons that influenced the growth are the improvement in the tariff situation in the US and relations with China. Bitcoin's growth strengthened as the SP500 index rose, with which it has a fairly high correlation. In the second half of this week, the price broke out of the two-week consolidation, breaking through the resistance level of 95,500 and updating the local maximum. A correction is forming within the local upward channel.
95,000 is the liquidity and risk zone. That is, if the bulls hold their defense above 95K during the retest, Bitcoin will continue to grow in the short and medium term. Otherwise, a break of 95K could trigger a drop to 92K-88K.
Resistance levels: 97,425, 99,475
Support levels: 95,500, 92,000
All eyes are on the 95.5K support level, below which a huge liquidity pool has formed. Growth may be influenced by a retest (false breakout of support) and an imbalance of forces in the market. But we need to be careful, as the market will react to economic data. BUT! A return of prices to the selling zone (below 95000 - 95500) and the inability to continue growth could trigger a correction and liquidation.
Best regards, R. Linda!

SXPUSDT D1 Analysis | Rank : 264👀 Welcome to my Trading View Analysis and Trading Channel Here , we share the latest market analysis, trading signals, and key insights together .
Ready for smarter trades ? ⭐️
⚡️Today , we're going to analyze the SXP (Solar) coin together on the daily timeframe and find triggers for our positions .
The price chart has successfully broken out of the descending channel , signaling the end of the downtrend , and this breakout has been confirmed . Currently , the price is consolidating below a key horizontal resistance level , exhibiting back-and-forth volatility . At this stage , a bullish flag pattern is forming , which is a strong indication of potential price appreciation . If the price decisively breaks through this resistance , it could pave the way for a significant upward move , potentially targeting $0.40 . 👇🏻
More precisely , if the support at $0.1977 holds , we can be optimistic about this coin’s upward movement . Additionally , if the resistance at $0.2190 is closed above on the daily timeframe and a setup candle provides an entry signal for a spot trade , we can initiate a buy and open a long position . 🐈
I researched this coin on CoinMarketCap on your behalf , and I'm sharing a summary of the information I gathered .
Read carefully , as you need to have this information . 🌈
SXP (Solar) is the native cryptocurrency of the Solar Network, a blockchain platform focused on scalability, speed, and low-cost transactions. Here’s a brief overview:
- Purpose : SXP powers the Solar ecosystem, used for transaction fees , staking, and governance .
- Tech: Solar Network aims for high throughput with a Delegated Proof-of-Stake (DPoS) consensus , making it energy-efficient .
- Use Cases: Primarily for DeFi , payments , and dApps , with a focus on user-friendly wallet solutions .
- Market : As of my last data (Oct 2023) , SXP has a moderate market cap , often fluctuating with market trends . Check CoinMarketCap or CoinGecko for real-time price and volume .
- Community : Active development and partnerships , especially in payment processing and blockchain interoperability .
For trading or investment , check recent price action , volume, and on-chain metrics . Want specific details or analysis tips for SXP ? Let me know !
I love you all so much . 👀
don't forget about capital management and risk management .
Be careful with your positions . 🥇

DOGEUSDT Ready for Pump(Soon again above 0.25$)We are looking for breakout to the upside and pump which hit targets like +20% -- +50% asap.
Price broke the major daily resistance like red trendline and now is getting ready for next phase pump this time hit targets like 0.25$ after more range here.
DISCLAIMER: ((trade based on your own decision))
<<press like👍 if you enjoy💚

Gold can correct to support level and then continue to move upHello traders, I want share with you my opinion about Gold. After studying this chart, we can track the progression of Gold's price action from strong bullish momentum to its current consolidation. Initially, the market trended confidently inside an upward channel, with steady growth supported by the lower boundary of the channel and occasional corrections after touching the resistance line. Each pullback respected previous support zones, a strong signal of buyer control at the time. The most impulsive move came after the price exited the buyer zone, followed by a clean breakout above the resistance line of the channel. However, once the price entered the seller zone, we saw the momentum start to fade. A strong rejection occurred near the resistance level at 3370, which eventually triggered a series of lower highs and shifted the market into a more neutral, range-bound phase. Currently, Gold is trading inside a defined range between 3205 and 3370. The bottom of this range aligns perfectly with the buyer zone, which already acted as a strong support during the last decline. We can also observe the market beginning to show signs of reversal after tapping the zone again. Given the reaction from the support area and the structure of the range, I expect the price can bounce back and make another attempt to reach the 3370 resistance level, which is my TP1 for this scenario. Please share this idea with your friends and click Boost 🚀

USDJPY: Bullish Continuation Confirmed?! 🇺🇸🇯🇵
USDJPY looks bullish after a test of a recently broken resistance.
The price formed a bullish imbalance candle on an hourly time frame
after its test and violated a resistance line of a bullish flag pattern then.
I believe that the pair will continue growing.
Goal - 145.8
❤️Please, support my work with like, thank you!❤️
I am part of Trade Nation's Influencer program and receive a monthly fee for using their TradingView charts in my analysis.

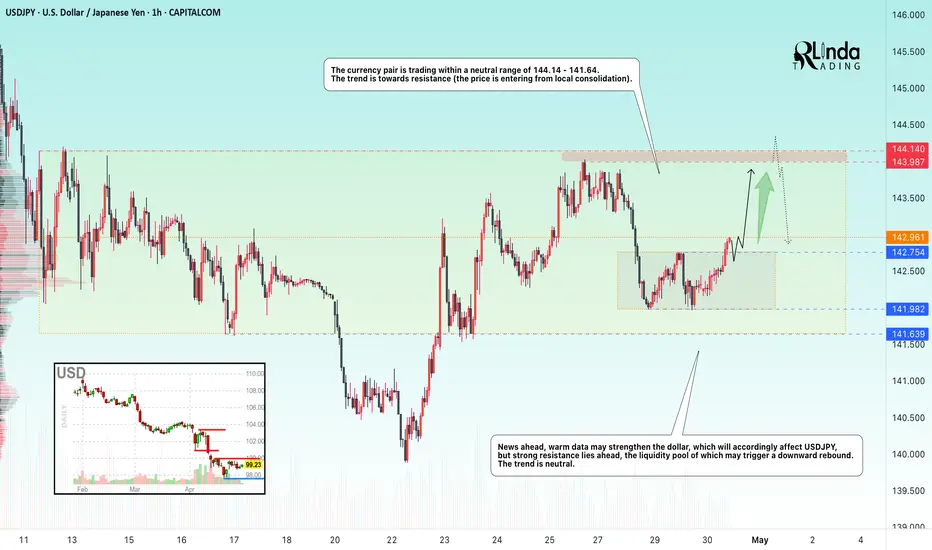
USDJPY → Price in range, retest of resistanceFX:USDJPY is emerging from local consolidation in hopes of seeing economic data that could support the dollar. The target for this movement could be the liquidity zone at 144.00.
The currency pair is trading within a neutral range of 144.14 - 141.64. However, a local consolidation has formed within the range, from which the price has broken out. The main task for the bulls is to hold the defense above 142.75, in which case we will be able to catch the price distribution to the upper border of the global range of 144.14.
News ahead, positive data may strengthen the dollar, which will accordingly affect USDJPY, but there is strong resistance at 144.14, whose liquidity pool may trigger a downward rebound. The trend is neutral.
Resistance levels: 143.9, 144.14
Support levels: 142.75, 141.98
There are no reasons to exit the global range. Over the past two weeks, this will be the first retest of the 144.14 zone, which in general only increases the chances of a false breakout and correction.
Best regards, R. Linda!
Euro can continue to move up inside upward channelHello traders, I want share with you my opinion about Euro. Looking at this chart, we can observe how the price has been moving confidently within the boundaries of a well-formed upward channel. After an extended period of consolidation inside the buyer zone, the market began forming higher lows and eventually broke out with strong bullish momentum. That breakout was followed by a smooth trend-building phase, where each correction found support at higher levels, a clear signal of growing buyer interest. As the price moved higher, it respected both the support line and the support level at 1.0910, reinforcing the structure of the channel. When the market reached the support area, it consolidated for a while before launching another impulse up, confirming the breakout and creating a new higher support zone. Now, the market has pulled back into the support zone, which aligns with the 1.1285 current support level and the lower boundary of the channel. Given the strength of the overall trend, the clear structure of the upward channel, and the reaction from a key support zone, I expect the pair to continue moving higher toward TP1 at 1.1600 points. Please share this idea with your friends and click Boost 🚀

NZDUSD Potential DownsidesHey Traders, in today's trading session we are monitoring NZDUSD for a selling opportunity around 0.59650 zone, NZDUSD is trading in a downtrend and currently is in a correction phase in which it is approaching the trend at 0.59650 support and resistance area.
Trade safe, Joe.

EURO - Price can drop to support level and then start to move upHi guys, this is my overview for EURUSD, feel free to check it and write your feedback in comments👊
Recently, price started to decline inside falling channel, where it reached support line firslty and then bounced up.
Price grew to the resistance line of the channel, which coincided with $1.0950 level, and then in a short time fell back to support line.
Next, Euro made an upward impulse, thereby exiting from channel, and also soon broke $1.0950 level.
After this, price rose a little and then made correction, after which coincided to move up inside pennant.
In the pennant pattern, the price broke $1.1320 level and later reached the resistance line, after which corrected.
Now, I think that the Euro can exit from pennant, fall to the support level, and then bounce up to $1.1510
If this post is useful to you, you can support me with like/boost and advice in comments❤️

XRP is Back!Hello TradingView Family / Fellow Traders. This is Richard, also known as theSignalyst.
📈XRP has been overall bullish from a medium-term perspective trading within the rising channel marked in blue.
Moreover, the green zone is a strong structure!
🏹 Thus, the highlighted blue circle is a strong area to look for buy setups as it is the intersection of structure and lower blue trendline acting as a non-horizontal support.
📚 As per my trading style:
As #XRP approaches the blue circle zone, I will be looking for bullish reversal setups (like a double bottom pattern, trendline break , and so on...)
📚 Always follow your trading plan regarding entry, risk management, and trade management.
Good luck!
All Strategies Are Good; If Managed Properly!
~Rich

BLX monthly trend channelThe BLX trend channel has been corrected; the previous trend channel was probably incorrect. This is what it should look like. The mid band is important since it has marked significant resistance and support in the past. It gives us a price target of around 400k.

NZDCAD: One More Bearish Forex Pair 🇳🇿🇨🇦
One more CAD pair that looks strongly bearish to me is NZDCAD.
Price action analysis speaks out loud on a daily.
The market was rallying nicely and started to slow down,
approaching a key horizontal resistance.
The price started to consolidate and dropped then violating
multiple horizontal supports and a rising trend line.
With a high probability, the market will drop even lower.
Next support - 0.81
❤️Please, support my work with like, thank you!❤️

EURUSD is Trading Under the Pressure of a Strong DollarHey traders, in today's trading session we are monitoring EURUSD for a selling opportunity around 1.13500 zone, EURUSD is trading in a downtrend and currently is in a correction phase in which it is approaching the trend at 1.13500 support and resistance area.
Trade safe, Joe.
