SOL / USDT Update - Breakout in Play! Check out the 1H chart for SOLUSDT. Solana is showing strength in a rising channel, with a recent breakout from a symmetrical triangle to support at $150.
If we break to $165, we could see a strong move higher. But if rejected, watch for a pullback to $150 or lower.
What’s your take?
Parallel Channel

Despite Geo-Political tensions, Nifty closes above Mother line. It was quite remarkable for Nifty to close above the Mother line (50 Hours EMA) despite the Geo-Political tensions and brewing storm of escalations at border. This shows the character of not only Indian market but the resilience of India as a nation. In yesterday's post itself we had mentioned that strong technical resistance has been reached. Add the tension and intent of India to fight against terrorism so it was a perfect recipe for a major fall. Which may happen if things escalate further next week but recovering from 23847 and to close above 24K at 24039 shows that when things will be back to normal the indices will bounce back. Resistance for Nifty now remain at 24096, 24335 and 24504. Supports for Nifty remain at 23914 (Major Mother line support) of 50 Hours EMA, 23800, 23530 and finally 23363.
While Long term players, FII, HNI and DII look at such opportunities to invest for Retail trader it becomes very difficult to control their emotions in such an environment of Geo-political pressure and then we saw a huge fall in the market. The opportunity was seized by both DII and FII with both hands as both turned net buyers for Rs.6492+ Crores. So traders / investors should always avoid knee jerk reactions. Who knows what happens during the weekend the support and resistance levels to watch out for are already mentioned in the message.
Disclaimer: The above information is provided for educational purpose, analysis and paper trading only. Please don't treat this as a buy or sell recommendation for the stock or index. The Techno-Funda analysis is based on data that is more than 3 months old. Supports and Resistances are determined by historic past peaks and Valley in the chart. Many other indicators and patterns like EMA, RSI, MACD, Volumes, Fibonacci, parallel channel etc. use historic data which is 3 months or older cyclical points. There is no guarantee they will work in future as markets are highly volatile and swings in prices are also due to macro and micro factors based on actions taken by the company as well as region and global events. Equity investment is subject to risks. I or my clients or family members might have positions in the stocks that we mention in our educational posts. We will not be responsible for any Profit or loss that may occur due to any financial decision taken based on any data provided in this message. Do consult your investment advisor before taking any financial decisions. Stop losses should be an important part of any investment in equity.
XRPUSDT The Calm Before the Storm: Major Breakout Loading…BINANCE:XRPUSDT has been trading within a well-defined horizontal channel for an extended period, signaling a prolonged consolidation phase. This kind of price behavior often precedes a major breakout, and all signs now point toward an explosive move to the upside.
What makes this setup even more compelling is the presence of an inverse head and shoulders pattern within the channel a classic bullish reversal formation. This pattern, forming after a long sideways trend, adds serious weight to the bullish narrative. It suggests that the accumulation phase is coming to an end, and buyers are preparing to take control.
A breakout above the upper boundary of the channel would confirm the pattern and could trigger a strong rally. Once XRP breaks out with volume, it may leave the consolidation zone behind for good and momentum could carry it to much higher levels.
Traders should watch closely for confirmation and manage risk accordingly. Always use a stop-loss to protect your capital. The opportunity is clear. CRYPTOCAP:XRP is gearing up, and the breakout could be unstoppable.
BINANCE:XRPUSDT Currently trading at $2.19
Buy level : Above $2.2
Stop loss : Below $1.95
Target : $3.5
Max leverage 3x
Always keep stop loss
Follow Our Tradingview Account for More Technical Analysis Updates, | Like, Share and Comment Your thoughts

Gold can break support level and continue to declineHello traders, I want share with you my opinion about Gold. For a while, Gold was confidently moving within an upward channel, with each impulse supported by rebounds from the lower boundary. After breaking out of the buyer zone, the price made a strong bullish move, supported by momentum and healthy corrections. This movement continued up to the current support level at 3285, where the price began to stall. Then, a classic Head and Shoulders pattern has now fully formed. The left shoulder, head, and right shoulder are all visible and aligned with the support area, which now acts as the neckline of the pattern. This isn't random, it's a well-defined reversal signal forming after an extended bullish leg. The rejection from the right shoulder shows evident seller control, and the price is now testing the neckline from below. The support area has already been broken once, and any bounce from here appears corrective rather than impulsive. Given this setup, I expect that price can fully breakdown toward the 3060 level, which acts as both a strong historical support and my TP1. Please share this idea with your friends and click Boost 🚀

EURO - Price can correct to support area and then bounce upHi guys, this is my overview for EURUSD, feel free to check it and write your feedback in comments👊
After consolidating in a broad range for several weeks, Euro made a strong breakout and entered an ascending channel.
The price respected this pattern twice, forming clear support and resistance touches, and confirming trend direction.
Most recently, the Euro surged and reached the upper boundary of the new rising channel, but quickly pulled back.
Currently, it’s testing the $1.1380 support area, which also aligns with the channel base, creating a confluence zone.
Given this context, I anticipate a bounce from this support and continuation of bullish structure toward $1.1670
This level represents the channel top and may act as the next key resistance zone.
If this post is useful to you, you can support me with like/boost and advice in comments❤️

Bitcoin about to go nuts?I think people still don't realize what's in the cards when BTC breaks above the middle band of the channel, and I personally think that's exactly what's going to happen in the coming months.

TOTALThings are changing. TOTAL bounced off its monthly uptrend line. We could see a major shift from here.

Atcoin Season?Possible falling wedges on the OTHERS.D chart. Are we about to move back into the channel?

EURUSD → Accumulation of liquidity before continued growthFX:EURUSD currency pair is forming a trading range within a global and local uptrend. Before continuing its growth, the market may form a false breakout.
Against the backdrop of the falling dollar, the euro is strengthening and has gained 13% over the past four months, which is a fairly significant growth indicator for the currency pair. Fundamentally, the US is trying to achieve a rapid reduction in interest rates, which may continue to support the euro...
Technically, the price is consolidating against the backdrop of a global and local uptrend. A correction is forming towards the support zone, where there is a fairly large pool of liquidity...
Resistance levels: 1.1392, 1.1439, 1.1481
Support levels: 1.130, 1.127
The price is heading towards support, namely, the market is interested in liquidity below 1.13 - 1.127, which must be tested in order to build up potential before the bullish trend possibly continues.
Best regards, R. Linda!

Thorchain (RUNE) about to go 1100%?Dearest reader,
Welcome back for yet another great analysis, there is alot to unpack on the chart above so lets dive right in. Thorchain has seen a brutal crash/retrace of a whopping 87% since december regarding their financial situation around the thorfi hack. There is always something right? Ignore the FUD and look at the chart, it's screaming ''buy buy buy!''
Lets go through the chart from left to right.
1. Lower support line, has seen 5 confirmations so far, dating back all the way to 2020 (Small 1's)
2. Bullflag. Has seen 6 confirmations of this channel (green circles) and had a breakout in november 2023
3. Retest of BOTH 1 and 2, the upper line of the bullflag and also the support line since 2020
4. Stochastic RSI is oversold, sellers are exhausted, makes sense! it has seen a 87% drop allready. MFI has seen the lowest point in the history of this token (17) and has been moving back up. Note: Stochastic RSI is a lagging indicator and MFI is forward looking. Both look bullish
If the pattern from 2020 would repeat that could mean that by august this year we will see a price of 11 dollars yet again, that's a whopping 1100% from this point.
Target: 11/12$
Entry: 1$
Stoploss: 0.75$ (There is some support here, so even when this area is hit it might still bounce up.
~Rustle

Compound 200% very soonHello dear readers!
Another quick one for you. Compound has been around for a while and has seen a massive retrace of around 73%.
There are now reasons to be bullish for the short term.
When we look at the charts we can see a bullflag breakout (fierce) and retest of the upper bound. Its on a hard support also. Any sellers have dried out, and the only way is up.
Target minimum: 132
Stoploss: you can pick
~Rustle

AMD to Retest SupportAMD has been in a descending price channel since November of 2024 with clear support and resistance established. On Monday we saw an attempt to breakout however it was rejected at the establish resistance line. Given the rejection and the significant drop that followed I think we will likely see AMD drop to slightly below $80 in the short term and retest the established support line.

GOLD → False breakdown and change of mood...FX:XAUUSD is strengthening after a false breakdown of support at 3288, with the change in fundamental sentiment due to US statements on the tariff war also providing support for the price.
On Thursday, gold rose from a weekly low of $3,260, supported by a weaker dollar and renewed concerns about US trade negotiations with China and Japan.
Optimism about tariff cuts quickly faded after denials from the White House. Weak US business activity data is fueling talk of a possible Fed policy easing, which is also supporting gold. The markets remain focused on trade news and Trump's statements.
Technically, gold could reach the liquidity cluster at 3314 and continue to rise towards strong resistance at 3370.
Resistance levels: 3342, 3370, 3387
Support levels: 3314, 3288, 3270
Below 3314 and below 3288, a liquidity pool has formed, which the market is likely to test before continuing its growth. It is too early to talk about a resumption of a strong rally, as the situation between the US and China is complicated, as are the negotiations on the situation in Eastern Europe, which seem to be moving towards talks, but every time something goes wrong...
Best regards, R. Linda!

USOIL ANALYSISHello friends
Everything is clear on the chart for you, our probability is price growth to the specified areas.
Be sure to observe risk and capital management.
*Trade safely with us*

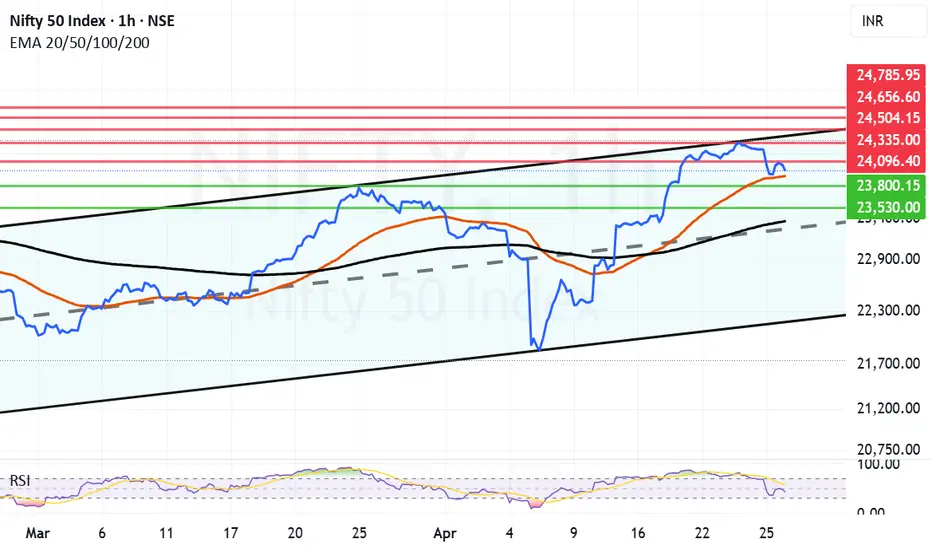
Nifty has hit a channel top with geopolitical events unravellingNifty was swiftly recovering after the Tariff war induced fall. On technical front Nifty has hit a channel top In the hourly line chart. Chanel tops are not easy to conquer and we saw Nifty retrieving today from there. Adding pressure to the rally is the Geo-Political situation after the Dastardly Pahalgam Terrorist Attack. If there is any action by India like Balakot (Swift and fast) any way it will be denied by Pakistan so nothing much will happen to Index. If there is only Political/Geopolitical long term steps taken again it will have less effect on the market. Market may decline drastically only if there is a full blown war between the 2 countries or more than 2 countries. (Possibility of that happening is less but we never know). Not much is in our hand if such a scenario arises. FIIs were seen buying big today so that is something to watchout in the coming days.
Technical Supports for Nifty remain at: 24096, 23882 (Mother Line Support), 23800 and 23316 (Father Line Support). (Mid channel support is also around 23300) so this zone presents a strong support zone.
Technical Resistances Remain at: 24335 (Major Channel Top Resistance), 24504, 24656 and 24785.
Disclaimer: The above information is provided for educational purpose, analysis and paper trading only. Please don't treat this as a buy or sell recommendation for the stock or index. The Techno-Funda analysis is based on data that is more than 3 months old. Supports and Resistances are determined by historic past peaks and Valley in the chart. Many other indicators and patterns like EMA, RSI, MACD, Volumes, Fibonacci, parallel channel etc. use historic data which is 3 months or older cyclical points. There is no guarantee they will work in future as markets are highly volatile and swings in prices are also due to macro and micro factors based on actions taken by the company as well as region and global events. Equity investment is subject to risks. I or my clients or family members might have positions in the stocks that we mention in our educational posts. We will not be responsible for any Profit or loss that may occur due to any financial decision taken based on any data provided in this message. Do consult your investment advisor before taking any financial decisions. Stop losses should be an important part of any investment in equity.

Us30 Upward or downward?In the 5-minute timeframe, you can sell at the top of the trading range and buy at the bottom of the trading range (by observing reversal candles and patterns).
Alternatively, you can wait for a breakout and enter in the direction of the breakout.
Be mindful of fake breakouts

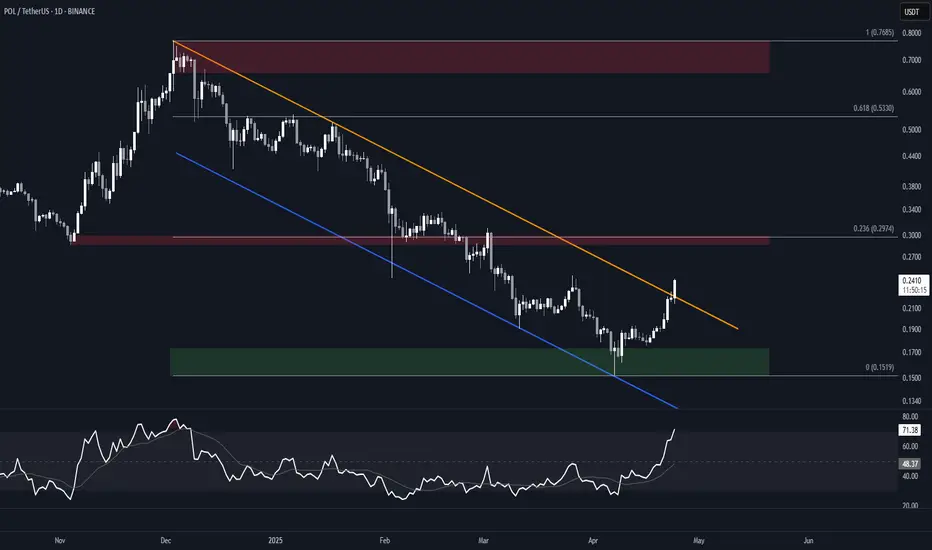
POL (MATIC) Falling Channel BreakoutBINANCE:POLUSDT is attempting a breakout from a nearly 6-months long falling channel. A daily close above the resistance would offer confirmation.
Watch for a potential retest of the resistance as support, as the overbought Daily RSI could signal an imminent pullback.
Key Levels
Aside from the support, these are all good candidates for partial TPs.
• $0.15-$0.17: Bull order block and current support
• $0.30: Previous S/R, 0.236 fib of the move down, and HVN. Will likely offer resistance.
• $0.53: Previous S/R, and 0.618 fib of the move down.
• $0.66-$0.77: Main supply zone, and December 2024 high.
BTC Pumped Hard – Is It Time for a Pullback to Fill CME GAP!?Bitcoin ( BINANCE:BTCUSDT ) started pumping after the pullback, as I expected in my previous post , I hope you were able to take profits.
Bitcoin is trading in the upper areas of the Heavy Resistance zone ($95,000-$88,500) , near the Resistance lines and the upper line of the ascending channel .
Also, we can see the Regular Divergence(RD-) between Consecutive Peaks .
From the Elliott Wave theory perspective , it seems that Bitcoin has completed the main wave 3 and we can expect the completion of the main wave 4 today .
I expect Bitcoin to correct in the next few hours and drop to the targets I have specified on the chart and fill the CME Gap($93,465-$91,415) .
Cumulative Short Liquidation Leverage: $95,700-$94,542
Cumulative Long Liquidation Leverage: $92,666-$91,415
Cumulative Long Liquidation Leverage: $90,276-$89,160
Note: If Bitcoin can break the upper line of the ascending channel, we should wait for the next pump.
Please respect each other's ideas and express them politely if you agree or disagree.
Bitcoin Analyze (BTCUSDT), 1-hour time frame.
Be sure to follow the updated ideas.
Do not forget to put a Stop loss for your positions (For every position you want to open).
Please follow your strategy and updates; this is just my Idea, and I will gladly see your ideas in this post.
Please do not forget the ✅' like '✅ button 🙏😊 & Share it with your friends; thanks, and Trade safe.

CADCHF: Bullish Continuation After Consolidation 🇨🇦🇨🇭
CADCHF was accumulating for more than a week within a horizontal
range on a daily time frame.
With a strong bullish movement, its resistance was violated yesterday.
The price may grow much more now.
The closest resistance - 0.608
❤️Please, support my work with like, thank you!❤️
I am part of Trade Nation's Influencer program and receive a monthly fee for using their TradingView charts in my analysis.

APTUSDT → Retest of the liquidity zone. Downward trendBINANCE:APTUSDT.P failed to realize its potential. The price made a false breakout of resistance and formed a reversal pattern. Correction or continuation of the downtrend?
Bitcoin is rebounding from resistance. Technically, the market may enter a correction or consolidation. Altcoins are reacting accordingly — correction
Within the downtrend but local ALT rally, APT failed to realize its potential and formed liquidity accumulation and a false breakout of the downtrend channel resistance before a possible decline...
Resistance levels: 5.2, 5.458
Support levels: 4.76, 4.48, 4.17
A consolidation of the price below the trend resistance or below 5.20 could trigger a continuation of the global and local trends. The coin is likely to remain near the bottom and test new lows...
Best regards, R. Linda!

GOLD → Reversal or correction? What to do now?FX:XAUUSD reaching the psychological high of $3500 has entered the correction phase, which was also influenced by a slight easing of the tariff conflict between the U.S. and China....
After falling without reaching the zone of interest 3288, the gold price is strengthening at the beginning of the European session, expecting PMI data from the U.S.. Earlier, the metal reached a record of $3,500, but rolled back amid hopes for an easing of the trade war with China and words of the US Treasury Secretary about a possible “détente”.
The dollar recovered as part of the correction, but investors doubt Trump's predictability, gold at this time begins a correction. In the center of attention is the PMI index from S&P Global: its results may affect expectations for Fed Funds rates and give a new direction to the market.
Resistance levels: 3340, 3360, 3366
Support levels: 3317, 3288
Technically gold is in correction and confirms the bearish structure. But any unexpected statement by Trump may attract aggressive buying.
Nevertheless, we should now consider a possible decline from 3340 - 3360 - 3366. Buying could be considered on a retest of support or a close above 3370.
Regards R. Linda!

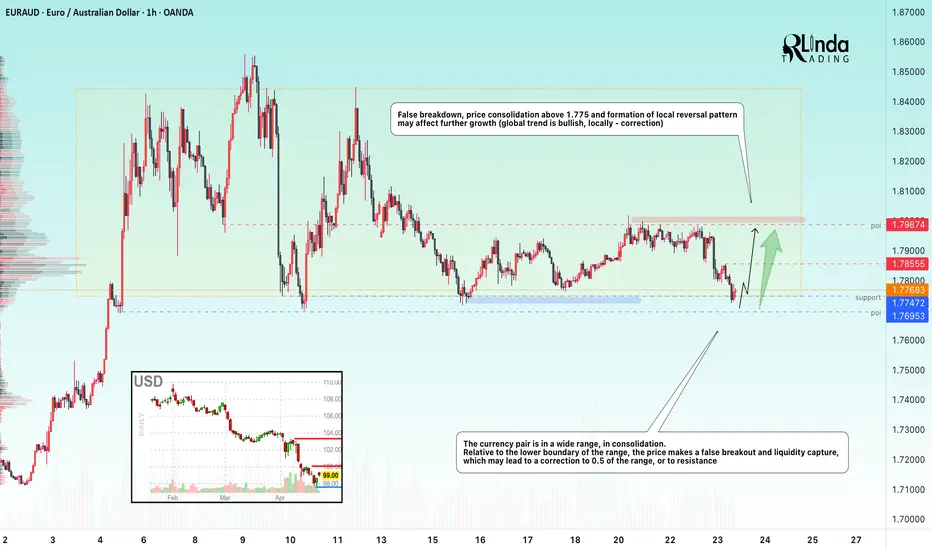
EURAUD → False breakdown as part of a bullish trend correctionFX:EURAUD amid the global bullish trend is forming a correction to the trading range support. Bulls are trying to hold the 1.775 zone
The currency pair is in a wide range, in consolidation. Relative to the lower boundary of the range, the price makes a false breakdown and liquidity capture, which may lead to a correction to 0.5 of the range, or to resistance
Price consolidation above 1.775 and formation of local reversal pattern may affect further growth (global trend is bullish, locally - correction). The fundamental background is unstable, but the dollar index is still in correction after a strong fall....
Resistance levels: 1.7855, 1.7987
Support levels: 1.775, 1.7695
If the bulls hold the defense above the key support - the lower boundary of the trading range, the currency price may bounce up and head for the liquidity accumulated above the resistance....
Regards R. Linda!
SCI NSE Bearish channel BO WTF NEW Stock Analysis
Trade Plan: SCI
Entry: 50% of the total quantity at 243 DTF Close, with an additional 50% added at 274 DTF Close Price.
Stop Loss: 203
Target 1: 345
Target 2: NA
Hold for a period of 11 months to 1 year or until the target 1 is reached.
Chart Pattern:
The stock experienced a Pullback period of 5Months after touching an all-time high (ATH) of 383 .
Technical Indicators:
The stock’s daily timeframe (DTF) shows that the price is currently trading above the 50-day exponential moving average (EMA) and the 20-day EMA below the 50EMA. The EMAs are in Transitional sequence of alignment. The Stock is at good price point where the 50EMA and 200EMA are very close and the 20EMA has curved upwards.A potential bullish trend in formation on the DTF/WTF timeframe.
Volume Analysis:
There has been a surge up of volumes on the buy side for a Month now. Take entry as recommended in Trade Plan.
Prioritize Watch List:
Keep this stock in your watch list for further analysis and potential trading opportunities.
Disclaimer: This information is solely for educational and reference purposes. Trading inherently carries risks, and it’s crucial to exercise caution and conduct comprehensive research before making any investment decisions. Make sure you have a well-defined risk appetite, proper position sizing, and a stop-loss order based on your risk tolerance. Review your Portfolio periodically. Exit positions when the price closes 7-8% below your entry point or Earlier basis your Risk profile. Consider re-entering the market when the trend reverses.Before engaging in any trading activities, it is paramount to thoroughly comprehend these technical analysis concepts and conduct extensive research on the stocks you are interested in. Furthermore, consulting a certified financial advisor can offer valuable insights and guidance before making investment decisions.
Technical Analysis Concepts:
Multiple Time Frame Analysis (MTFA):
Daily Time Frame (DTF): Used for short-term analysis and identifying trends.
Weekly Time Frame (WTF): Provides a broader perspective and helps in trend confirmation.
Monthly Time Frame (MTF): Ideal for long-term analysis and trend analysis.
All-Time High (ATH): The highest price reached on a specific chart.
Lifetime High (LTH): The highest price reached over the entire chart’s history.
Stop Loss (SL): A predetermined price level at which an investment is automatically exited to limit potential losses.
Swing Trade: A trading strategy that involves holding positions for a significant period, typically few weeks to months.
Positional Trade: A trading strategy that aims to capitalize on long-term trends and position oneself accordingly.
CHART PATTERNS
Rounding Bottom Cup/Handle (RBC&H): A pattern that signals a potential reversal from a downtrend.
Breakout (BO): A price move closure above a resistance or below a support level.
Flag & Pole BO: (F&P BO) Bullish Continuation Pattern
Consolidation : Price Typically Swings between a Range for a period of Time Long or Short basis the MTFA. Breaking out of this range UPWARDS is an opportunity to BUY and DOWNWARDS is SELL opportunity.
Moving Averages:
Exponential Moving Average (EMA): A popular moving average that places more weight on recent price data.
Volume-Weighted Moving Average (VWMA): A moving average that gives more weight to high-volume stocks.
Fibonacci Retracement/Extension:
Trend-based Fibonacci Retracement: Used to identify potential support and resistance levels during re-tracements.
Trend-based Fibonacci Extension: Used to identify potential breakout levels during extensions.
