AUDJPY Wave Analysis – 4 April 2025
- AUDJPY broke support level 90.00
- Likely to fall to support level 88.00
AUDJPY currency pair recently broke the round support level 90.00 (former multi-month low from August) intersecting with the support trendline of the daily down channel from November.
The breakout of the support level 90.00 accelerated the minor impulse wave 3 of the intermediate impulse wave (3) from November.
Given the strongly bullish yen sentiment and long-term downtrend, AUDJPY currency pair can be expected to fall to the next support level 88.00 (target price for the completion of the active impulse wave 3).
Parallel Channel
EURGBP Wave Analysis – 4 April 2025
- EURGBP broke resistance area
- Likely to rise to resistance level 0.8500
EURGBP currency pair recently broke the resistance area located between the resistance level 0.8450 (which has been reversing the price from September), resistance trendline of the daily down channel from November and the 50% Fibonacci correction of the downward impulse from March.
The breakout of this resistance area should strengthen the bullish pressure on this currency pair.
EURGBP currency pair can be expected to rise to the next resistance level 0.8500 (former yearly low from 2023 and strong support from the start of 2024).
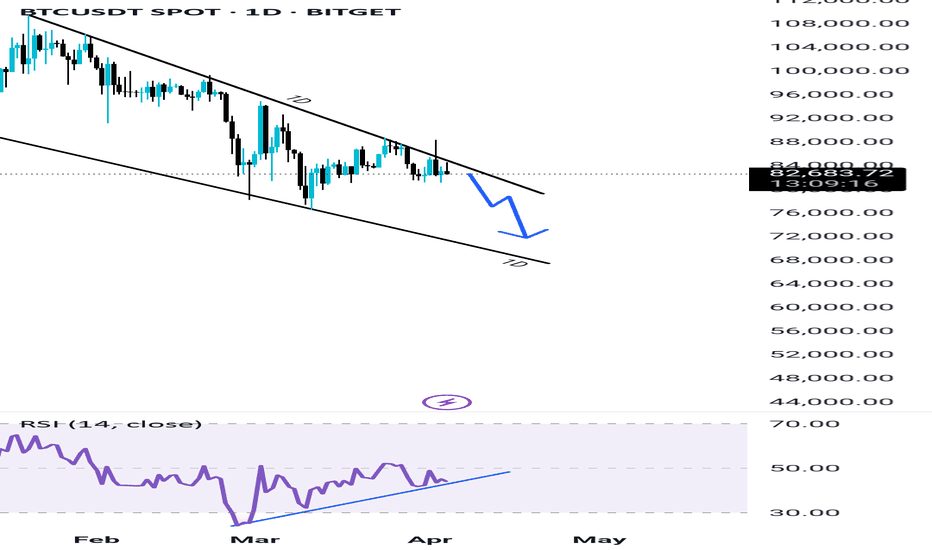
BTC sign of weakness & more drop coming BTC Struggles to Break Trendline Resistance: Signs of Weakness on 1D Timeframe
Bitcoin is currently facing strong resistance on the daily (1D) timeframe, struggling to break above the trendline. This indicates potential weakness, with BTC showing signs of a downside move towards the $70K–$75K range. While we cannot pinpoint an exact support level, this zone serves as a potential drop area. Additionally, a sharp wick could extend lower, possibly touching $69K or even FWB:67K , as liquidity is swept from below before a potential recovery.
On the bullish side, a bullish RSI divergence is forming, which suggests that sooner or later, BTC could experience a strong upward move. This could lead to a significant rally in the market.
Given the current market structure, it’s a good time to position yourself in high-quality utility projects rather than meme coins. Focusing on fundamentally strong assets can lead to massive gains in the next bullish phase. Stay strategic, manage your risk, and be prepared for future opportunities.
DOGEUSDT from two major daily supports can pumpAs we can see two major daily supports now are ahead:
A. 0.135$
B. 0.090$
We are looking for rise and pump from these supports so we set our buy pending and still watching chart also remember because of breakout to the upside here pump may start sooner.
DISCLAIMER: ((trade based on your own decision))
<<press like👍 if you enjoy💚
GOLD → It all depends on NFP and Powell....FX:XAUUSD got shaken by 600 pips on both sides. Technically, after such a move the price may go into consolidation, but the near-term outlook will depend on NFP and Powell.
Gold hit a high of 3168 and went into correction. President Trump's imposed duties on imports from China (up to 54%) and other countries caused a sharp drop in the dollar and bond yields, reinforcing expectations of a Fed rate cut. Traders turned to profit-taking, which led to a correction. Now the market is waiting for the NFP report and Powell's speech. Weak data may return the upward momentum to gold, especially if the dovish rate expectations are confirmed. However, volatility may persist after the publication, given the impact of Friday's flows and Powell's speech
Resistance levels: 3107, 3116, 3135
Support levels: 3086, 3067, 3055
Technically, it is difficult to determine a clear place from where to expect a move as there is news ahead (NFP, Powell's speech). But based on the falling dollar and high economic risks, we can bet on the continuation of the price growth from one of the mentioned support levels: 3086, 3067, 3055.
Exit from the channel and consolidation of the price above 3110 - 3116 will again attract increased interest in buying
Regards R. Linda!
LTC - Bulls Getting Ready!Hello TradingView Family / Fellow Traders. This is Richard, also known as theSignalyst.
📈 Long-term, LTC has been overall bullish, trading within the rising channel marked in red.
📍 As it retests the lower bound of the channel — perfectly intersecting with the blue support—I will be looking for medium-term longs.
🚀 For the bulls to take over long-term and initiate the next bullish phase, a breakout above the last major high marked in orange at $97 is needed.
📚 Always follow your trading plan regarding entry, risk management, and trade management.
Good luck!
All Strategies Are Good; If Managed Properly!
~Rich
SEI/USDT:BUY LIMITHello dear friends
Given the price drop we had in the specified support range, the price has been able to create higher ceilings and floors.
Now, given the good support of buyers for the price, we can buy in steps with capital and risk management and move towards the specified goals.
*Trade safely with us*
EUR50 Wave Analysis – 3 April 2025
- EUR50 index broke support zone
- Likely to fall to support level 5000.00
EUR50 index recently broke the support zone between the support level 5130.00 (which stopped waves 4 and iv at the end of Jan airy), intersecting with 50% Fibonacci correction of the extended upward impulse (3) from November.
The breakout of this support zone should accelerated the C-wave of the active ABC correction (4) from February.
EUR50 index can be expected to fall to the next round support level 5000.00 (target price for the completion of the active C-wave).
Bitcoin Wave Analysis – 3 April 2025
- Bitcoin reversed from resistance level 87785.00
- Likely to fall to support level 78650.00
Bitcoin cryptocurrency recently reversed down from the resistance level 87785.00 (which stopped wave A at the end of March), intersecting with the daily down channel from January and the upper daily Bollinger Band.
The downward reversal from the resistance level 87785.00 will form the daily Japanese candlesticks reversal pattern Evening Star – if the price closes today near the current levels.
Bitcoin cryptocurrency can be expected to fall to the next support level 78650.00 (which has been reversing the price from February).
GOLD - Price can decline to support area and then start to growHi guys, this is my overview for XAUUSD, feel free to check it and write your feedback in comments👊
Some time ago price traded inside a flat pattern, where it moved between support and resistance levels.
Then gold made fake breakout to the downside, but soon returned back and started to grow strongly.
It broke the upper line of the flat and entered a rising channel, forming a steady bullish movement.
Later price touched $3160 resistance and bounced down, making correction to $3070 support area.
Now gold trades inside rising channel and near $3070 level, showing signs of slowing the decline.
In my opinion, gold can bounce from support and reach $3160 resistance as the next upward target.
If this post is useful to you, you can support me with like/boost and advice in comments❤️
GOLD - New All-Time High Again? Where Will This End? Current Price Action:
Gold (XAUUSD) has reached another record high at 3,175.06 on the 4-hour chart, showing strong bullish momentum. The price is currently hovering around 3,127.07 after a minor pullback from the peak.
Key Levels:
Resistance: The all-time high at 3,175.06 is now the key level to watch. A break above could signal continuation of the rally.
Support: Immediate support sits at 3,127.20, with 3,150.00 acting as additional support. A drop below 3,127 could indicate a deeper correction.
Market Context:
The repeated tests of new highs suggest strong buying pressure, though the recent pullback shows some profit-taking. The 3,150 level has flipped from resistance to support, which is a bullish sign.
Trading Considerations:
- Long positions may consider entries near 3,127-3,150 with stops below 3,120, targeting 3,175 and beyond
- Short-term traders might watch for rejection at 3,175 for potential reversal plays
- The overall trend remains strongly bullish, but extended moves often see sharp corrections
Volume and Momentum:
The current pullback appears on relatively low volume, suggesting this may be a temporary pause rather than a trend reversal.
Final Thoughts:
Gold continues its historic rally with no clear resistance in sight. While the trend favors buyers, traders should remain cautious of potential profit-taking at these elevated levels.
Disclaimer: This analysis is for informational purposes only and not investment advice. Always conduct your own research before trading.
GOLD → Correction. Liquidity is the target. News aheadFX:XAUUSD on the background of yesterday's news reaches the target of 3166 and enters the phase of deep correction on the background of profit-taking. The level of economic risks is still high
Despite the pullback, the gold price retains much of its recent record high, thanks to rising risks of a global trade war and a US recession.
Gold corrects from record $3,168 but remains strong amid trade and recession risks. The correction is due to the following nuances: Profit taking ahead of key US jobs data. Waiting for jobless claims and services PMI.
But, Trump's new tariffs, a weaker dollar and lower bond yields are driving gold buying.
Resistance levels: 3116, 3135
Support levels: 3107, 3097
Against the background of high economic risks, falling dollar index, gold still has chances to continue its growth. False breakdown of support may give such a chance.
Regards R. Linda!
AUDJPY - Follow The Bears!Hello TradingView Family / Fellow Traders. This is Richard, also known as theSignalyst.
📈AUDJPY has been bearish trading within the falling channel in red.
Currently, AUDJPY is approaching the upper bound of the channel.
Moreover, it is retesting a strong structure marked in orange.
🏹 Thus, the highlighted red circle is a strong area to look for sell setups as it is the intersection of the structure and upper red trendline.
📚 As per my trading style:
As #AUDJPY is around the red circle zone, I will be looking for bearish reversal setups (like a double top pattern, trendline break , and so on...)
📚 Always follow your trading plan regarding entry, risk management, and trade management.
Good luck!
All Strategies Are Good; If Managed Properly!
~Rich
Disclosure: I am part of Trade Nation's Influencer program and receive a monthly fee for using their TradingView charts in my analysis.
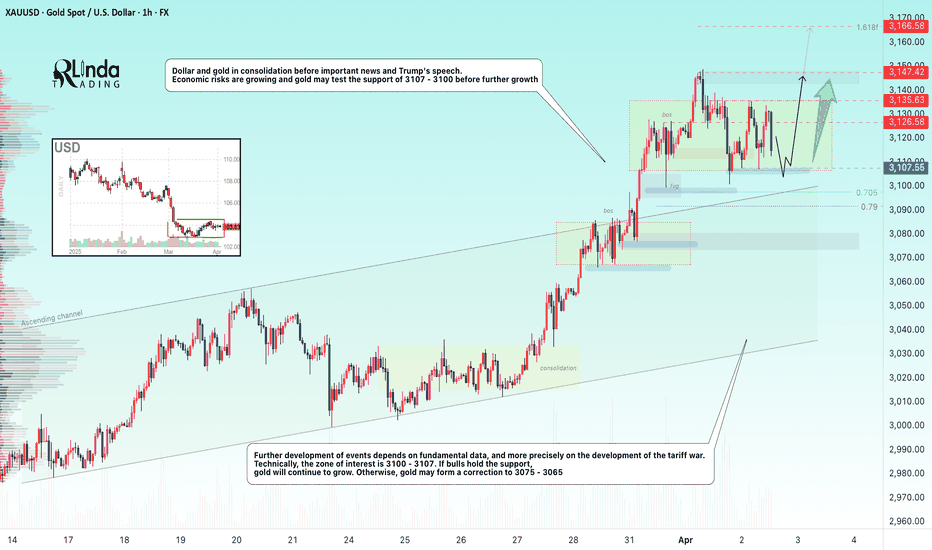
GOLD → Consolidation. News. False breakdown. Growth?FX:XAUUSD and TVC:DXY in consolidation ahead of important news and Trump's speech. Economic risks are rising and the future outlook depends on fundamental data...
Trade tensions support gold demand. Trump may impose global tariffs of up to 20% which will increase risks to the economy. Investors are piling into gold in anticipation, pushing its price to a record $3,150
A key factor is the details of the tariffs. If tariffs are softer than expected, gold could fall to intermediate support zones. If the trade war escalates, the rise could continue beyond 3150
Economic risks are rising and gold may test 3107 - 3100 support before rising further. Technically, 3100 - 3107 is a zone of interest and liquidity. If bulls hold the support, gold will continue to rise. Otherwise, gold may form a correction towards 3075 - 3065
Resistance levels: 3126, 3135, 3147
Support levels: 3107, 3100, 3091
The price is correcting to consolidation support in the moment. A strong and sharp fall is fraught with the risk of a liquidity grab and a false breakdown. In this case, gold may strengthen to one of the key resistances. But the further and medium-term development of events depends on the evening news....
Regards R. Linda!
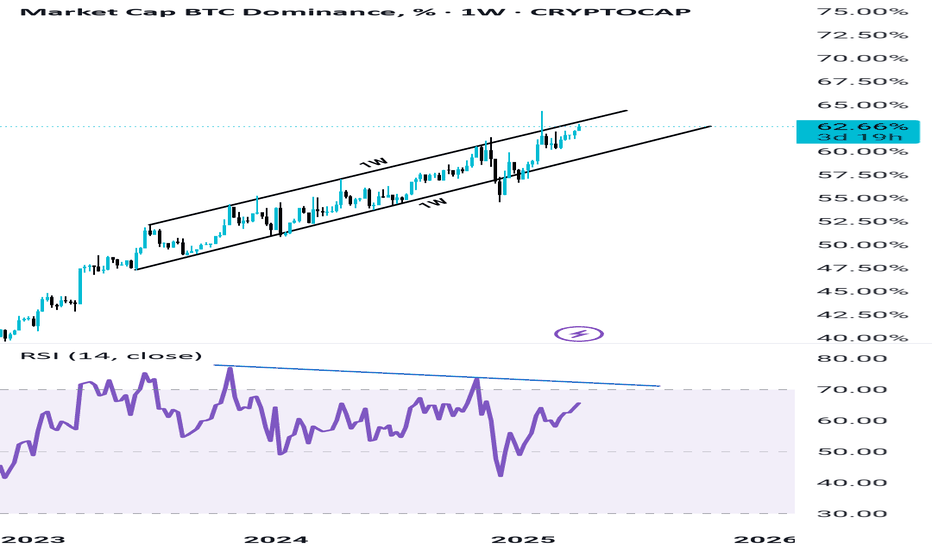
BTC DOMINANCE in Rising wedge Pattern BTC Dominance Showing Signs of Weakness – Altseason Incoming?
BTC dominance is finally topping out, displaying clear signs of weakness. Rising wedge Pattern forming on weekly time frame which is also bearish. Despite reaching new highs, momentum appears to be fading, with bearish RSI divergence further confirming the exhaustion. All indicators point towards an imminent breakdown in BTC dominance, potentially triggering a long-awaited Altseason in the coming days. Stay prepared for major moves in the altcoin market!
1. Weakness in the uptrend =Bearish
2. Rising wedge Pattern = Bearish
3. RSI divergence on weekly = Bearish
All things indicating towards upcoming Bearish trend for BTC Dominance.
What do you think share your thoughts in the comments.
🚀 🚀 🚀 🚀
This is not a Financial Advise
XRP - Decision Point at Fair Value Gap (FVG)This 1-hour XRP/USDT chart shows price consolidating inside a descending channel, approaching a critical Fair Value Gap (FVG) zone.
Key Observations:
🔹 FVG Support: Price is testing an area of inefficiency, which could act as a turning point.
🔹 Two Possible Scenarios:
- Bullish Case: If price holds the FVG and breaks upward, a push toward channel resistance is likely.
- Bearish Case: Failure to hold the FVG could result in a drop toward the lower channel boundary.
Which way will XRP move next? 🚀📉 Let’s discuss!
GOLD → The rally is intensifying. Growth after false breakdownFX:XAUUSD is breaking upwards and is trying to consolidate above the previous high of 3127 as part of a correction. This would be an ideal support for the bulls. The rally, on the background of political and geopolitical problems only intensifies
Tariff escalation pushes up gold demand. Trump rejected the idea of lowering tariffs and the Treasury Secretary named a list of 15 countries that fall under the new measures. This has caused the dollar to weaken and fears of stagflation to rise, boosting demand for gold as a protective asset.
Central banks and investors continue to build positions in gold, but corrections are possible before the tariffs announcement on April 2 and the release of U.S. economic data
Technically, we have a strong bullish trend, it is risky to sell, we are looking for strong areas or levels to buy. For example, if the price consolidates above 3127, or after a false breakdown of 3119 / 3111
Resistance levels: 3147, 3155, 3166
Support levels: 3127, 3119, 3111
Before the continuation of the growth there may be a correction to the key support areas to normalize the imbalance in the market as well as to capture the liquidity. Consolidation above the level after a false breakdown will be a good signal for growth.
But! News ahead and high volatility is possible!
Regards R. Linda!
NZDUSD → Consolidation within the correctionFX:NZDUSD is forming a local correction on the background of the uptrend. The dollar has been consolidating and strengthening for the last week, which generally creates pressure on the forex market
NZDUSD after a false break of the trend resistance, which also coincided with the stopping of the strong decline of the dollar, entered the correction phase. Locally, it is a downtrend, followed by consolidation, which in general forms a flag - a figure of continuation of the movement.
The chart reveals strong levels that can be paid attention to. The dollar may continue its growth due to the US policy, which generally has a negative impact on the market.
The price exit from the current consolidation may be accompanied by a strong impulse. Emphasis on 0.575 - 0.571.
Resistance levels: 0.57426, 0.57674
Support levels: 0.571, 0.5684
After stopping at 0.571, the price is not pulling back, but forming consolidation on the background of the local downtrend. Most likely a big player lures the crowd to get to the imbalance zone or trend support at their expense.
Regards R. Linda!


