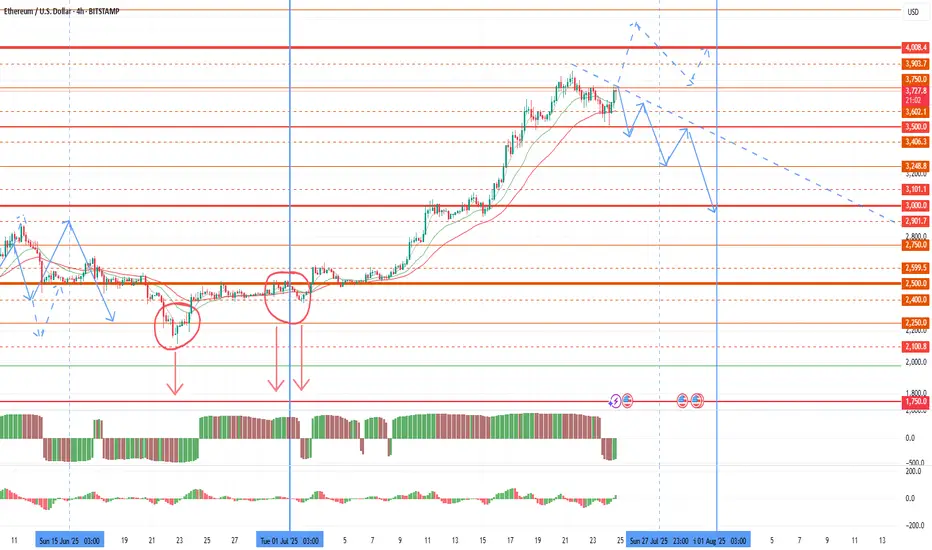
Possible market drawdown before the end of the monthToday I want to review the market and give a warning on further purchases. Since the last review, as expected, volatility in the market began to grow with a flat of about 2500 on ether until the half-year change. The growth of the euro and oil gave rise to a 4k retest in the new half of the year. However, the half-year has opened below 2,500, which is a technical selling signal that bears will use at the end of each major period. A large volume of sales was also left before the half-year change, which can be retested up to 2100-2250. The first pullback is already possible for the current monthly candle, with its pinbar reversal up to 2750-2900 on ether. This pullback started yesterday and is likely to accelerate in the last weekly candle of the month. Further sales are highly likely to continue in the first half of the new month as part of the shadow drawing for the new monthly candle. In an optimistic scenario, the bulls will be able to take 4,000 by the end of the week, in which case the pullback on the current monthly candle will be compensated.
Given the increased likelihood of sales in the market, I recommend fixing profits by the end of the week and reducing the number of coins in operation. The current rollback for some coins will also end with the assignment of the monitoring tag at the beginning of the month and a further collapse, which puts pressure on the coins.
Most of the coins that I considered for work provided good opportunities for making money, especially the growth impulses of pivx and data with sharp breakouts stood out. Adx fio chess cos token also showed growth, but at a smoother pace. The most negative dynamics was given by slf, which eventually received the monitoring tag, and I will not consider it in the future.
Despite the pleasant impulses of 50%+ for individual fantokens, this group as a whole shows extremely negative dynamics relative to the market, and remains in the most oversold position, even relative to coins with the monitoring tag. In an optimistic scenario, fantokens will become interesting to speculators against the background of the general decline of altcoins that has begun, and we can expect a good bull run on them before the end of the month. In a negative scenario, binance may be preparing to assign the monitoring tag to some tokens of this group or chz. In this regard, I leave such tokens as atm acm city porto Lazio as the most undervalued in a small lot. But at the beginning of the month, I also recommend keeping short stops on them in the first half of the day of the first week of the new month to insure against assigning the monitoring tag. Or temporarily sell them for a given period.
In addition to fan tokens, I will choose new coins for operation after assigning the monitoring tag in the new month.
Party
AAVE Price too BEARISHThe Aave price analysis shows a bearish trend today
The resistance for AAVE/USD is present at $73.01
Support for AAVE/USD is found at $71.33
The Aave price analysis is directing that the cryptocurrency has undergone loss once again during the last 24 hours. That is because the bears are once again powering through after a small bullish interruption. The bears have caused a decrease in the price up to the $72.25 level and have been able to retain their position as the leading party. More sellers are causing the price to downgrade further and have defeated the buyers in their attempt at revival.
The Aave prices have found some support around $71.33 but it remains to be seen if this will be enough to turn the tide in favor of the bulls. For now, the bears are in control of the Aave markets and may continue to push prices lower in the near term.
Final appraisal of the Ave price
Aave price analysis indicates that today has also seen bearish behavior. The price levels have decreased to $72.25; this is a considerable loss for the market value of cryptocurrencies. Although the bulls attempted to recover in the most recent hours, their efforts were in vain as the price fell today. Only if the support at the $71.33 level is maintained can price levels be kept stable.

Bitcoin - We're going to Ibiza!Just like the Vengaboys said....
Sending it since 1997.
Not trading advice. This is artwork.


US Election -- 3rd party Percentage100% - Biden % - Trump %
Easy 'Math Chart'
I expect this to continue to decline as we get closer to Nov 3
People will choose the lesser of two evils however they see it
Much love
xoxo
snoop

PARTY CITY - potential H&S reversal patternThese are my thoughts on PRTY. They are meant to give you an idea, not trading advice.
Party City is very low at these levels.
It looks like this stock is about to start building the right shoulder, to form an inverted Head and Shoulders pattern, which according to the textbooks is bullish.
If this is so, a buy at the lows of the forming shoulder would be a very good buy to enter a long position.
There's a gap at the end of 2019 that could get filled, what should take the price to about 5$.

PRTY - Potential Bottom Swing PlayParty City is in no way sheltered from the current state of things. Most stores are probably shut down, but with all the increased buying I believe we have hit a bottom and can break up to an upper channel off its most recent move.
I do not have any shares of PRTY but will be looking on monday to buy in the area of 0.58-0.61 if I get the chance. First price target is 1.18 and depending on how strong the move is, I may ride some up to 1.66.
This is only a swing idea, I am not necessarily bullish on PRTY, but I do believe in the swing potential setup here.

Free invitation to Bear Party EUR/USDI think short position is a possible winning position. In D-Chart we can see Price in a range with very clear and strong trendlines. Well, price bounced back from previos High as expected. Now I assume a continuation of the downtrend and everyone can jump on that train to the bear party. We expect price to move into that Diverse Bull/Bear Party-Box (Yes i made that up) waiting for Priceaction with short bias. Stop Loss should be higher than the Diverse Bull/Bear Party-Box.


ICX BREAK-Out inc?Something else to say?
Looks good. :-) Wait for Breakout and Pullback and get in by Limit-Buy. ;-)
Good Luck and nice trades. ;-)
Peace


Bitshares! Time to party like its 1999 $BTSBTCGood evening followers,
Today I am providing you, a high timeframe chart of Bitshares. Indicators are starting to look very promising, as is the chart. After having broken the longterm wedge, BTSBTC has transformed into a fantastic bullmarket, showing beautiful potential for significant gains. As mentioned above, this is a high timeframe chart (1d), to which I will be trying to ride the big waves. The fantastic crash cycle has ended, and is ready for a fresh new start- having seen the first wave to which we are breaking out . As volume is gradually decreasing as we move up, I am expecting a massive volume surge within coming week, breaking out of current levels (upwards).
Thanks for reading, may you have any questions or remarks feel free to post them beneath!
Kind regards,
Gabriel Molenkamp
