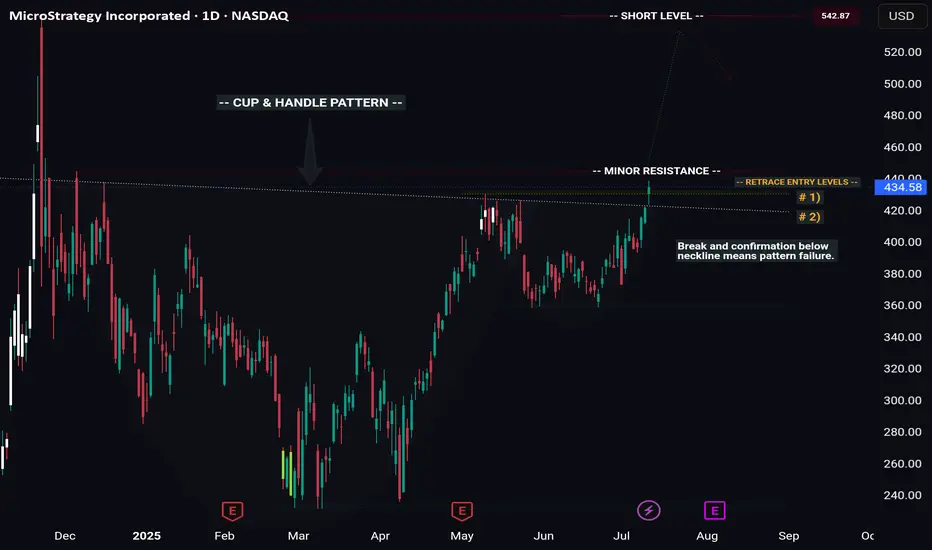
MSTR -- Cup & Handle Breakout // Long & Short SetupsHello Traders!
There is a beautiful cup and handle pattern that has formed on MSTR (Microstrategy).
This pattern offers us a wonderful long setup, as well as a potential short at the all time high.
Pattern Failure: If price both breaks and confirms below the C&P neckline the pattern is void.
Price will likely temporarily pull back from the all time high, giving us our short setup. However you'll want to be in and out quick considering price will likely continue to new highs after pulling back.
I will be swing trading the long setup and likely day trading the short setup.
Have fun and best of luck to everyone on their trading journey!
Patterns
11.07.25 Morning ForecastPairs on Watch -
FX:EURUSD
FX:EURCAD
FX:EURAUD
A short overview of the instruments I am looking at for today, multi-timeframe analysis down to what I will be looking at for an entry. Enjoy!

$OTHERS: Decision Time for AltcoinsDecision Time for Altcoins
Unless something drastic changes — like Trump firing Powell and cutting rates to 0% — the chart suggests a potential correction.
MACD is overheated, RSI is overbought, and we're hitting major resistance. An ABCD or extended ABCDEF pattern seems likely, with a upside target around $260B amd a downside support at $230B in total altcoin market cap.
Of course, the market can always choose to ignore the signals and continue its uptrend directly to the next resistance at $260B.
Stay sharp. Let’s see how it unfolds.
DYOR.
#Altcoins #Crypto #Bitcoin #ETH #MACD #RSI #TechnicalAnalysis #CryptoMarket #DYOR #PriceAction

10.07.25 Morning ForecastPairs on Watch -
FX:USDJPY (live position)
FX:EURNZD
FX:EURUSD
A short overview of the instruments I am looking at for today, multi-timeframe analysis down to what I will be looking at for an entry. Enjoy!

09.07.25 Morning ForecastPairs on Watch -
FX:GBPUSD
FX:EURAUD
OANDA:JP225USD
FX:USDCAD
A short overview of the instruments I am looking at for today, multi-timeframe analysis down to what I will be looking at for an entry. Enjoy!

08.07.25 Morning ForecastPairs on Watch -
FX:EURUSD
FX:USDJPY
A short overview of the instruments I am looking at for today, multi-timeframe analysis down to what I will be looking at for an entry. Enjoy!

Bulls Could "Wedge" Their Way Into Higher Prices On EGOANDA:EURGBP has made some impressive moves up since the Low from May 29th and Price just fell short of the Highs of April 11th before falling into a very familiar Bullish Pattern, the Falling Wedge!
The Falling Wedge is typically a Bullish Pattern where we expect Price to give us a Bullish Break of the Falling Resistance and Successful Retest of the Break before Price heads Higher!
Wedge Patterns can play both Reversal and Continuation Patterns dependent upon the location they form and surrounding Major Support/Resistance or Highs/Lows. In this case, we will be looking for a Continuation with Price being in an Uptrend before pausing slightly for a Consolidation Phase to form the "Triangle" of the Pattern.
*It is important to note that both the Falling Resistance and Falling Support have only been tested twice where three tests of both Trendlines should point to a strong equilibrium from both Bears and Bulls, validating the legs of the Triangle and strengthening the Consolidation Bias. ( So we could see Price test the Falling Resistance one last time before falling down to the Falling Support for a 3rd test! )
Lastly, when it comes to a Wedge Pattern, we should suspect that once Price makes a 3rd Test of the Falling Support and Retraces to the 50% Fibonacci Level @ .85887, this will signal the End of the Consolidation Phase!
- And this will be the time to enter!
**Once the Pattern is Confirmed and Breakout is Validated, based on the "Flagpole" or Rally prior to Price falling into the Consolidation Phase we can anticipate Price to potentially rise to the most recent High on April 11th of .87374 and give the next Previous High on November 16th 2023 of .87657 a try!
Fundamentally, news is light this week for both currencies in the pair with GDP m/m releasing for GBP on Friday, July 11th with a Forecast of .1%, a .4% increase from June's -.3%
Also, CPI y/y for GBP will be released the following week on Wednesday, July 16th.

07.07.25 Morning ForecastPairs on Watch -
FX:AUDCAD
FX:USDJPY
FX:EURUSD
A short overview of the instruments I am looking at for today, multi-timeframe analysis down to what I will be looking at for an entry. Enjoy!

EURNZD Trade Recap +3% 2nd July 2025A long position taken on EURNZD for +3%. Full explanation as to why I executed on this position and also my management plan I put in place.
Any questions you have just drop them below 👇

04.07.25 Morning ForecastPairs on Watch -
FX:GBPJPY
FX:USDJPY
OANDA:XPTUSD
FX:EURCAD
A short overview of the instruments I am looking at for today, multi-timeframe analysis down to what I will be looking at for an entry. Enjoy!

03.07.25 Morning ForecastPairs on Watch -
FX:EURUSD
OANDA:XPTUSD
FX:CADJPY
PEPPERSTONE:HK50
A short overview of the instruments I am looking at for today, multi-timeframe analysis down to what I will be looking at for an entry. Enjoy!

EURAUD -0.7% Short and AUDUSD MistakeA short position taken on EURAUD for a small loss after manually closing before swaps. I have also included a breakdown of a +4% AUDUSD long I was looking at taking but a small error on my behalf that caused me to stay out of the trade. Full explanation as to why I executed on this position and made the decision to manually close at the level I did.
Any questions you have just drop them below 👇

02.07.25 Morning ForecastPairs on Watch -
FX:EURNZD (Live)
FX:EURJPY
FX:GBPJPY
FX:AUDCAD
A short overview of the instruments I am looking at for today, multi-timeframe analysis down to what I will be looking at for an entry. Enjoy!

01.07.25 Morning ForecastPairs on Watch -
FX:EURNZD
FX:GBPCAD
FX:EURUSD
FX:GBPJPY
A short overview of the instruments I am looking at for today, multi-timeframe analysis down to what I will be looking at for an entry. Enjoy!

30.06.25 Morning ForecastPairs on Watch -
PEPPERSTONE:HK50
FX:EURJPY
FX:GBPJPY
FX:GBPUSD
A short overview of the instruments I am looking at for today, multi-timeframe analysis down to what I will be looking at for an entry. Enjoy!

26.06.25 Morning ForecastPairs on Watch -
FX:EURUSD
FX:EURCAD
FX:GBPCAD
A short overview of the instruments I am looking at for today, multi-timeframe analysis down to what I will be looking at for an entry. Enjoy!

25.06.25 Morning ForecastPairs on Watch -
FX:AUDUSD
FX:NZDUSD
FX:EURAUD
A short overview of the instruments I am looking at for today, multi-timeframe analysis down to what I will be looking at for an entry. Enjoy!

Potential Bearish Crab on Platinum, as seen on the weeklyI have just spotted a potential bearish crab pattern on platinum as seen on the weekly time frame.
I will discuss this setup in more detail, including video analysis, and attach the link to the write-up.

24.06.25 Morning ForecastPairs on Watch -
FX:AUDNZD
FX:USDJPY
FX:EURCAD
A short overview of the instruments I am looking at for today, multi-timeframe analysis down to what I will be looking at for an entry. Enjoy!

23.06.25 Morning ForecastPairs on Watch -
FX:EURAUD
FX:EURNZD
FX:EURUSD
A short overview of the instruments I am looking at for today, multi-timeframe analysis down to what I will be looking at for an entry. Enjoy!

Bitcoin - Will it explode up or down?Introduction
Bitcoin (BTC) is currently trading within a symmetrical triangle pattern, forming a series of higher lows and lower highs. This price action indicates a tightening range as the market approaches the apex of the triangle. A breakout is becoming increasingly likely in the coming days, and traders are now watching closely to see which direction BTC will choose. Will it break to the upside or the downside?
Pattern Trading
The symmetrical triangle has been a consistent feature of BTC’s recent price action. Price has been oscillating between the descending resistance and ascending support trendlines, gradually compressing the range. Based on the current structure, Bitcoin could continue moving within this pattern until around June 26th, when the triangle becomes extremely narrow and a breakout becomes imminent. Historically, such setups can produce false breakouts or “fake-outs,” where the price temporarily moves in one direction before sharply reversing and breaking out in the opposite direction. These moves often trap traders who enter too early, so caution is advised. Market manipulation is not uncommon in these tight formations, making it essential to wait for confirmation before entering a position.
4H Fair Value Gap (FVG)
Bitcoin has recently filled a 4-hour Fair Value Gap (FVG), a zone that often attracts price due to inefficiencies in the market. Now that this gap has been filled, there could be increased selling pressure, potentially pushing BTC back down toward the lower boundary of the triangle. If BTC is unable to break through the resistance created by this FVG, we may see more bearish momentum. However, should BTC manage to break and hold above this imbalance zone, it would be a strong sign of bullish intent and could open the door for a move to the upside. For now, though, this area remains a significant resistance level.
Upside Target
If BTC manages to break out of the triangle to the upside with strong volume and confirmation, the first major resistance level is around $109,000. This would be a logical target for bulls, as it represents a key zone of liquidity and previous interest. A successful move toward this level would confirm the bullish breakout and could set the stage for further gains, depending on broader market sentiment.
Downside Targets
Conversely, if BTC breaks below the lower trendline of the triangle, the first area to watch is around $103,500. This level is where a significant amount of liquidity has built up, and it could act as initial support. However, if that level fails to hold, the next key psychological level to watch would be $100,000. A drop below this milestone could trigger panic selling and further downside, especially if market sentiment turns negative.
Conclusion
At this point, BTC is at a critical juncture, and traders should remain patient as the market decides its next direction. While the current rejection from the 4H FVG suggests some short-term bearish pressure, the overall pattern remains neutral until a confirmed breakout occurs. Trading within the triangle can be risky due to the possibility of fake-outs, so it’s best to wait for clear confirmation before committing to a trade. Stay cautious, manage your risk carefully, and prepare for volatility as Bitcoin approaches a decisive move.
Disclosure: I am part of Trade Nation's Influencer program and receive a monthly fee for using their TradingView charts in my analysis.
Thanks for your support.
- Make sure to follow me so you don't miss out on the next analysis!
- Drop a like and leave a comment!

20.06.25 Morning ForecastPairs on Watch -
FX:EURJPY
FX:EURNZD
FX:EURUSD
A short overview of the instruments I am looking at for today, multi-timeframe analysis down to what I will be looking at for an entry. Enjoy!

EURUSD +3% Trade Recap 17th June 2025A short position taken on EURUSD for +3%, full explanation as to why I executed on this position and made the decision to manually close at the level I did.
Any questions you have just drop them below 👇
