ETH - Change in Trend windows for today.COINBASE:ETHUSD has a couple of nice expected turn points today. The majoe CIT window is around 1pm. So looking for a high or a low at this time to get a trade set up.
For this to work we need a rally/sell off into the time zone. This gives us a 20-30min opportunity for a change in trend.
I hope this helps. Enjoy the day. 👍👍
Patterns

CHFJPY - ShortI haven't shared in a while...
Big Head and Shoulders pattern followed by an impulsive break of that neckline and resulting in a nice correction to retest that neckline. Classic bearish flag pattern.
Disclaimer:
Please do not follow anyone blindly, not even me. This is only my opinion and not trading or financial advice

Symmetrical Triangle Breakdown Recovery Looking at two different Symmetrical triangles on on GBPAUD and LUNCUSD
Both have broken down out of there triangle
This can lead to a recovery although
A double bottom is perfect for this scenario
It removes the bearish presence while providing a setup for the bulls to advance
On both charts the double bottom could be concealed within a smaller structure

EURUSDWedges are not my favourite form of analysis I have to admit, but we are seeing EURUSD breakout of this Consolidation period, with a strong bearish candle, we also have divergence in our RVI indicator, we could look for a small pullback and take a short position on price action back to the lows.

GJ Cup and HandleGBPJPY makes cup and handle pattern and we can look to buy the break to catch some serious upside momentum. Feel free to check out my other posts on GBPJPY both on a weekly timeframe and a more fundamental outlook in the JPYX post.

AutoFibRetracement !! $AMC #PinkFloyd CoverAdded fibretracement and the indicators are pointing towards a rise in price.
#notfinancialadvice

Wait always for a retest!Waiting for a retest is necessary when we talk about patterns. As you can see in this scenario, the price tried to break the pattern, but it just created fake-outs. Waiting for a retest will save you many stop losses!

Cool Triangles Autodrawings #AMCHad to post this pattern from the Autodrawings tools, cool indicators in there, Thank you @TradingView !!
Pretty cool stuff in the toolbox.
$Amc look at that! negative beta at work on a monday? /cheers!

Right Angled Descending Broadening WedgeChart Story here is.. from a Ascending broadening wedge the bears took it down.. and there was a great chance that a Bullish divergence would appear.
It did... course went up and so a Descending triangle formation was there to bring the course down again. Because the price then widens a bit on the downside in a sideways move, I consider it a Right Angled Descending Broadening Wedge for now.
Besides this pattern, you could probably also make a W pattern out of it but the characteristic of the Broadening wedge is "often", that after hitting the top or bottom 2 or 3 times the price comes back halfway during a rise or fall and then breaks out.
these scenario's makes it possible to trade them but in times of macro economic uncertainties at the moment, caution is advised at all times. manage your risks at all times.
disclaimer: this is not a financial advise


DJI - Cash Market Gaps. DJ:DJI had the rally this week and finished with a strong volume day on friday.
Looking to this week we have a Gap to be filled from the previous drop at around 32300.
This lines up with the 707 from recent high and low. We also have 1 SD @ 32690. Anything above these levels could mean we have some sort of major low in place.
At this level there is a Similar retracement from previous rallies.
Some more higher prices could be seen this week.
I will be looking for pull backs to enter long for now.
I hope this helps, Enjoy the week.

EURUSD - A move higher firstOANDA:EURUSD is edging higher towards the upside target around 1.07000.
A move back to 1.0520-1.0540 would be a low risk opportunity to go long.
At the upside target there are a lot of pattern completions, this would bring the DXY down as well before it heads higher towards its upside target of 121.
Enjoy the day.

GOLD - UGLY BUT STILL MOVING NICELY. OANDA:XAUUSD is just bouncing around being a little ugly. But there are still patterns in play.
If we can hold this 1830 area then there is a chance of 1880-1890 before more selling.
Otherwise below 1820 and we could be on the way to the low 1700s.
Update for now.
Enjoy the day.

WTI 21 of JuneWTI, as every day, was in the middle of a pattern. We waited for a breakout and then we entered easily.

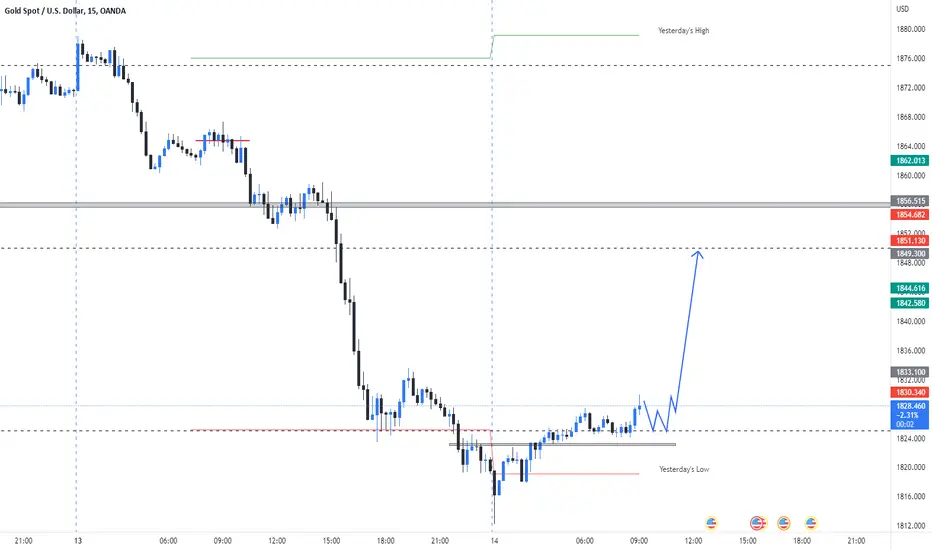
📊#XAUUSD - I'm looking for a buy opportunity.Yesterday we hit a previous weekly low, today I'm looking to buy gold.
📌The entry point confirmation for me would be *Engulfing or Pin Bar Candlestick Pattern, W-M patterns... *on 5-15 min timeframe.
⚠️Important - Risk per trade 1-2%
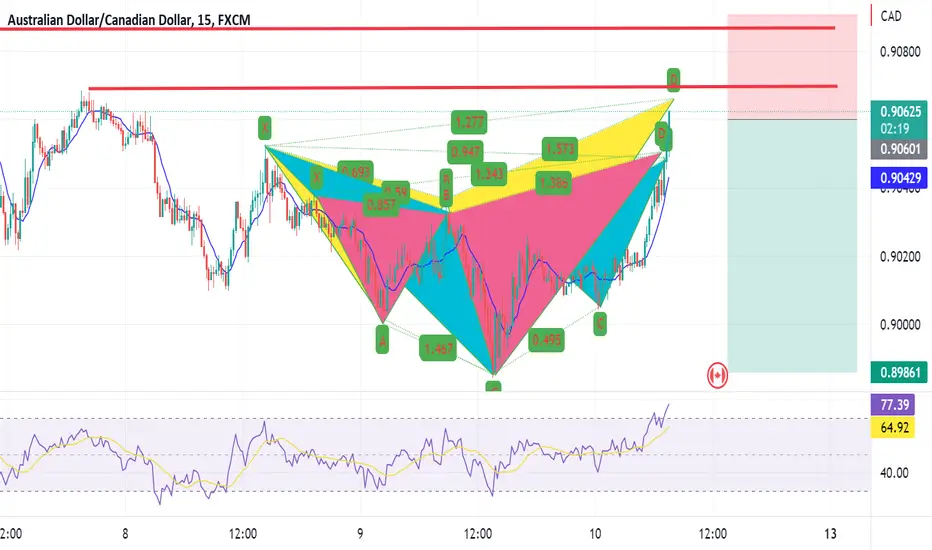
Why selling AUDCAD is almost a sure winIf you ever want the perfect trade, this could be it.
D1 trend is down
H4 is down
Touching the H4 MA now
There are 3 harmonic patterns.
Despite all of this, we will wait for a M15 reversal to get in. Likely in 2-3 hours from time of posting.

GOLD - Critical price area!!OANDA:XAUUSD is sitting at an intersting price level.
We had the sell off from the high on Friday, now we are at a point where it could head higher for one more leg to the 1912 area or this correction is over after hitting the 382 twice over the last couple of weeks and we will see lower prices.
If this is it then our downside target is 1660 but there is a chance of a lot lower prices but I will cover that going forward. For now we just see how we open on Monday and find a place either way from there.
I will post smaller TF charts with intraday levels to watch.
Also I will post the AI for the year which gives me that downside bias.
I hope this helps, enjoy the weekend.

📊Why do the trading patterns work?Hi friends! Probably all traders began their career by learning the trading patterns.
A trading pattern is a price movement pattern in a certain range. Generally there are 2 types of patterns: candlesticks (shooting star, hammer, bullish or bearish engulfing) and figures (triangles, channels, flags, head and shoulders, etc.). The number of them is constantly increasing, through the change of market, but there are up to 50 main patterns.
📊So why do the trading patterns work?
The answer is very simple - because many traders use them in trading. Imagine a traffic light with a red light🔴 According to the rules all drivers who have the same signal stand waiting for a green light✅ Here, it lights up and allows all cars to move in the right direction. It's a clear rule, not only in your country, but in all the countries in the world. The situation is the same with trading patterns.
Let's imagine that a chart is a road, and a pattern is a light. The price rises or falls and a pattern is formed. You have determined that it is a bullish pattern, such as a bullish wedge. Of course, you are waiting for the wedge to move to the upper boundary and break it up, that will be a signal to open a trade (green signal to move✅). At the same time, all the drivers (read as "traders") begin buying with you and pushing the price higher and higher.
Why do traders do this? As I said in the beginning, patterns, like the rules of the road, are learned by all traders, regardless of nationality, this is the general rule, that is why these patterns work.
📊In what cases do they not work?
As you know, most people in the market can't be right. Conventionally, if everyone opened a long and bought Bitcoins at $50,000 and the price went up to $100,000, then someone should have bought those Bitcoins from you for 100% more. If everyone held a long, there would be no one to sell and no one would make a profit in the end. That's why there are always 2 sides in trading: buyers and sellers.
With the increasing popularity of patterns, most traders and especially beginners who first study patterns began to open trades according to these rules and .... took a loss. Patterns work especially badly on the cryptocurrency market, which shows how young this market is. But why? All because most cannot be right when trading patterns, otherwise no one would make money.
📊What should I do if I trade only paterns?
I would recommend adding more rules to your trading strategy. These can be different trading tools, filters which will help you to remove "fake" signals and increase win rate. For example, trade not the triangle pattern, but its false breakout using a volume indicator:
1️⃣A false breakout in most cases shows that the price will not go in the direction of the breakout, as there are too many willing to open a trade in the direction of the price movement.
2️⃣The volume indicator will show the actual number of buy and sell orders. If the volume at a false breakdown of the lower boundary of the triangle has increased - this tells us that the price is more likely not to move down, as there is serious support there.
This is the simplest example. You can also use indicators, additional trend lines, candlestick or fundamental analysis.
💻Friends, press the "like"👍 button, write comments and share with your friends - it will be the best THANK YOU.

FRR - STRONG Bounce coming - x5 - 15x profits🌇Hi cryptoTraders,🌆
✔️ Strong Uptrend now on FRR/USDT with easy break of 0.015 level. I expect a move to 0.09 usd min very soon, then go full bullrun.
📌My entry point: 📌
0.012 usd - 0.015 usd
💰 My targets: 💰
0.20 usd - 0.40 usd
------------------------------------------------------------------------
👑👑 BTC , the king of crypto :) 👑👑
------------------------------------------------------------------------
🤞🤞ALTSEASON 🤞🤞
😎 Regards 😎


PHUN Bullish Run If...as you can see we have 2 circle areas, 1 is down above the 1$, which is our bottom to confirm that we still respecting our ascending line, and 2 is up just below the 2$ resistant level, and there where we going to see a massive bullish volatility if we broke it and hold above it .
