FLAG and PENNANTHello everyone!
I want to tell you a little about such figures as Flag and Pennant.
These patterns are quite common on the chart, so every trader should know how to trade them.
What does the flag look like?
After a strong movement (flagpole), the price begins to correct in the form of a rectangle, which corrects against the previous trend (flag).
What does a pennant look like?
Just like a flag, a pennant appears after a strong trend.
After that, the correction begins in the form of a narrowing triangle.
How to trade the flag?
A bullish flag is a flag that has formed after a strong upward movement.
The entry point for a bullish flag will be a breakout and anchoring the resistance of the rectangle (flag).
The stop is placed at the low of the flag.
To calculate a possible profit target, it is worth measuring the flagpole of the flag - this value superimposed above the breakout will be the target for your profit.
How to trade a pennant?
A bullish pennant forms after a strong bullish move.
To find an entry point, you need to wait until the resistance of the triangle is broken and the price fixes above the level.
Stop loss is usually placed below the nearest minimum.
To get an approximate profit target, you need to measure the length of the bullish move in front of the triangle - this value will be your target above the break.
Conclusion
These patterns are very common and give an excellent risk / reward ratio, usually greater than 1: 3.
With correct trading, the profit value will be even higher.
Do not forget that these shapes are continuation shapes.
And don't forget to set your stop loss.
Good luck to you!
Traders, if you liked this idea or if you have your own opinion about it, write in the comments. I will be glad 👩
Patterns

BTC about to break out following the pattern Zooming out really helps simplify things. Volatility by Jan 14th…
Also interesting MACD setup.

Jasmy Coin T-9 to breakout of our triangle -Target Remains .27+In this video:
* I am just readying my followers for a Jasmy Triangle break soon!
* Targets of .27 cents up to .42 cents remain in place
Best of luck traders!

HEAD AND SHOULDERSThere is probably no more famous figure than the HEAD AND SHOULDERS.
Head and shoulders - gives a very profitable signal about the market reversal.
Thanks to this figure, you will be able to open a position at the beginning of a new trend.
What does it look like?
The appearance of the Head and shoulders figure consists of five stages:
1. Uptrend;
2. Left shoulder;
3. Head;
4. Right shoulder;
5. Neck line.
First, we need to find an uptrend on which the left shoulder will form.
After that, the price makes the last rise, forming a head, after which the fall begins.
The right shoulder appears on a downward movement, and the neck line can be drawn after the formation of the right shoulder.
How to trade?
The entry point is the breaking of the neck line.
It is at this moment that the signal of the figure is confirmed.
Some traders are in a hurry and open positions at the peak of the right shoulder, which is very dangerous.
Always wait for the confirmation of the figure.
Don't worry if you missed the first entry point, there is always an opportunity to open a position after the neck line retest.
What about setting a stop loss?
Stop loss is usually placed above the right shoulder.
If the price went above the right shoulder, then the figure did not work, and it's time to exit the deal.
Where will the profit target be?
To calculate possible targets, the following method is used.
It is necessary to measure the distance from the neck line to the maximum of the head, the resulting value is imposed below the penetration of the neck line, after the right shoulder, this will be your goal.
Conclusions
The Head and shoulders figure can bring you a lot of profit when trading correctly.
It is worth noting that there is an inverted head and shoulders figure - and this figure signals a reversal and the imminent beginning of a bullish trend.
The rules of trading are the same as when trading Head and shoulders, but only in a different direction.
Trade using not only your shoulders, but also your head !
Traders, if you liked this idea or if you have your own opinion about it, write in the comments. I will be glad 👩

GBPUSDi think we will see some jumps in gbpusd , 5 th wave might be pending , then we will have some huge crash

Ascending & Descending Triangle Triangles are very often found on the chart, but not everyone knows how to trade them.
Today we will try to learn how to trade triangles correctly.
What does it look like?
The ascending and descending triangle have two sides: one side is flat and horizontal, the second is inclined and moves towards the first.
The ascending triangle has an upper flat horizontal side, and the lower one is inclined.
When you see this figure, you have to wait for a bullish movement.
The descending triangle is a mirror image of the ascending triangle.
With a descending triangle, there is a flat lower line and an upper inclined one, which moves in the direction of a flat one.
If you see this pattern, expect a bearish breakout.
Opening a position
There are three techniques for opening a position:
1. Stop order at the level.
2. Fixing the level.
3. Retest of the triangle trend line.
Each method is good in its own way, but the logic is the same everywhere – a breakthrough of a flat line and further movement towards a breakthrough.
Therefore, if the price starts moving against the breakout, most likely the figure did not work, and in order not to lose money in such situations, set a stop loss.
Stop Loss
You need to set a stop loss in a place where it will be clear for sure that the figure did not work.
Usually this point is located behind the inclined line of the triangle.
Profit taking
There are two ways to fix profits:
1. Trailing stop.
2. Graphical projection of the price.
The trailing stop is set according to your trading strategy and there shouldn't be many questions if you have a strategy.
It is easy to calculate the fixation point from the graphical projection: it is enough to measure the width of the base of the triangle and put the resulting value below the punched flat line – this will be your goal.
Conclusion
These figures are quite common, so it is important to know how to trade them.
Do not forget that nothing works in the market 100% of the time, so set a stop loss.
Good luck!!

Sol -H4- Jan / 2022 OverviewHappy New to All !
We are going for a quick look to the charts just to get a bigger picture.
I’m not diving to any technical details this time, still too early to get sleeves up !
Share You thoughts, likes and TA!
PS: trendline has been drawn just for illustration purpose

BTC Same old song and dance.Not sure why most people are unable to understand that the higher the price goes the more money it is going to take coming into the market in order to drive the price up higher.... Bitcoin Has never changed its cycle and probably never will like most things in life..
CYCLE - An interval of time during which a characteristic, often regularly repeated event or sequence of events occurs..
The only thing that has changed with bitcoin is the amount (%) it achieves within this cycle.. Bitcoin will not go to 100k This year nor will it next year.. With so many other projects coming into the space i would almost find it unlikely to ever see BTC at such high prices as some of these "Youtube Traders" wanna Flop and Grope to everyone..
Take off the Tin Hats... Turn off all the noise. And Use your Common sense, And Don't ever fall in love with an idea of where you want price to go or where anyone else says it will go....
We are in the midst of a Recession in the economy and I find it almost too obvious yet am amazed that So many can't see what is really happening in our world right now... Buckle up Traders. It's going to be a Wild decade..

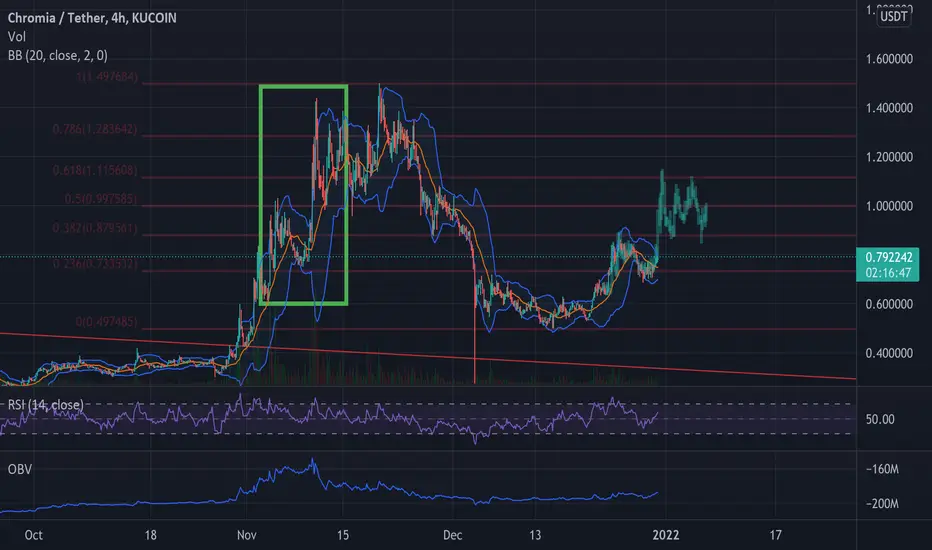
Could this pattern repeat on Chromia?Chromia has been doing pretty well after recovering from the december lows. Holding well in this dip and already gaining upwards momentum.
I couldnt help but realise this pattern re occur (one in green rectangle). if you look closer it is very similar and if it plays out could signify a local top at the 618 level of the current fib retracement from the dip.
Furthermore the red line you see all the way down is a trend line that exists from previous ATH to subsequent tops and once that broke CHR flew like there is no tomorrow.
The recent crash wick retested this line so it is possibly a nice confirmation of upward move.
Seasonal Futures Trading Patterns S&P 500 Hey traders today I wanted to go over what I believe are the best Seasonal Futures and Forex trades during the year. There are many markets that have seasonal patterns. Such as Forex, Stocks, Futures, and Commodities. Knowing the best time to trade to look for these Seasonal Futures and Forex opportunities will help you in your trading. This series on Seasonal Futures and Forex will be ongoing with several videos. The first video will be about the S&P 500 futures and how to trade them seasonally.
Enjoy!
Trade Well,
Clifford

PATTERNS "BAT" and "CAT".Strange as it may seem, but not only bulls and bears can be found on the market, but also a couple of cats and even a bat!
But don't be afraid, these animals have come to help you get rich in the new year.
Let's go!
The Bat pattern.
The bat is a 5-point pattern that can indicate a bullish or bearish breakout.
What does it look like?
The pattern consists of five points:
X is the beginning, from this point the price makes a significant movement;
A - here the price unfolds, forming the first vertex;
B is a pullback, which can be from 38% to 50% of the X – A movement.
C is the price movement, which can range from 38% to 88% of the A – B movement. It is worth noting that C should not go above the point A.
D is the price reversal, after movement C. The shortest movement of all other points. At this point we are looking for an entry into the transaction, you can use the Fibonacci lines. The movement from point D can be 88% of the movement of X-A, and can go above point A.
Risks
The stop loss can be set below the D point, but not below the X point.
The CAT JUMP pattern.
This pattern is characterized by a strong downward movement and, with proper trading, can bring huge profits.
How to find it?
The pattern appears in situations of strong movement, usually caused by bad news.
The following pattern will be observed on the graph:
1. A sharp drop in price, sometimes with a gap;
2. Rollback to the bottom line of the gap;
3. After which there is a long and strong fall.
How to trade?
To begin with, you need to find a strong drop with a gap, as correctly accompanied by a strong volume.
After that, we are waiting for a pullback to the bottom line of the gap and a reversal – this is where you can enter into a deal.
Risks
The stop loss is placed above the lower gap line.
It is worth noting that from time to time the price may go above the lower gap line.
In rare cases, the price reaches the upper level of the gap, and then falls.
It is important to note that the fall lasts from one month or more, which is why this pattern is used by long-term traders.
Important
It is worth recalling that there are alternative patterns: an INVERTED CAT JUMP and a BEARISH BAT PATTERN.
Both models work the same way, only in the opposite direction.
These figures are very profitable, with proper trading.
For example, a fall after a gap and a rollback can be 50% or even 70%, in the CAT JUMP pattern.
Whatever pattern you trade, I wish you good luck and a lot of profit in the new year!
Traders, if you liked this idea or if you have your own opinion about it, write in the comments. I will be glad 👩

EURCHF break below 1.03700 then we can see harder crash towards my target 0.5 fib , wave 1 and wave 2 retraced 0.618 fib levels .

EURJPY - In Trend Engulfing Long Setup 4HEURJPY has set up a perfect in trend engulfing long setup on the 4 hour time frame.
The engulfing candle formed on Dec 23rd at 8am (closed at 12pm noon CST) engulfed 6 previous candles.
The engulfing candle also closed above resistance of the previous highs.
Price rejected the 61.8% retracement level perfectly which confirms this setup.
Entry at 61.8% retracement level.
SL 2 pips below the engulfing candle low.
TP set at 3X the risk.
Very similar setup to CHFJPY.


WMT Ascending Triangle tradeMassive ascending triangle forming. You don't want to miss out on this one
I would wait for a few more days to see if it is following the pattern. If it stays in the pattern until mid-late January, it will breakout hard to at least $150 if not even higher.
Just keep watching the chart. Don't act on emotions, don't act recklessly, don't be rash. I am personally going to buy calls if the pattern holds until Jan 20.
This is not financial advice, I am not an investment advisor, these are just patterns I see.

AUDUSD. Intraday A.I Trade. AUDUSD has an intraday long opportunity based on my A.I time prediction strategy.
There are a lot of things coming together at the same time.
1. We have had a 120 point drop from the recent high with no 38.2% pullback yet.
2. We have the 89% retracement from the recent low and high 15m chart. This gives us a very low risk opportunity to see if its right.
3. There is an A.I expected turn area at 1200pm Jakarta time. If it is right then I'm expecting a 38.2% rally, or a rally into 830pm which ever happens first.
A short term trade with a great R/R ratio.
This strategy is time based not price, This is why I'm looking for an 830pm time not price.
If it goes sideways for 30mins or more then the set up will be invalid.

Fantom FTMUSD Charting on the fly. Learn with me. Target $4.00! In this video:
* I chart on the fly with you all so that you can see how I do what I do
* I chart trendlines, levels, fibonacci, and bullish divergence on the 4 hr.
* We can see a longer term swing trade target of $4.00
Best of luck traders!

Classic Crypto Chart PatternsJust met me somewhere.
Often times, traditional analyzes simply don't work in the unregulated crypto world.
Order books are sold by the exchanges,
evil wicks shake everything out that comes their way and
BART controls the rest.

Link Head and shoulder patternIf link breaks the 17.75~ support then it is probable that the price is going down to at least 13.26~13.00, given that the support has been holding it is too soon to know yet what will be happening.

GBPUSD GBPUSD , looks like we have completed a wave and the b wave , soon we will be moving towards the upside for the c wave target for 1.618 fib extension ,let's go

BNB chart explained ( General Idea )Hello traders, welcome back.
I decided to write down about my own watchlist during this unstable market, this way you can have a solid strategy on how to react in certain scenarios. during these series of Idea I will be talking about how the charts are looking, support and resistances and also what to expect in short, mid and long term.
* Keep in mind this is not a financial advice *
Now as you can see, BNB has been in a long term uptrend channel, everytime we tried to break out of it, we got rejected on around 650$ resistance zone.
you can also see our major support and resistance zones.
recently we broke the orange trend line, now what I expect is a ride toward our first support zone, I believe its going to be the reversal point, by any chance if we break that level the next support would be our reversal zone ( very low possibility ).
so basically you can DCA and place buy orders on each level, your goal would be ATH and after that if we broke the 650 there is going to be a bull market.
Good luck.
Don't forget to like and subscribe.

GBPAUD GBPAUD , looks intersting , we have completed the wave a and wave b , soon we might see some bounce towards the upside for the target around 1.618 fib extension . let's buy

USDCADWOW looks like we have competed the a wave and the b wave , soon it will drop towards the downside , over 200 pips gains gonna to lead , don;t miss this tradde
