BTC/USDT - heads and shoulders - what to expect? BITCOINHello dear friends.
New near-term goals for bitcoin for the day (this data is sent to me by my bot assistant.
Within 1-3 days. The price will be adjusted, as well as one of these boundaries will be broken.
Upper limit: 50555 - 51050
Lower limit: 43650 - 44550
BTC / USDT coin under consideration
Where I want to start is that I'm wrong, and a few days ago, we had 3 negative positions where we lost a little money. But the loss was returned, earned, and for the given moment we are in a good plus.
So I write right away - this is not financial advice, this is not a recommendation, and I am also mistaken, therefore, you should not take everything as if I forced you.
For this coin, the work takes place in a channel, a very large channel of accumulation / distribution of positions between a large player and simple traders.
The chart shows that the price was lowered to the middle of the channel, and the area was tested from the bottom up.
This suggests that the buyer will defend this zone in order to bring the price back to the 49000-50000 level.
Also, according to the FIBO grid, the price reached just the 0.618 level - where this level is corrective.
But I implore you to be extremely careful now, since the fact that the price is consolidating in a descending, widening wedge - the price may drop even lower.
All you have to do is slide past the 48250-48580 level now. It is the turning point.
If the price is fixed there at 2h TF, you can try to look for a place for a long.
To work out the pattern - HEAD AND SHOULDERS (secondary)
Another note is that at 30m TF - the price is consolidating in an expanding wedge, with a tightening to 46300-46600. If this zone is broken and the price reaches the level of 46000 You can look for a place for short positions.
The volume in the market will weaken, liquidity in the market suggests that something very strong and inevitable will happen soon ...
12CH TF - forms a global inverted head and shoulders pattern
But I have a premonition that we will fall very strongly, having collected liquidity, making a correction by 40-50% from the top, and then it will be possible to look for a place for long positions.
Globally - for me it is a short, if within a day, then lower the price to the level of 46000 and below, and even test the 45000 zone.
Since it is the 45000 zone that is the trend reversal now and the price hike down to 43500-43850
This Channel is not financial advise, It's My opinion and My observation: @opptrade
❗️❗️❗️Disclamer:❗️❗️❗️
Dear friends, traders.
My trading ideas here are not financial advice or coercion into action. I am not responsible for your trading and how you follow all aspects of correct trading.
- I do not recommend that you trade AT ALL if you do not know what risk management is, money management.
- I do not recommend that you trade without a STOP LOSS.
- And I'm not responsible for your "make millions of dollars fast" gag
- I am only showing you the charts that suit me for certain positions.
- For each position - RESPONSIBILITY LIES ON YOU.
If you don't use all of the above, your deposit will soon become $ 0
- Therefore, if you decide to follow my positions - Take responsibility for where the bad outcome may be.
In time, i to bee wrong too, and have a loss.
But with the correct observance of the indicated points, which trade with me others traders - they earn (NOT IN A DAY, but in the medium, long term)
I am only showing you how this or that scenario can work in trading.
Patterns

Gold longs,. a little bit of action from my intraday cycle perspintraday cycle perspective... charts flipped. Longs in action... what do you see ?

WW on a momentum potential retest of 37-38$ levels soonPositive reaction from earnings will retest previous levels of resistance around 37 to 38$.

UWMC Possible retest of 11 in the near futureNot the cleanest breakout from a falling wedge but a clear breakout from a falling pattern.

BTCUSDT triangle patternHi everyone. I think Bitcoin needs more corrections at this point due to the triangle pattern in 1h timeframe, also it owes a pullback to 41k resistance after the breakout. 41k seems a powerful support.

GME IDEAAfter a plunge to the areas of 48-55, price is bound to retrace up to 266 in a couple of days (literraly)
Just an idea, not a signal

BTC AI PredictionI've been running several algo's (only super_simplified versions here on TV) at the same time attempting to compute Probability distributions (DL based on SVM) of a mean reversion for COINBASE:BTCUSD at this level, and using Convolutional neural networks, to map current price action patterns with historic chart patterns across multiple sectors.
Here's the Alpha:
According to my model we should see a retest of the 54k-55k level before rejecting and correcting down to the mid 30k's.
Note: Probability theory is just PROBABILITY. Nothing is for sure. Human emotions are too random to accurately predict.
:)
MM

UMA/USD 4h Possible Cup and Handle by the End of MarchPlaying around with the price predictions I've came over the potential for a huge Cup and Handle pattern for the Unified Market Access USD pair.
Of course this is just one of possible scenarios and yeah, it's a positive one. Let's watch what will happen soon.
Meanwhile I'm using the market dip to perform dollar cost averaging for the UMAUSD pair.
This is not an investment advice as I'm not a financial advisor.
Make your investment decisions at your own risk and perform your own researches.
And REMEMBER: Likes and comments make your trades much more successful :)


the egld is in an ascending triangle, then "burnbabybun" ? ;-)the egld is in an ascending triangle, then "burn baby" ? ;-)


EURUSD SHORT: TRIGGER AND ENTRY USING RISING WEDGE PATTERN Price sold below the RWP (RISING WEDGE PATTERN) to 1.20952 before a pullback to retest lower channel trend line. A retest of the lower channel trend line is the trigger for a short entry which is bearish until the next logical support region. The first support region is at 1.20867-1.20789 and the second at 1.20269-1.20198 region on the chart.
The strength of a RWP depends on the measure of convergence of the trend lines at the apex of the channel trend. This is a good pattern for a short entry within a bullish trend.
Hope you've enjoyed the read, more RWP analysis ideas are welcomed!

XRP/USDT - Cup with handle. UPTREND❗️❗️❗️ More Trading Charts here: (LINK IN DESCRIPTION) ❗️❗️❗️
Good afternoon dear traders or those who want to trade, but do not know where to start.
I haven't written posts for a long time, but look at the market, there is something to work on and positions are rushed every day in large quantities. I decided to share one of them with you.
Many people love this coin, while others hate it. I make profit on it. The price has been consolidating in a downward channel for a long time. This is a bullish trade within which an under-block figure in the form of a cup with a handle is formed.
I am still waiting for the trade with the formation of the cup handle and after that impulsive growth. Therefore, we take this asset under the gun, find our entry points and make a profit.
❗️❗️❗️Disclamer❗️❗️❗️
Dear friends, traders.
My trading ideas here are not financial advice or coercion into action. I am not responsible for your trading and how you follow all aspects of correct trading.
- I do not recommend that you trade AT ALL if you do not know what risk management is, money management.
- I do not recommend that you trade without a STOP LOSS.
- And I'm not responsible for your "make millions of dollars fast" gag
- I am only showing you the charts that suit me for certain positions.
- For each position - RESPONSIBILITY LIES ON YOU.
If you don't use all of the above, your deposit will soon become $ 0
- Therefore, if you decide to follow my positions - Take responsibility for where the bad outcome may be.
In time, i to bee wrong too, and have a loss.
But with the correct observance of the indicated points, which trade with me others traders - they earn (NOT IN A DAY, but in the medium, long term)
I am only showing you how this or that scenario can work in trading.
For all your actions, only you are responsible.
💠💠💠I am not a scammer and I am concerned about your trade.💠💠💠
This Channel is not financial advise, It's My opinion and My observation: @opptrade

NZDUSD 4HR TIMEFRAMENZDUSD 4HR TIMEFRAME
Market Structure: Bullish
The purple rectangles that are placed are the equal highs/equal lows. I see a lot of liquidity where I placed the purple rectangles. Since it broke previous equal highs, I'm waiting for a retest right back toward the purple rectangle (resistance), then back up towards the green rectangle line which says (NEW TARGET AREA).
The blue line where the green rectangle is placed is my TP.
The buy setup is a 62 pip move.
However, if price reverses toward the downside, I'll wait until it breaks support (bottom purple rectangle), retest, then make an entry.
TP for sells are also placed & marked up. The sells are 83 pip move. If price goes either way, both setups are in place.
REMINDER: Always take profit/partial profit at TP1. Price majority of the time retests that area, goes back to entry, then smash TPS.

Chart Patterns Cheat SheetHello, traders!
Here is a cheat sheet which help you to identify the most frequent and reliable chart paterns. I should tell you that the patterns from the group "indefinite" are classified as bullish or bearish in classical literature, but in practice we should be careful using it in trading decisions.
BULLISH PATTERNS
Inverted Head & Shoulders , Double and Triple bottom are the most simple, frequent and reliable bullish pattern. Let's talk about bullish flag . It usually occur on the uptrend. The volume is high at the beginning of the flag and decrease to the end until the massive breakout to the upside with high volume.
The cup & handle is rare pattern and usually play out at the bigger timeframes.
INDEFINITE PATTERNS
The different types of triangles and wedges are very popular patterns and can be seen at the different timeframes. In classical books about TA rising wedge and descending triangle are bearish patterns, falling wedge and ascending triangle are bullish. But in practice it is very important to observe the side of it's breakout, as a result they can be bullish or bearish like the symmetric triangle . We should wait for the proper breakout confirmation to make a correct trading decision.
BEARISH PATTERNS
This patterns are the opposite to the bullish pattern, but work at the same way.
If you want to learn more about some pattern please give us to know it in comments.
DISCLAMER: Information is provided only for educational purposes. Do your own study before taking any actions or decisions.

EURJPY SHORT IDEAascending channel within a larger expanding pattern. looking for a 123 touch approach with corrective behaviour to the third touch of the outer pattern to be a high probability setup to the downside.

AUDCHF H1 - LONGBreakout off the major descending trendline and made a complex pullback onto previous structure; trendline and support area.
looking for a similar breakout fashion for a LONG position if we see a strong bullish move anytime now.

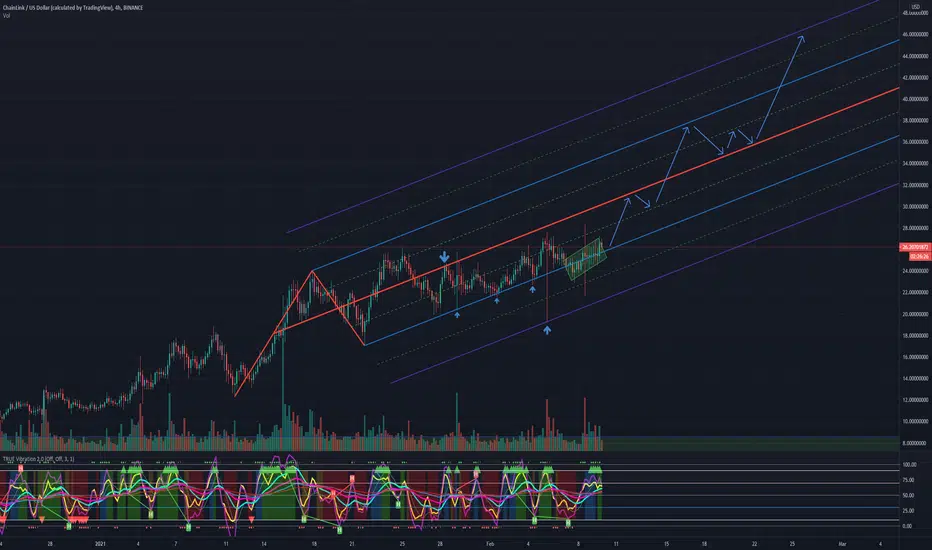
$LINK + Modified Schiff Pitchfork = Dead-on accuracyI love $LINK on the 4hr chart. I've been experimenting with fans and pitchforks, and this one is AWESOME for identifying pivots. I used the Modified Schiff pitchfork on this. Which is good for sideways market action, as it moves the median 50% up and 50% over in terms of price and time. Just look how it touches the .5 and the 1 deviations, but then wicks PERFECTLY down to the 2.0 deviation. Chainlink has been consolidating for what seems like forever now. I think this is just a matter of time before it breaks through the lower .5 resistance and the median. I'd look for a strong move in the next couple weeks? But I'll say it again. $LINK is a buy and hold for me. Long term investment and waiting for staking to be implemented before this thing goes to the moon.

EURUSD 1D TIMEFRAME EURUSD Analysis on the Daily Timeframe.
I usually do my analysis on the 4HR, however, looking at the chart on the daily looked more simple and easy to analyze.
Clear Head & Shoulders pattern occurring on the daily chart. (Yellow circle).
I am waiting for that last buy retest candlestick to close, so this may take about a day.
When a new daily candle forms, and it is a sell candle, I am selling.
I have provided an entry area (black line) if the new daily candle starts around that area.
I have provided TPS, and extra TP's as well.
If the candle however breaks the neckline and continues to buy, I will provide buy setups and a new analyzed chart.
REMINDER: Always take profit/partial profit at TP1. Price majority of the time rejects that zone, goes back to entry, then smashing TPS.

GBPUSD - ShortShort term short opportunities on this pair. Set your pending orders anticipating short moves to the downside.
Happy Trading!

Symetrical triangle bullish ideahi all , another idea here, as u can see its a clear pattern and is respecting it, its a clear buy signal at the bottom but be sure to use a stop loss in case it falls lower, but i really think we will bounce and go up from there,
be sure to like :}

XRP Patterns Are RepeatingBITSTAMP:XRPUSD
In this chart a highlighted some of the repeating patterns (those with the same color). They are very similar and could be used to predict some price action in a short term (blue colored price cart at the end, taken from a January 2021).
I am not a financial advisor so don't buy anything a say. Have a good one.
