Shriram Finance on Radar ! Bullish Setup !This is the daily chart of SHRIRAMFIN.
SHRIRAMFIN having a good law of polarity near at 580-600.
if this level is sustain then we may see higher prices in SHRIRAMFIN.
Thank You !!
Patterntrading

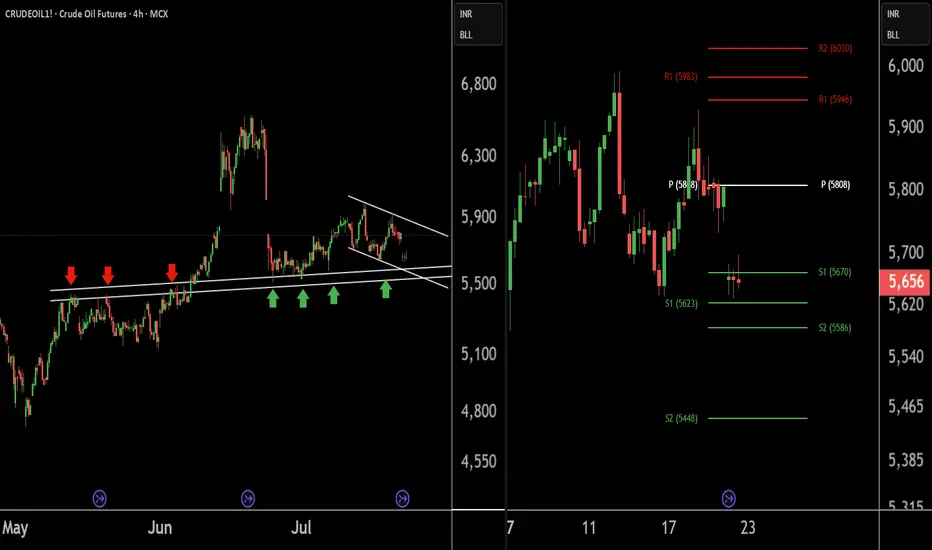
Crude Oil Buying Alert: Strategic Entry Point IdentifiedThere are two charts of Crude Oil on the 4-hour timeframe.
In the first chart, Crude Oil is sustaining near its lower point (LOP), with a support range of 5540-5580.
A-VWAP is also providing support to Crude Oil around the 5580 level.
The Pivot Point is also supporting Crude Oil around the 5580-5620 level.
If this level is sustain then we may see higher prices in Crude Oil.
Thank you !!
XAUUSD M30 BEST SETUP FOR TODAY📉 Gold Analysis:
🔸 Gold is forming an M-pattern – a potential bearish setup.
➡️ We can look for a sell opportunity if we get a strong candle closing below the M-pattern structure.
📈 Buying Setup (Support Zone):
🔹 There's a strong buy zone at the bottom, marked by:
✅ Fair Value Gap (FVG)
✅ Order Block (OB) confirmation
🕵️♂️ Wait for clear price action confirmation before entering any trades.

BANDHANBANKNSE:BANDHANBNK
Note :
1. One should go long with a Stop Loss, below the Trendline or the Previous Swing Low.
2. Risk :Reward ratio should be minimum 1:2.
3. Plan your trade as per the Money Management and Risk Appetite.
Disclaimer :
>You are responsible for your profits and loss.
>The idea shared here is purely for Educational purpose.
>Follow back, for more ideas and their notifications on your email.
>Support and Like incase the idea works for you.

EURUSD & US30 Trade Recaps 18.07.25A long position taken on FX:EURUSD for a breakeven, slightly higher in risk due to the reasons explained in the breakdown. Followed by a long on OANDA:US30USD that resulted in a loss due to the volatility spike that came in from Trump.
Full explanation as to why I executed on these positions and the management plan with both.
Any questions you have just drop them below 👇

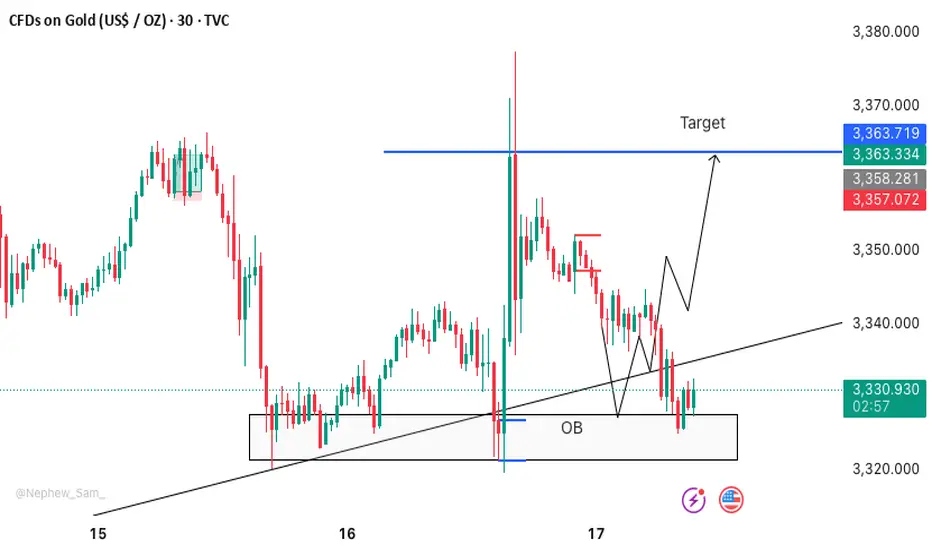
XAUUSD M30 BUY SETUP FOR TODAYScenario:
Best buy zone for Gold as of now: 3327–3323 💰
Strong Order Block zone + Double Bottom pattern 📉📈
Let’s ride the 🚀 from here — follow proper risk management! 🛡️📊
17.07.25 Morning ForecastPairs on Watch -
OANDA:US30USD
CAPITALCOM:DE40
FX:GBPJPY
A short overview of the instruments I am looking at for today, multi-timeframe analysis down to what I will be looking at for an entry. Enjoy!

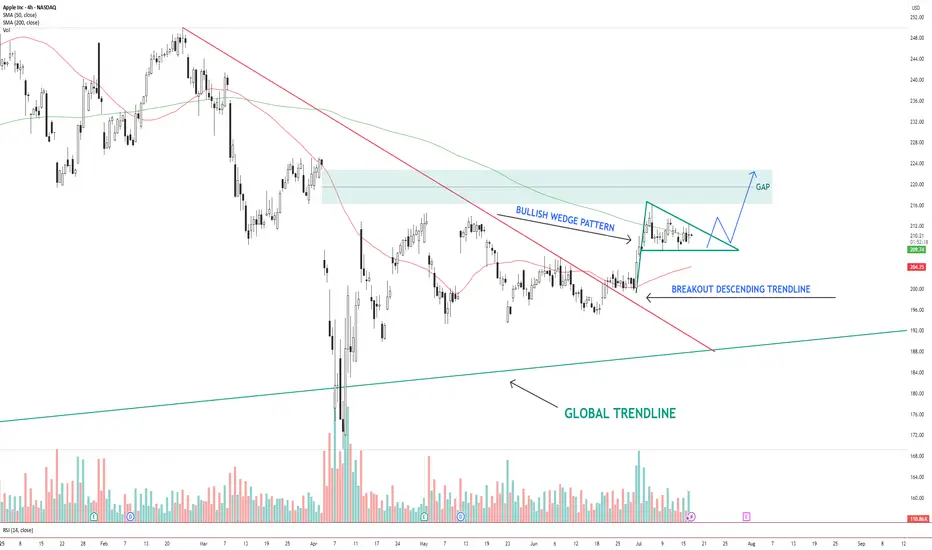
AAPL – Bullish Wedge Breakout Setup Toward Gap FillAAPL NASDAQ:AAPL has broken out of a descending trendline and is now consolidating inside a bullish wedge pattern . Price is holding above the 200 SMA and hovering near the 50 SMA.
The structure suggests a potential breakout above the wedge, with a clear gap area between $216–$224 acting as the next upside target.
Key levels:
Support: $206 (wedge base / 50 SMA)
Resistance: $216–$224 (gap zone)
Trend structure: Bullish consolidation after breakout
A clean breakout from the wedge with volume could trigger a continuation move toward the gap zone.
📌 Watching for confirmation and potential entry on a breakout + retest.
This is not financial advice. Always do your own research.
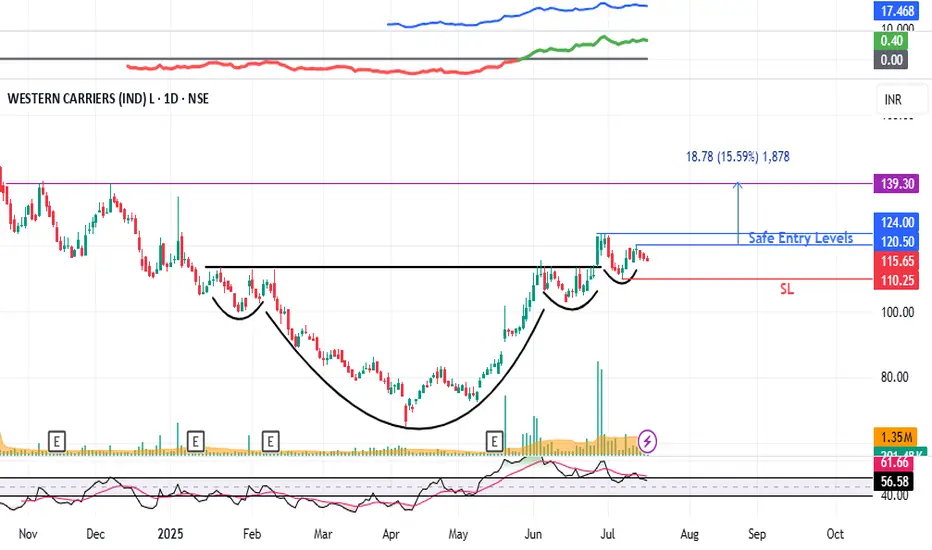
Western Carriers (WCIL) : Breakout Candidate#WCIL #patterntrading #breakout #breakoutstock #inverseheadandshoulder #swingtrading
WCIL : Swing Trade
>> Low PE Stock
>> Inverse Head & Shoulder pattern visible
>> Breakout & Retest Done
>> Ready for New Highs
>> Low Risk High Reward Trade
Swing Traders can lock profits at 10% & Keep Trailing
Pls Comment , Boost and Follow for more such Analysis
Disc : Charts shared are for Learning Purpose and not a Trade recommendation, Consult your Financial afvisor or a SEBI Registered Advisor before taking postion in it.
16.07.25 Morning ForecastPairs on Watch -
FX:GBPJPY
FX:GBPNZD
FX:USDJPY
A short overview of the instruments I am looking at for today, multi-timeframe analysis down to what I will be looking at for an entry. Enjoy!

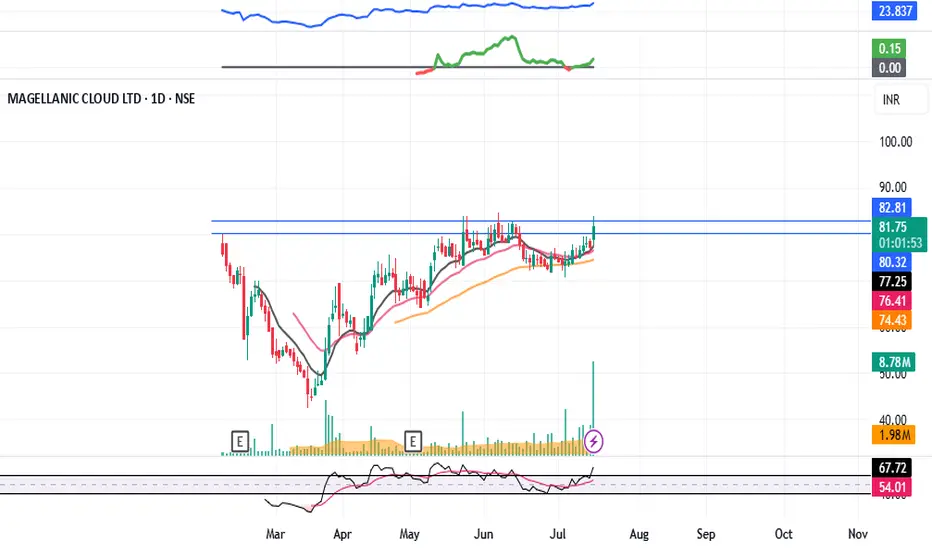
MCLOUD : Post IPO Base Breakout#MCLOUD #IPOstock #breakout #momentumstock #patterntrading #cupandhandle
MCLOUD : Swing Trade
>> Post IPO Base Breakout
>> Cup & Handle Pattern
>> Trending Stock
>> Good Strength & Volume Building-up
Swing Traders can lock profit at 10% and keep trailing
Pls Boost, Comment & Follow for more analysis
Disc : Charts shared are for Learning purpose not a Trade Recommendation, Take postions only after consulting your Financial Advisor or a SEBI Registered Advisor.
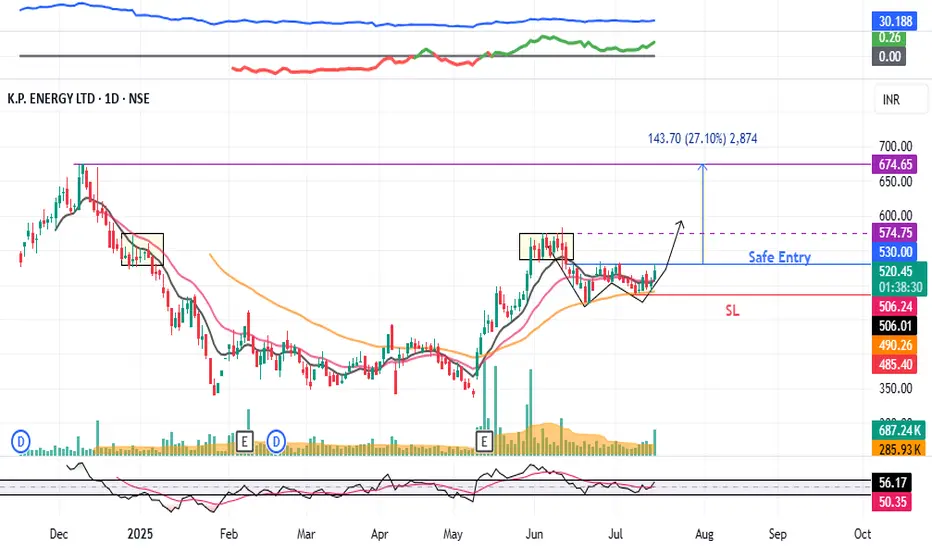
KPEL : Breakout stock#KPEL #swingtrade #breakoutstock #Wpattern #patterntrading
KPEL : Swing Trade
>> Trending Stock
>> W Pattern Breakout soon
>> Good Volumes & Strength
>> Good upside potential
Swing Traders can lock profit at 10% and keep trailing
Pls Boost, Comment & Follow for more analysis
Disc : Charts shared are for Learning purpose not a Trade Recommendation, Take postions only after consulting your Financial Advisor or a SEBI Registered Advisor.
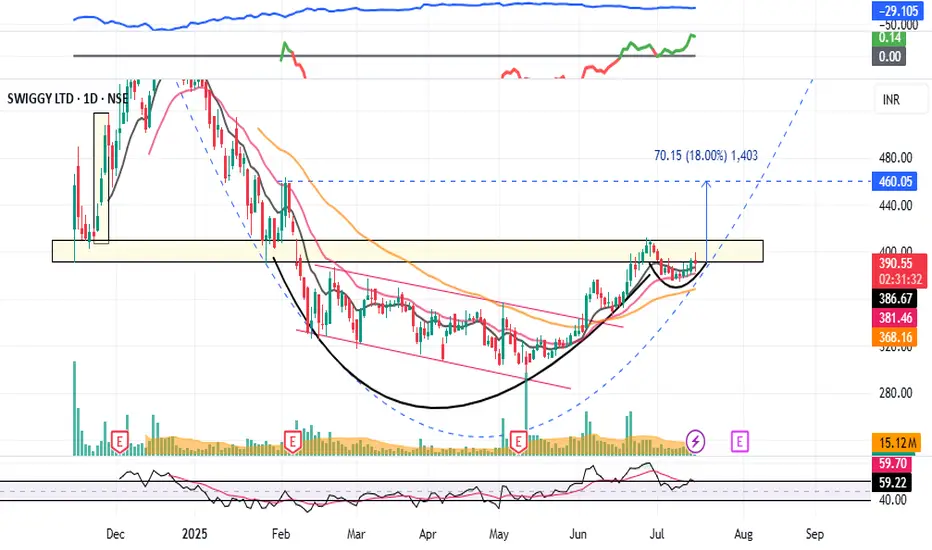
SWIGGY - Breakout Soon (1-3 months)#SWIGGY #breakoutstock #patterntrading #cupandhandle #roundingbottom #trendingstock
SWIGGY : Swing Trade (1-3 Months)
>> Breakout candidate
>> Trending stock
>> Cup and handle pattern
>> Rounding bottom in the long run
>> Good Strength & Volumes Dried up
Swing Traders can lock profit at 10% and keep trailing
Pls Boost, Comment & Follow for more analysis
Disc : Charts shared are for Learning purpose not a Trade Recommendation, Take postions only after consulting your Financial Advisor or a SEBI Registered Advisor.
15.07.25 Morning ForecastPairs on Watch -
FX:EURUSD
CAPITALCOM:DE40
FX:EURGBP
FX:GBPJPY
A short overview of the instruments I am looking at for today, multi-timeframe analysis down to what I will be looking at for an entry. Enjoy!

SPX - Next Target is 7000- SPX is currently trading around 6200 after breakout previous all time high.
- Price has formed a nice broadening wedge pattern and currently heading towards the next resistance line.
- We can expect a slight correction upt o 6100, and reversal towards 7000.
- I'm expecting SPX to hit 7000 target by Q1 of 2026.
Trade Opportunity
Entry: 6200
TP1: 6400
TP2: 6600
TP3: 6800
TP4: 7000
SL at: 6057
Stay tuned frequent updates
Cheers
GreenCrypto

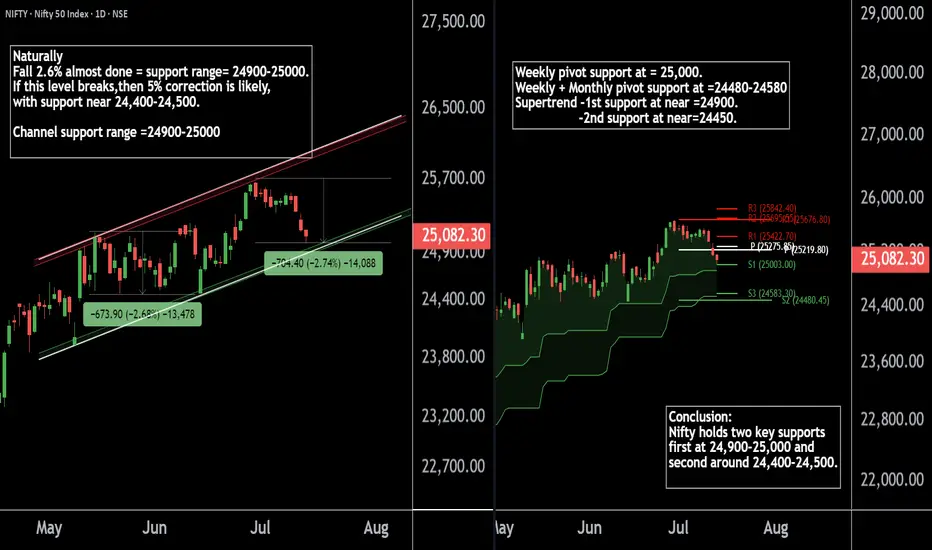
Nifty50's Key Level !! Keep an eye on these levels.Here are two Nifty charts, both on the daily timeframe.
Current Correction:
Nifty has naturally corrected by 2.7%, currently trading in the 24,900-25,000 range.
Weekly Pivot:
The weekly pivot support is positioned at 25,000, providing immediate support.
Support Levels:
First Support: 24,900-25,000 zone.
Second Support: If this level breaks, Nifty may see a 5% correction, with the next support around 24,400-24,500.
If this level sustain we may see higher prices in Nifty 50.
Thank You !!
14.07.25 Morning ForecastPairs on Watch -
FX:NZDCAD
FX:USDJPY
FX:EURUSD
OANDA:US30USD
A short overview of the instruments I am looking at for today, multi-timeframe analysis down to what I will be looking at for an entry. Enjoy!

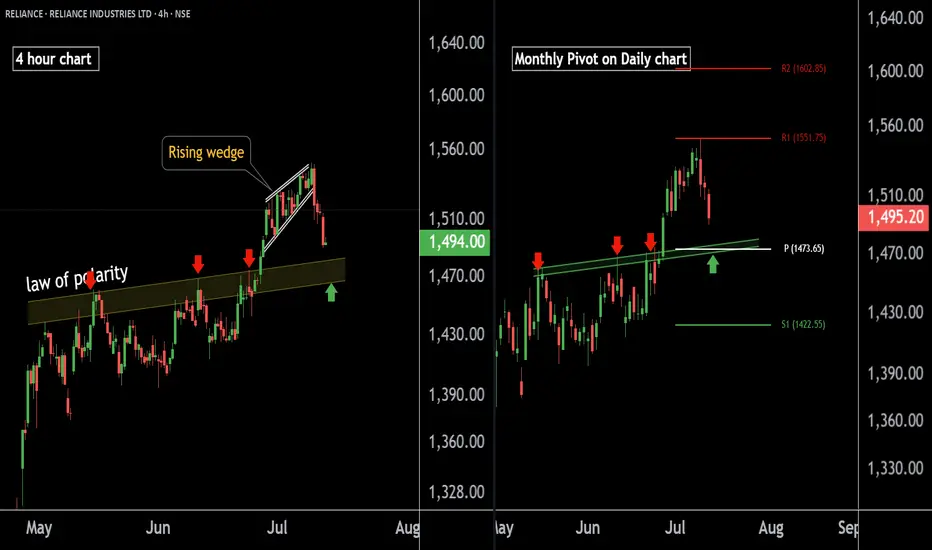
RELIANCE INDUSTRIES at Best Support !! Keep It On Your Radar !!There are two chart of RELIANCE INDUSTRIES on Daily and 4 hour Timeframe.
On the 4-hour timeframe, Reliance is likely to respect its LOP (Line of Polarity) as support, with the support range near 1460-1475.
On the Daily timeframe, the monthly pivot is also positioned around 1473, reinforcing this level as a potential halt or reversal zone.
If this level is sustain we may see higher prices in RELIANCE INDUSTRIES.
Thank You !!!
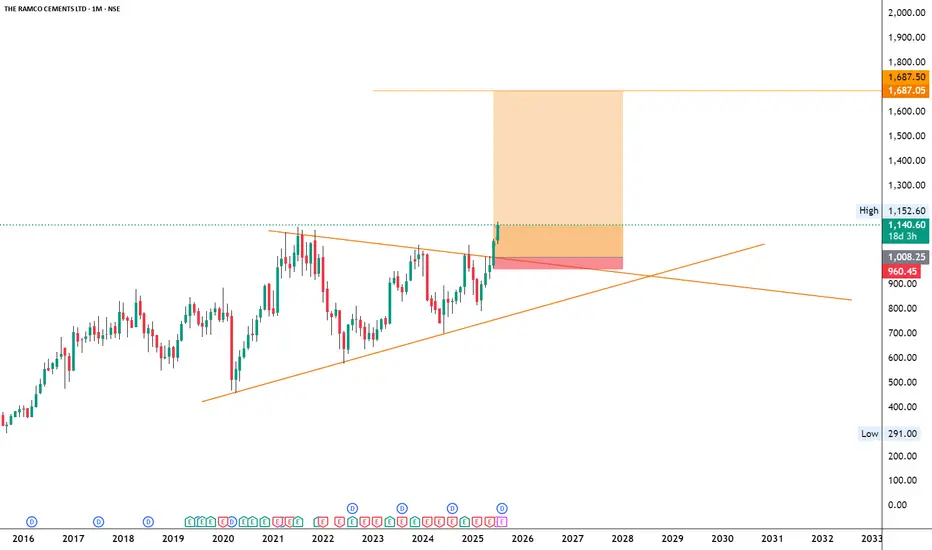
RAMCOCEM
NSE:RAMCOCEM
Note :
1. One should go long with a Stop Loss, below the Trendline or the Previous Swing Low.
2. Risk :Reward ratio should be minimum 1:2.
3. Plan your trade as per the Money Mangement and Risk Appetite.
Disclamier :
>You are responsible for your profits and loss.
>The idea shared here is purely for Educational purpose.
>Follow back, for more ideas and their notifications on your email.
>Support and Like incase the idea works for you.
BF UTILITIES LTD 'S KEY LEVEL || BREAKDOWN OR BREAKOUT ??These are two charts of BF Utilities – one on the daily timeframe and the other on the weekly timeframe.
In the first chart : BF Utilities is sustaining near its Law of Polarity (LOP), which is acting as a resistance zone around the 880–890 range.
In the second chart : BF Utilities is forming a Rising Wedge pattern, with the resistance also lying in the 870–880 zone.
If this level is sustain ,then we may see lower price in BF Utilities.If this level is broken, the stock may move towards the upper boundary of the channel.
Thank you !!

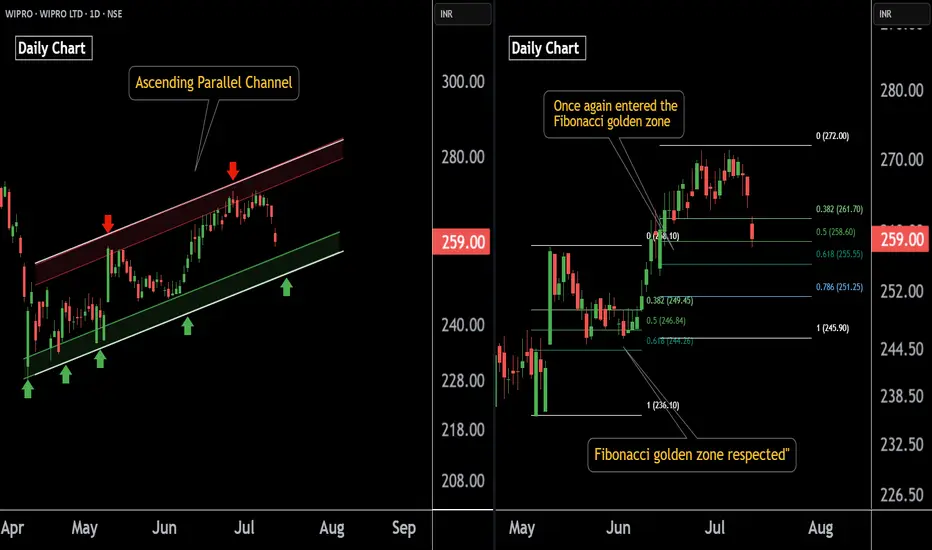
Wipro AT Best Support Zone These are two daily timeframe charts of Wipro .
In the first chart : Wipro is trading within an ascending parallel channel, with the lower boundary positioned around the ₹251–₹254 zone.
Wipro has previously respected the Fibonacci golden zone, and the stock is once again approaching this key retracement area. A potential bounce from this zone is likely if the level is respected again around 254 near .
If this level is sustain , then we may see higher Prices in Wipro.
Thank You !!
Lupin At Best Support !! This is the 4 hour chart of Lupin .
Lupin appears to be forming a potential Three Drives bullish reversal pattern, with both drives terminating at the 1.27 Fibonacci extension level, indicating a possible exhaustion of the downtrend.
Lupin is trading within a well-defined descending channel. It has once again approached the lower boundary of the channel, which lies around the 1865–1880 zone, and is showing signs of a bounce.
If this level is sustain , then we may see higher prices in Lupin.
Thank You !!

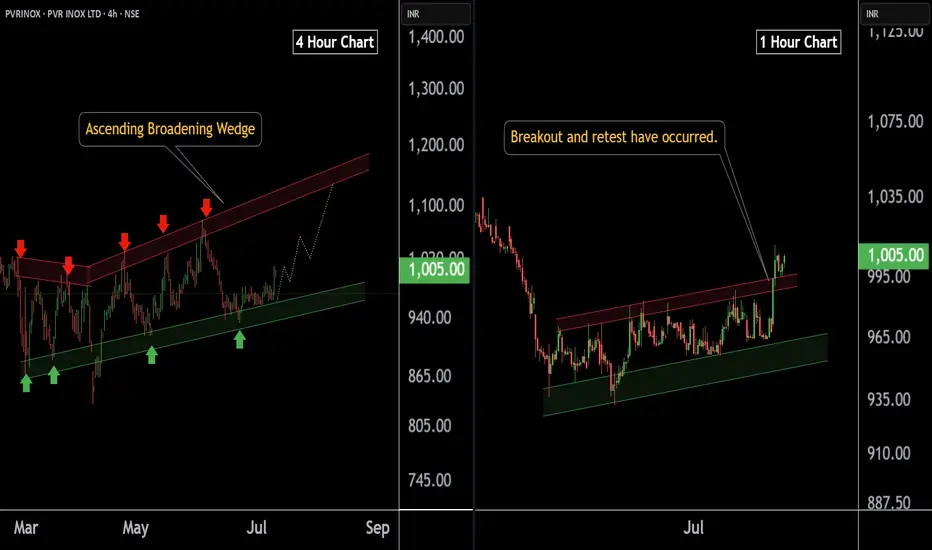
PVR INOX LTD at Best Support !! Breakout Alert !!Here are two charts of PVERINOX — one in the 4-hour timeframe and the other in the 1-hour timeframe.
4-Hour Timeframe Chart:
In the 4-hour timeframe, Power Inox is respecting its lower boundary, with a support range between 930–950.
ChatGPT said:
1-Hour Timeframe Chart:
In the 1-hour timeframe, the stock has given a breakout and has now completed a retest at 980-990 level.
If this level is sustain then , we may see higher in PVRINOX.
Thank you !!