HYPE/USDT Technical Analysis (4H Chart)🔍 HYPE/USDT Technical Analysis (4H Chart)
High Time Frame (Daily): Bullish
Despite recent pullbacks, the overall trend remains bullish on the daily timeframe. However, current price action suggests a potential fakeout or legitimate breakdown, as we test key structural and volume-based supports.
Short-Term Time Frame (4H): Bearish
The 4-hour chart displays clear bearish pressure, confirmed by the Three Black Crows candlestick pattern. This signals sustained selling interest and supports the current downward move.
🧱 Key Zones
Supply Zone: $41.7 – $45.9
Strong resistance marked by prior selling pressure and overlapping FVGs.
Demand Zone: $24.4 – $26.3
Historical area of buying support, aligned with a low-volume node and an unfilled FVG.
📏 Fair Value Gaps (FVGs)
Above Price:
Four 4H FVGs act as upside inefficiencies, offering targets in a bullish recovery:
~$34.9
~$36.6
~$37.8
~$40.0 (psychological level & POC cluster)
Below Price:
One major 4H FVG remains unfilled, directly above the demand zone.
📐 Fibonacci Analysis
Price is testing the Golden Pocket (0.618–0.65) from the recent swing low to high.
A clean break below this area (with confirmation) targets the unfilled FVG around $30, and potentially the demand zone ($24.4–$26.3).
📉 Volume Profile Insight
Volume is clustered around $34–$37, indicating strong past market participation.
Very low volume between $29–$30, creating a volume void — if price loses support at the FVG and golden pocket, it could rapidly drop into the demand zone.
🔻 OBV Analysis (Volume Momentum)
OBV has broken below a larger rising wedge, confirming bearish divergence.
A falling wedge is now forming within OBV.
Break below this wedge: Confirms further price breakdown.
Reclaim of the larger wedge trendline: Suggests potential bullish reversal.
✅ Trade Scenarios
🔺 Bullish Scenario
Trigger: Bullish reversal pattern at the golden pocket (e.g., double bottom, falling wedge, inverse H&S) + OBV recovery.
Entry: Upon confirmation around $32.5.
Targets:
$34.9 (FVG)
$36.6 (FVG)
$37.8 (FVG)
$40.0 (psychological)
Stop: Below $30 or recent swing low (tight below FVG).
🔻 Bearish Scenario
Trigger : Confirmed breakdown of golden pocket & 4H FVG with OBV falling wedge breakdown.
Entry : Below $32.5 with confirmation (e.g., retest or strong momentum candle).
Targets:
$30.0 (psychological level)
$28.5 (FVG zone)
$26.3 → $24.4 (Demand zone)
Stop : Above golden pocket resistance (~$33.8–$34.2).
📝 Conclusion: The market is at a pivotal point. A confirmed break below $32.5 could accelerate selling due to the volume gap, while a strong bullish reaction from the golden pocket could drive a recovery toward $40. Always wait for confirmation before entering either scenario.
Patterntrading

NRBBEARING
NSE:NRBBEARING
Note :
1. One should go long with a Stop Loss, below the Trendline or the Previous Swing Low.
2. Risk :Reward ratio should be minimum 1:2.
3. Plan your trade as per the Money Management and Risk Appetite.
Disclaimer :
>You are responsible for your profits and loss.
>The idea shared here is purely for Educational purpose.
>Follow back, for more ideas and their notifications on your email.
>Support and Like incase the idea works for you.

BEMLNSE:BEML
Note :
1. One should go long with a Stop Loss, below the Trendline or the Previous Swing Low.
2. Risk :Reward ratio should be minimum 1:2.
3. Plan your trade as per the Money Management and Risk Appetite.
Disclaimer :
>You are responsible for your profits and loss.
>The idea shared here is purely for Educational purpose.
>Follow back, for more ideas and their notifications on your email.
>Support and Like incase the idea works for you.

20.06.25 Morning ForecastPairs on Watch -
FX:EURJPY
FX:EURNZD
FX:EURUSD
A short overview of the instruments I am looking at for today, multi-timeframe analysis down to what I will be looking at for an entry. Enjoy!

19.06.25 Morning ForecastPairs on Watch -
FX:EURGBP
FX:EURAUD
FX:AUDNZD
A short overview of the instruments I am looking at for today, multi-timeframe analysis down to what I will be looking at for an entry. Enjoy!

18.06.25 Morning ForecastPairs on Watch -
FX:GBPJPY
FX:EURCAD
FX:CADJPY
A short overview of the instruments I am looking at for today, multi-timeframe analysis down to what I will be looking at for an entry. Enjoy!

17.06.25 Morning ForecastPairs on Watch -
FX:EURUSD
FX:CADCHF
OANDA:XAUUSD
A short overview of the instruments I am looking at for today, multi-timeframe analysis down to what I will be looking at for an entry. Enjoy!

MUTHOOT FINANCE at Best Resistance !! This is the Daily Chart of MUTHOOT FINANCE .
MUTHOOTFIN is currently trading near its resistance range around the 2700 range.
MUTHOOTFIN has completed its upward move as per its natural price behavior, with the rise reaching up to the 2700 range.
If This level is sustain , then we may see lower prices in MUTHOOTFIN.
Thank You !!

PI INDUSTRIES LTD at Key Resistance !!This is the Weekly chart of PI INDUSTRIES LTD.
PIIND having good law of polarity at 4300-4400 range.
If this level is sustain , then we may see lower prices in PIIND.
Thank You !!
Meta Platforms - The rally is clearly not over!Meta Platforms - NASDAQ:META - can rally another +30%:
(click chart above to see the in depth analysis👆🏻)
Some people might say that it seem counterintuitive to predict another +30% rally on Meta Platforms while the stock has been rallying already about +750% over the past couple of months. But price action and market structure both tell us, that this will soon turn into reality.
Levels to watch: $850
Keep your long term vision!
Philip (BasicTrading)

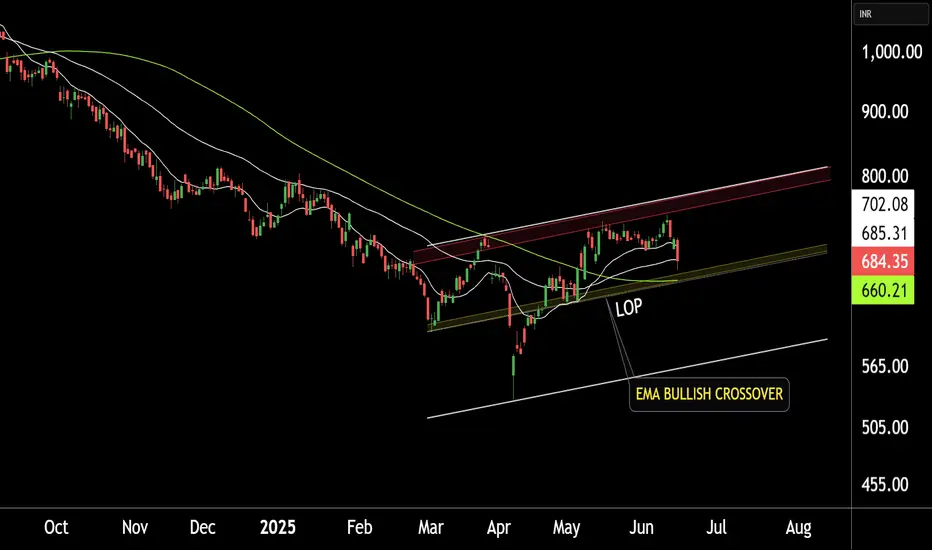
TATA MOTORS LTD at BEST SUPPORT !!This is the Daily chart of TATA MOTORS LTD.
TATA MOTORS having good law of polarity at 660 range.
TATAMOTORS has given a positive EMA crossover, with its support range lying around 660-680.
If this level is sustain , then We may see higher price in TATAMOTORS.
Thank you !!
16.06.25 Morning ForecastPairs on Watch -
FX:NZDUSD
FX:CADJPY
OANDA:XAUUSD
FX:EURCAD
A short overview of the instruments I am looking at for today, multi-timeframe analysis down to what I will be looking at for an entry. Enjoy!

$MSTR bear flag forming; Daily $350 targetHello, quick mobile chart posting here. Simple looking bear flagging forming. Bitcoin having some downside action, I imagine Saylor will be buying some Bitcoin soon again as well. This should see $350. Looking for a short. + geopolitical turmoil hits crypto/Bitcoin the hardest and most violent. The 20 and 50 EMA are aligned as well with the Supertrend Downtrend showing $350.
WSL.

PVR INOX LTD at Support Zone.This is the 4 hours Chart of PVRINOX.
PVRINOX having good law of Polarity at 930 range.
If this level is sustain , then we may see higher prices in PVRINOX.
Thank You !!

BAJAJ FINANCE 's Key Resistance Zone This is 4 hour chart of BAJAJ FINANCE
BAJAJ FINANCE having good Resistance at 9800 and 10200 range.
If this level is sustain , then we may see lower prices in BAJAJ FINANCE.
Thank You !!

13.06.25 Morning ForecastPairs on Watch -
FX:GBPUSD
FX:EURUSD
A short overview of the instruments I am looking at for today, multi-timeframe analysis down to what I will be looking at for an entry. Enjoy!

Nvidia - The breakout will eventually follow!Nvidia - NASDAQ:NVDA - will break out soon:
(click chart above to see the in depth analysis👆🏻)
Over the course of the past couple of days, we saw a quite strong rally of +50% on Nvidia. Considering the market cap of this company, such a move is quite impressive. Following this overall very strong bullish momentum, an all time high breakout is quite likely to happen soon.
Levels to watch: $150
Keep your long term vision!
Philip (BasicTrading)

BTC/USDTDo you think Bitcoin has just formed a double top, or is it showing a different pattern? Personally, I think we might range a bit from here and then possibly continue the uptrend. I'm not really into pattern trading—so you tell me, are we bullish or bearish?"

BAJAJ HOUSING FINANCE at Support Zone !!This is the Daily chart of BAJAJ HOUSING FINANCE .
BAJAJHFL is trading near in an ascending parallel channel and it's Support zone at 116-120 range.
If this level is sustain , then we may see higher in the BAJAJHFL.
Thank You !!

12.06.25 Morning ForecastPairs on Watch -
OANDA:JP225USD
FX:AUDJPY
FX:USDJPY
FX:GBPJPY
A short overview of the instruments I am looking at for today, multi-timeframe analysis down to what I will be looking at for an entry. Enjoy!

INDUSTOWER at Best Support Zone !!This is the 4 hour chart of INDUSTOWER .
INDUSTOWER having good Law of Polarity at 360-370 range.
The stock is forming a Descending Triangle pattern on th L.O.P at 375 range .
If this level is sustain , then we may see higher prices in INDUSTOWER.
Thank You !!

11.06.25 Morning ForecastPairs on Watch -
PEPPERSTONE:COCOA
FX:GBPAUD
FX:CHFJPY
A short overview of the instruments I am looking at for today, multi-timeframe analysis down to what I will be looking at for an entry. Enjoy!

Bitcoin - Here we have the all time high!Bitcoin - CRYPTO:BTCUSD - is just getting started:
(click chart above to see the in depth analysis👆🏻)
It was really just a matter of time until we see a new all time high on Bitcoin. Consindering that over the past two months alone, Bitcoin rose another +50%, this was a clear indication that bulls are taking over. But this all time high is clearly not the end of the bullrun.
Levels to watch: $300.000
Keep your long term vision!
Philip (BasicTrading)
